SPY 0DTE Bearish Setup – Max Pain in Play (Aug 7)## ⚠️ SPY 0DTE Bearish Setup – Max Pain in Play (Aug 7)
**Low-Conviction Market = Short-Term Put Opportunity?**
### 🧠 Summary of Consensus:
All major models (Grok, Gemini, Claude, Llama, DeepSeek) flag the **lack of bullish momentum**.
💡 **Key Bearish Signals**:
* 📉 Price below VWAP
* 📊 Weak volume
* 📉 RSI & flow: neutral to bearish
* 🎯 Max pain hovering near current price
---
### 🤖 AI Model Breakdown:
| Model | Bias | Action |
| -------------- | ------------------- | ---------------------------- |
| Grok / Gemini | 🔻 Weak Bearish | No trade (wait for clarity) |
| Claude / Llama | 🔻 Moderate Bearish | Buy PUT at \$630 |
| DeepSeek | ⚖️ Mixed Bearish | Monitor – no high-conviction |
🧭 **Consensus Direction**: **Weak Bearish**
---
### 🔧 Trade Setup (0DTE)
| Metric | Value |
| ---------------- | ------------- |
| 🎯 Instrument | SPY |
| 🔀 Direction | PUT (SHORT) |
| 💵 Entry Price | 0.78 |
| 💣 Strike Price | 630.00 |
| 🛑 Stop Loss | 0.39 |
| 🎯 Profit Target | 1.56 |
| 📅 Expiry | Aug 07 (0DTE) |
| ⏰ Entry Timing | Market Open |
| 📈 Confidence | 60% |
📊 **Risk/Reward**: 1:2
📉 **Time Decay Alert**: Tight stop-loss due to fast 0DTE decay.
---
### ⚠️ Key Watchouts:
* 📈 Reclaiming VWAP = **exit immediately**
* 🔊 Sudden volume spike = momentum shift risk
* 🧯 Keep position size small – this is a **scalp**, not a swing
---
### 🧠 Final Take:
> If SPY stays pinned below VWAP & max pain remains, this **0DTE put could print**. But discipline is everything — tight stop, tight leash. ⚔️
---
🧠 **Follow for daily AI-backed earnings & SPY plays**
📉 **Not financial advice – manage risk like a pro**
SPY trade ideas

SPY | Bullish | Day Trading AMEX:SPY
SPY has confirmed a bullish structural shift on the 1H chart following the August 1st liquidity sweep.
Key Developments:
A Higher Low (HL) was formed after a significant breakdown and volume climax.
Price has since reclaimed the descending trendline and is now trading above all major EMAs.
Momentum continues to build, supported by:
A clean break of the 38.2% Fibonacci retracement (631.37)
Bullish RSI posture with values trending above 50
Volume profile showing absorption on red candles and confirmation on green
Target Levels:
635.26: Prior resistance and key structural target
637.51: Upper liquidity zone and TP2 based on extension geometry
Support & Risk Management:
Primary structural support: 631.00–630.70
Invalidation level: 629.50
As long as price holds above 631, I remain bullish and expect continuation toward the 635–637 range in the next 1–2 sessions. Pullbacks into the 631 zone would present a potential re-entry or add-on opportunity.

SPY vs VIX two day LongSPY falling wedge - short term oversold - VIX wainning, looks like VIX to retreat to $18.50 area which translates into a DCB on SPY. We'd Aug 6th target = $631/633 Gap fill then probable resumption to the downside to test $613. Good luck 👍

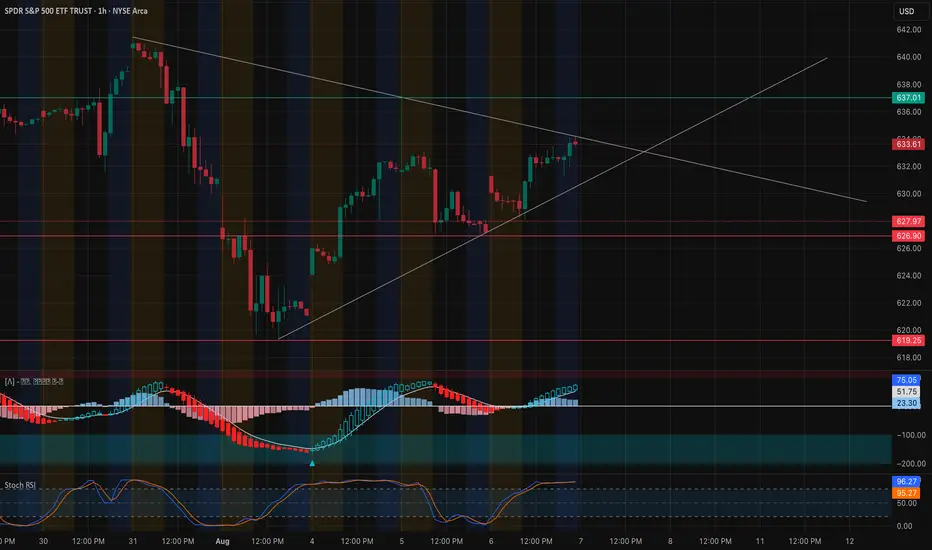
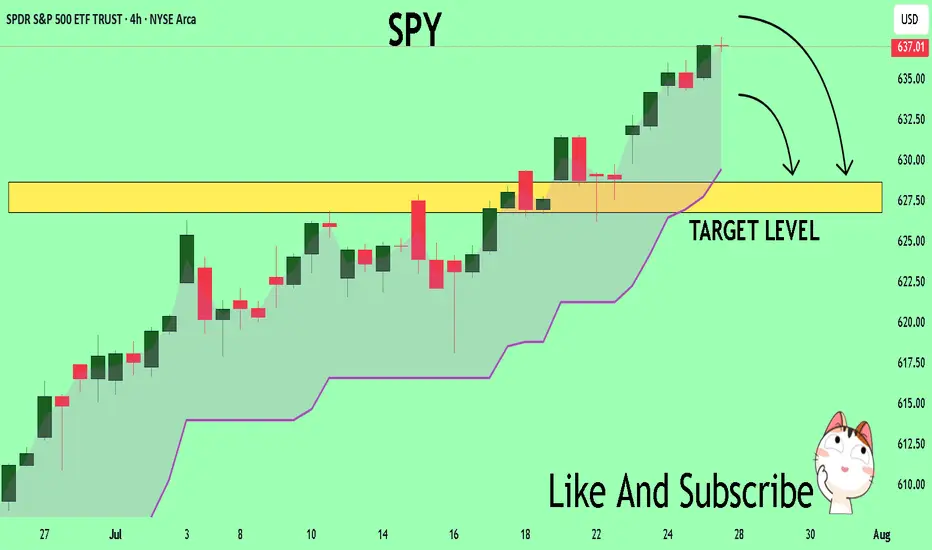
SPY Approaching Apex — Breakout or Trap Ahead? Aug 7SPY Approaching Apex — Breakout or Trap Ahead? 🔥
📊 Technical Analysis (1H Chart)
SPY has reclaimed the rising wedge support trendline and is now grinding just beneath a confluence of resistance near 633.61. This is the third test of this breakout zone, forming a squeeze triangle with lower highs and higher lows.
Key Structure Notes:
* Bullish momentum continues to build on the MACD histogram with rising blue bars and a bullish cross already established.
* Stoch RSI is extremely overbought (96+), which suggests caution — SPY is vulnerable to rejection if buyers lose steam.
* Price action remains orderly and within trendline compression. A breakout above 634 could unleash aggressive buying, while losing 631 opens the door to retest 627–628 demand.
Intraday Levels to Watch:
* 📈 Resistance: 633.61 → 634.20 → 637.00 (key horizontal resistance and fib extension)
* 📉 Support: 631.00 → 628.20 → 626.90 → 619.25
🔍 Options GEX & Dealer Positioning
The GEX board favors bullish continuation — but also hints at gamma traps near the top:
* 🟢 634.00–634.20: 91.11% GEX concentration at 2nd CALL Wall — this is the biggest dealer hedge wall; could act as resistance or gamma squeeze fuel if broken.
* 🟢 637.00: Highest positive net GEX → if SPY pushes above 634 and holds, momentum could carry toward 637.
* 🔴 626.00–625.00: Layered PUT walls and HVL zone provide strong downside cushion.
* 🧭 Net GEX is moderately positive, suggesting dealer flows will slow upside moves unless a sharp squeeze kicks in. Watch IVR (15.3) — low enough to allow scalps but not favorable for selling premium.
🧠 Game Plan & Thoughts
* 🔓 Bullish Scenario: Break and hold above 634 confirms the triangle breakout → target 637–638 next.
* 🛑 Bearish Rejection: Failure at 633.61 or loss of 631 reopens path back to 628.20–626.90 zone.
* 🎯 Suggested Setup: Long scalp above 634 → TP: 637 | SL: 631.
Short setup below 631 → TP: 627 | SL: 634.
Momentum is on the bulls' side for now, but you're buying into a potentially crowded breakout zone. Watch volume and reaction around 634 — breakout or fade will decide next leg.
This analysis is for educational purposes only and does not constitute financial advice. Always manage your risk.
Gapperzville in SPY Both ways“Gappersville” indeed — this SPY 15-minute chart is lit with strategic gaps that are magnetizing price back to equilibrium.
Quick Breakdown:
🔍 Gap Analysis (Intraday Bias)
Two visible unfilled gaps:
First Gap: ~624 to ~627 (partially mitigated)
Second Gap: ~628 to ~630.75 (currently testing EQ of this zone)
Price is now in the Premium Zone (above 0.5 Fibo) from the swing high drop — nearing liquidity sweep territory.
⚙️ Smart Money Concepts (SMC)
Multiple CHoCH and BOS confirm dynamic shifts in structure.
That recent BOS above 627.39 is key — suggesting a short-term bullish microstructure.
Equilibrium at 629.77 is now being tested — price may chop here unless liquidity gets swept above 630.76.
🟦 Discount Zone Support
Deep discount zone lies between 614.06 – 611.96.
This demand zone is still untouched and could act as a high-probability reversion target if the premium structure fails.
🧮 Fibonacci Clusters
Heavy cluster from 630.84 – 633.64 = major confluence + potential rejection/sell zone.
If price gaps up into this zone on low volume, expect short entries from liquidity-based traders.
🔊 Volume Profile
Spike on Aug 2 & 4 suggests buy programs were activated—likely institutional reaction to demand near 620–624.
🔮 Strategic Forecast (as of Aug 4 close)
⚠️ Bearish bias remains intact unless SPY reclaims and closes above 637.57 (weak high).
🎯 Watch for:
Shorts around 633–635 (confluence zone)
Mean reversion into 624.01 or even 619.70
Final demand: 614–612 zone

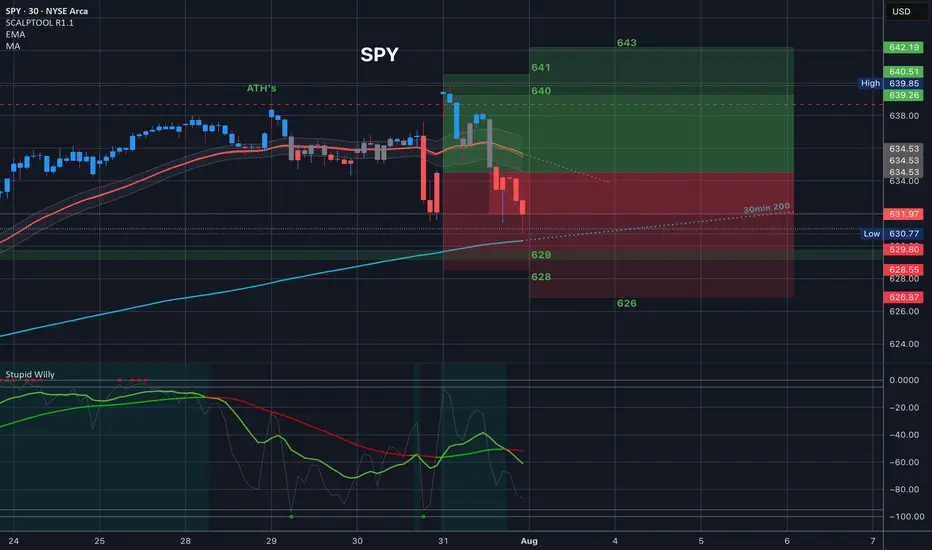
$SPY Analysis, Key Levels & Targets 8.4.25
Today’s Trading Range - we have a great range expansion here from last Friday’s drop. Some interesting targets here. Let me know what you see.
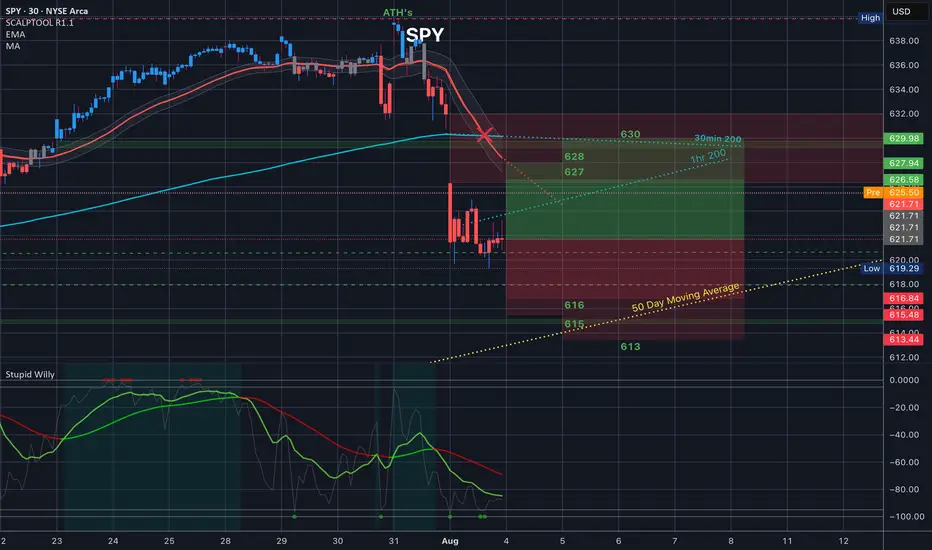
$SPY Analysis, Key Levels & Targets
This is how last night’s members chart played out and it was amazing. We opened at the top of the trading range and all of the spreads at the top paid as we dropped back to the 30in 200MA
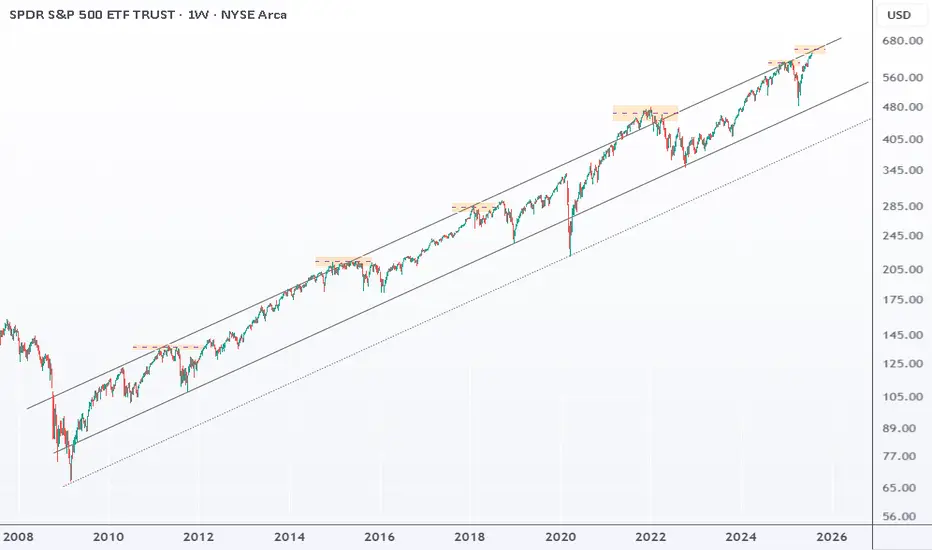
SPY : back near the top of its upward channelSPY is back near the top of its upward channel, a strong resistance.
Every time this happened since 2011, markets dropped 10–27%.
Still trending up, but this setup doesn’t look great.
Since the April low, SPY is up 30%, short-term trend is stretched and vulnerable.
SPY Will Collapse! SELL!
My dear subscribers,
This is my opinion on the SPY next move:
The instrument tests an important psychological level 637.01
Bias - Bearish
Technical Indicators: Supper Trend gives a precise Bearish signal, while Pivot Point HL predicts price changes and potential reversals in the market.
Target - 628.63
About Used Indicators:
On the subsequent day, trading above the pivot point is thought to indicate ongoing bullish sentiment, while trading below the pivot point indicates bearish sentiment.
Disclosure: I am part of Trade Nation's Influencer program and receive a monthly fee for using their TradingView charts in my analysis.
———————————
WISH YOU ALL LUCK
Spy.. 650 topLooking for a top this week
The top of this monthly trendline dating from 2009 should be tagged this week around 643-645.00. As you can see price can grind up here for weeks until the BIG drop.
That grind would possibly be distribution with
A range trade of 620-640 for the month of august. historically Sept is very bearish and could see a drop back below 600 then.
Summer price action looks like so
Smaller price action (Tradeable technicals)
Bull flag early July has us squeezing up this last leg here..
If we gap up Sunday night then i like the short around 638ish
If we gap down and flush i like the dip buy around 634 gap close with the next target being 640+
Daily candle closed outside Bbands so I would not long this on any gap up... on a big earnings week like this, there will be a shake out day or a flush to try and stop out all of those who bought long last week for this weeks earnings.
TVC:NYA or NYSE
Has also reached the top of its weekly channel here. 21,000 will be tough. Price could grind up here but I'd be careful trading anything non tech.
As far as tech goes
Here's NASDAQ:QQQ
monthly chart (Logarithmic)
We have room for 575-580
This should compliment Spy 550
Zoomed in on the daily chart and it's climbing back up to the resistance shown on the monthly
Hourly chart shows price action from early july... tight channel illustrates how frustrating the swings have been
562-563 is support heading into next week. If we have a major gap up Sunday night I would look to open short near 570 for a pullback before ER... if we gap down, I would buy the dip around 563 and average down if need be down to 561..
We should tag 575 this week
The sector that I think lags the most this week is the banking sector... AMEX:XLF
Banks outperform the entire market last week and are overheated at resistance I think they lag this week
I will update this more throughout the week if necessary..
$SPY – FOMC Risk Window: AI Predicts Downside Drift📅 Forecast Window: July 30 – August 30, 2025
📡 Powered by VolanX Protocol v3.0 | WaverVanir DSS
🏛️ MACRO SETUP – JULY 31 FOMC:
🏦 Fed Funds Rate: 5.50% (expected hold)
🧊 Inflation: Cooling but sticky (CPI ~3.2%, PCE ~2.6%)
💼 Labor Market: Slowing but not collapsing
📈 CME FedWatch: 91% odds of no hike, but tone may be hawkish
🧠 Key Risk: Liquidity compression or prolonged pause = risk-off conditions
🧠 VOLANX PROTOCOL FORECAST (30-Day):
🔸 Current Price: $636.29
🔹 AI Target: $627.46 (−1.4%)
🟠 Signal: HOLD
🧮 Direction Accuracy: 85.5%
⚠️ Model Confidence: −2.049 (bearish drift)
📊 Volatility Forecast: Low (~1.36%) = slow bleed conditions
📉 WAVERVANIR DSS SIGNAL:
🔸 Sentiment Score: 78
🔻 15D Forecast: $630.49 (−0.8%)
🔻 30D Forecast: $616.68 (−2.9%)
📉 Bias: Mild Bearish
🛑 Signal: Hedge exposure, reduce risk, do not chase longs
🔥 OPTIONS FLOW SNAPSHOT:
🚨 $1.53M Call Sweep (645C, Aug 8) = Speculative breakout bet
📉 Multiple Put Sweeps (633–634P, Aug 4) = Institutional hedging
🟢 Mid-dated 638C/645C flows (Aug 15–22) show straddle-the-news positioning
📐 TECHNICAL ZONES TO WATCH:
📉 Support Levels:
$627 = Fib + VolanX AI Target
$616 = DSS Forecast + liquidity pivot
📈 Resistance Levels:
$639 → Gap close
$645 → Major breakout trigger (options magnet)
🕯️ Structure: Distribution bias → No clear momentum unless Fed surprises dovish
🎯 STRATEGIC OUTLOOK:
Scenario Probability SPY Reaction
🟡 Hawkish Hold 65% Pullback toward $627
⚪ Neutral Hold 25% Choppy → $639 max
🟢 Dovish Surprise 10% Spike to $645+
📌 VolanX Protocol Guidance:
"This is a defense window. AI models and options flow both suggest uncertainty, not conviction. Trim longs, hedge risk, and wait for post-FOMC confirmation."
#SPY #VolanX #WaverVanir #FOMC #MacroForecast #OptionsFlow #DSS #SMC #LiquidityTraps #SmartMoney #TradingSignals #AITrading #FederalReserve #TechEarnings #RiskWindow #HawkishFed #FedHold #MacroAI
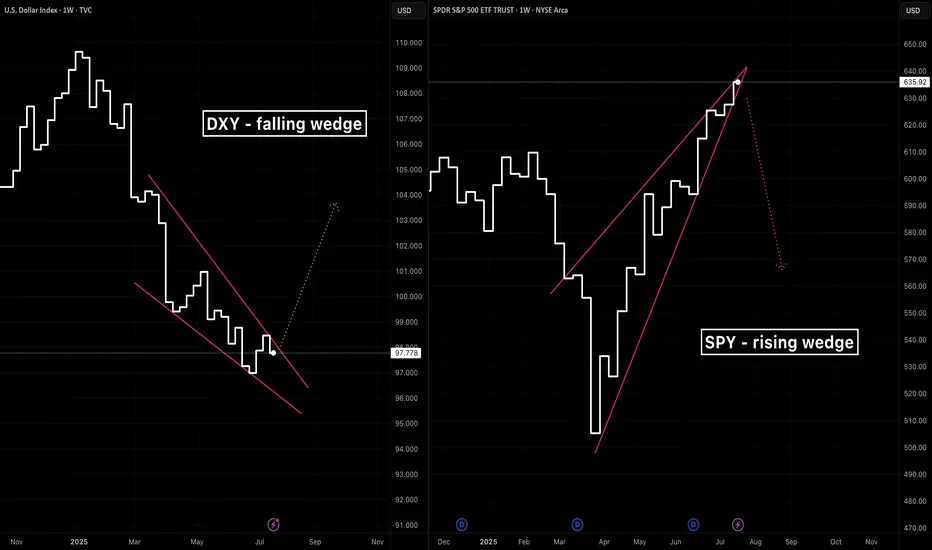
A tale of two wedgesIn early 2025 we’ve seen two classic wedge patterns on two of the market’s most watched charts: a falling wedge on the U.S. Dollar Index ( TVC:DXY ) and a rising wedge on the S&P 500 ETF ( AMEX:SPY ). Alone each tells its own tale—but together they sketch a tug‑of‑war between a fading dollar and resilient equities.
The Falling Wedge on DXY
A falling wedge in a downtrend signals waning bearish momentum and often precedes a bullish reversal once price breaks the upper trendline.
The Rising Wedge on SPY
A rising wedge in an uptrend is classically a bearish reversal pattern —a breakdown below the lower trendline confirms sellers are gaining control.
A Converging Reversal
Given the well‑known inverse correlation between the dollar and most assets, it’s noteworthy that both asset classes are flashing signs of a reversal. Taken together that makes a compelling argument.
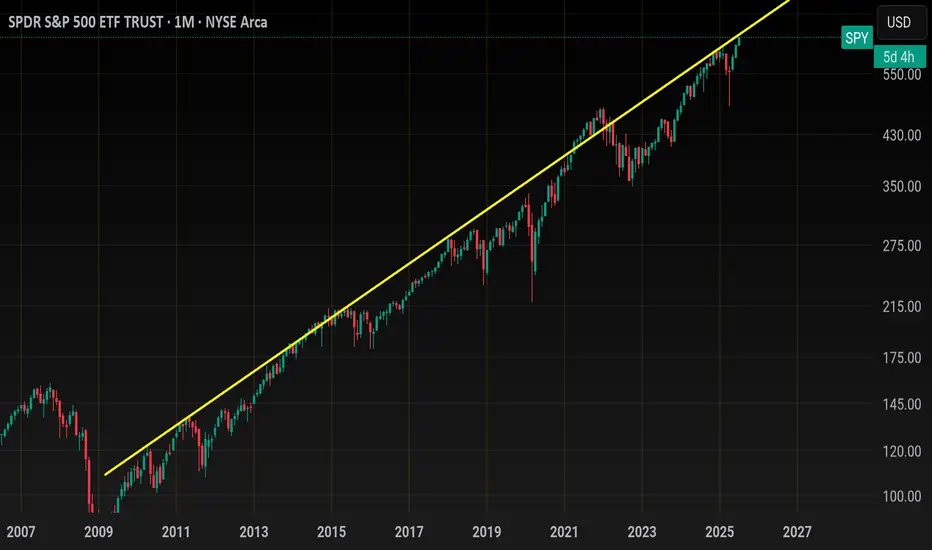
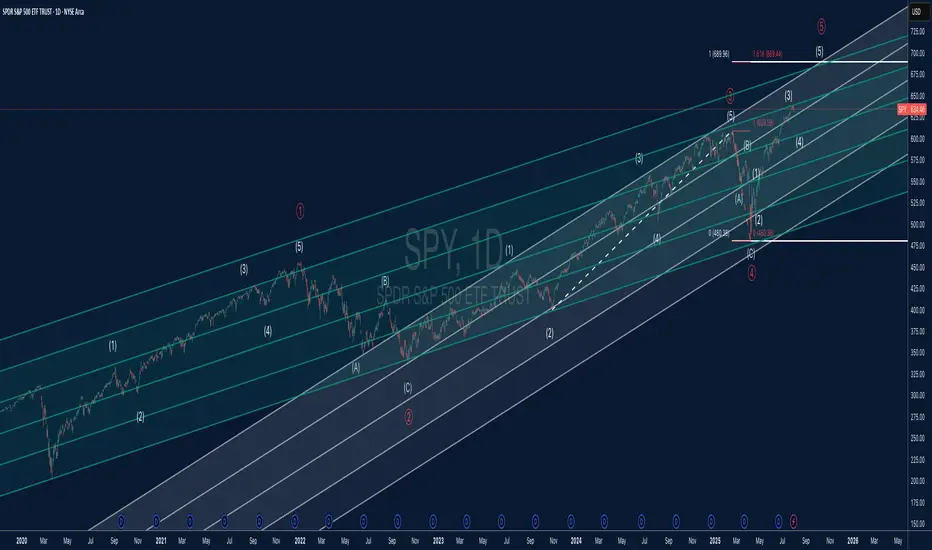
SPY Elliott Wave + Parallel Channel AnalysisThis chart offers a detailed Elliott Wave count for SPY (S&P 500 ETF) on the daily timeframe, combined with a structured parallel channel system to highlight key trend dynamics.
🔍 Elliott Wave Structure:
The price is currently advancing in what appears to be Wave (5) of Primary Wave ⑤, suggesting we may be in the late stages of a major impulsive cycle.
Each impulsive and corrective wave is clearly labeled, with the internal structure confirming classic Elliott Wave symmetry.
The 1.618 Fibonacci extension around $689 marks a critical upside target and potential completion zone for Wave (5).
Wave (4) held well at the lower channel boundary and completed near $480, establishing a solid base for the current advance.
📊 Channel Insights:
A system of parallel channels is applied to capture the overall trend and momentum structure.
Price is climbing toward the upper boundary of the long-term ascending channel, which has acted as dynamic resistance in previous waves.
The median lines have provided reliable support and resistance throughout the trend, making them important reference levels moving forward.
⚠️ Key Technical Levels:
Resistance: $689.44 (Wave ⑤ target at 1.618 Fib extension)
Support Zones: $609 (prior Wave (3) high), $575 (mid-channel support), and $480 (major cycle low)
A confirmed break above $690 could suggest a parabolic move, but risk of reversal grows as the upper channel is tested.
📈 Market Outlook:
SPY remains in a strong uptrend but is nearing a major confluence of wave and channel resistance.
A completed five-wave sequence would suggest the potential for a higher-degree correction, possibly leading into a Wave A/B/C scenario.
Short-term bullish bias remains valid while above $609, but watch for divergence or exhaustion signs near $689–$700.
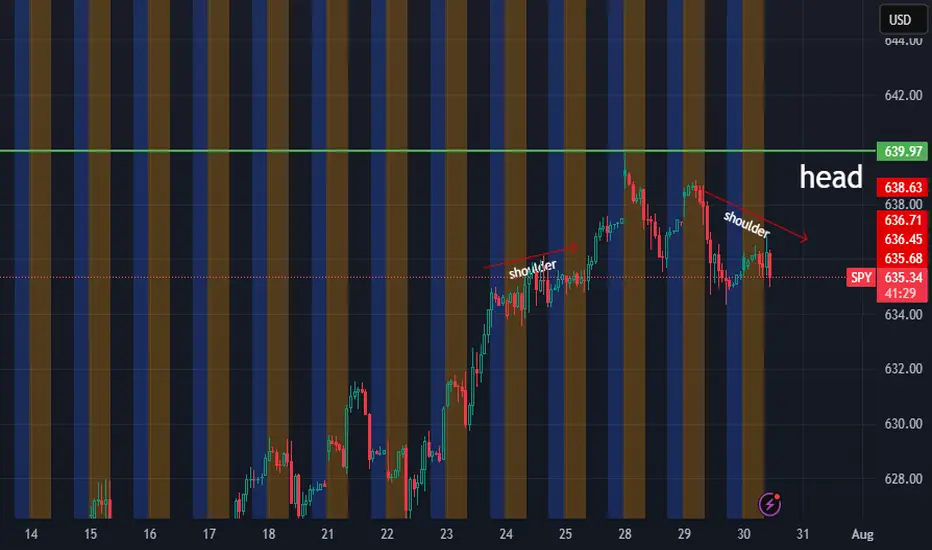
short IdeaLooking at the hourly chart, and I am noticing a head and shoulders build up.
day trade idea: 635 entry 637 stop 630 profit target
swing trade idea: short above 630 long below
Nightly $SPY / $SPX Scenarios for July 30, 2025🔮 Nightly AMEX:SPY / SP:SPX Scenarios for July 30, 2025 🔮
🌍 Market‑Moving News 🌍
🧭 Fed Holds Steady Amid Uncertainty
As the FOMC enters its July 29–30 meeting, the Fed is expected to keep rates unchanged at 4.25%–4.50%, even as one or two governors may dissent in favor of rate cuts amid mixed economic data. Recent strength in consumer spending contrasts with weakness in housing and construction.
🌐 U.S.–China Trade Talks Resumed in Stockholm
Talks are under way aimed at extending the tariff truce before the August 12 deadline. Both sides described progress as constructive, though analysts remain cautious on the timeline and potential outcomes.
🛢️ Oil Up / Dollar Firmer, But Risks Remain
Brent crude hit ~$72.50/barrel (+3.5%) while WTI rose to ~$69.20 on a mix of geopolitical tension (possible new Russia tariffs) and trade optimism. The U.S. dollar edged higher following the U.S.–EU trade agreement.
📈 IMF Revises Up Global Growth—but Flags Tariff Risks
The IMF raised its 2025 growth forecast to 3.0% and maintained 3.1% for 2026, citing pre-emptive consumer demand—but warned that ongoing U.S. tariffs and policy inconsistency could dampen momentum.
📊 Key Data Releases & Events 📊
📅 Wednesday, July 30:
FOMC Rate Decision & Powell Press Conference
The Fed is expected to hold interest rates steady. Powell’s remarks will be closely watched for signals on the timing of future cuts and views on inflation and labor markets.
Advance Q2 U.S. GDP Estimate
The first look at Q2 growth is expected around +1.9% YoY, potentially validating a rebound after Q1’s contraction.
June PCE & Core PCE (Personal Consumption Expenditures Index)
The Fed's preferred inflation gauge. Markets will monitor if core inflation remains elevated, which may reinforce policy caution.
⚠️ Disclaimer:
This summary is for educational and informational purposes only—it is not financial advice. Always consult a licensed financial advisor before making investment decisions.
📌 #trading #stockmarket #economy #Fed #GDP #inflation #trade #tariffs #markets

SPY: Pullback or No? Hey everyone,
Posting again for next week.
My thoughts, not advice as usual.
Hope you find them helpful and I hope you all have a great and sunny weekend!
Take care and safe trades!

Nightly $SPY / $SPX Scenarios for July 29, 2025🔮 Nightly AMEX:SPY / SP:SPX Scenarios for July 29, 2025 🔮
🌍 Market‑Moving News 🌍
U.S.–EU Trade Deal Sparks Optimism
The U.S. and EU signed a trade framework allowing a 15% tariff rate on most EU imports, averting harsher penalties. The S&P 500 and Nasdaq both closed at fresh record highs, supported by upbeat tech earnings sentiment—Tesla advanced on a new $16.5B AI chip deal with Samsung—while U.S.–China trade talks resume in Stockholm.
Fed Likely to Hold Rates; Political Pressure Mounts
The Fed is expected to leave its benchmark rate at 4.25%–4.50% at the July 29–30 FOMC meeting. Chair Powell faces growing political pressure from President Trump to cut rates and concerns about central bank independence remain elevated.
Trade Talks Extension to Avoid Tariff Hike Deadline
The August 1 tariff deadline looms. Markets are watching to see if trade deals with China, Canada, and the EU extend the pause or risk new tariffs. Volume in AI/chip stocks and industrials reflects sensitivity to trade developments.
📊 Key Data Releases & Events 📊
📅 Tuesday, July 29
FOMC Meeting Begins — All eyes on Fed rate decision and updated projections.
GDP (Advance Q2 Estimate) — Expected around +1.9% on signs of economic rebound.
⚠️ Disclaimer:
This summary is for educational and informational purposes only—it is not financial advice. Always consult a licensed financial advisor before making investment decisions.
📌 #trading #stockmarket #economy #Fed #trade #tariffs #PCE #jobs #technicalanalysis

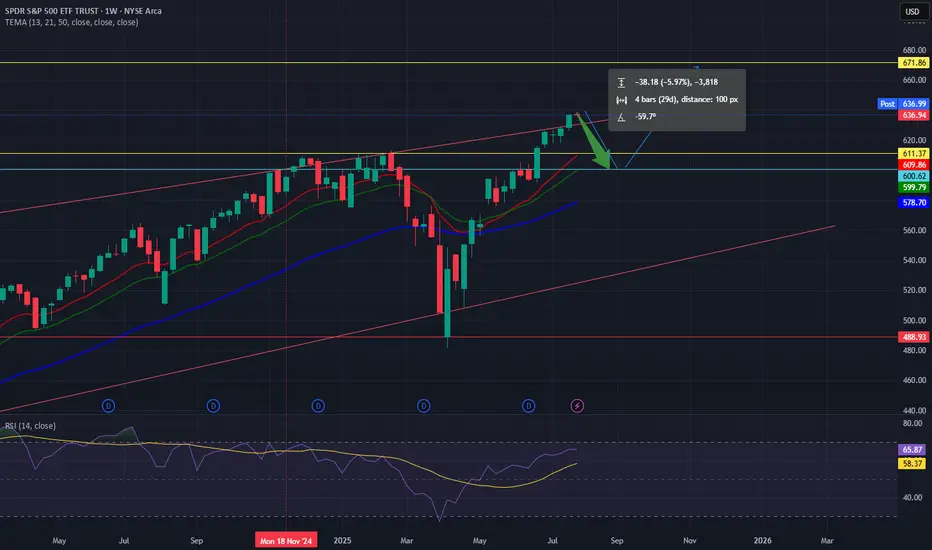
SPY Weekly Chart: Rising Wedge Signals Imminent PullbackSPY Weekly Chart Overview (Current Price: ~637)
🧭 Context:
Indicators: TEMA (13/21/50) & RSI (14)
Price is extended, RSI near overbought (65.87), and forming a rising wedge — a bearish pattern.
🔻 Bearish Setup: Rising wedge signals possible reversal.
Momentum weakening despite higher highs.
Price extended above TEMA — a 600–610 pullback looks likely.
📊 Key Levels:Resistance: 672
Support: 611–600 → 578 → 488
Break below 600 could trigger broad downside.
🟢 Bullish Case:
Breakout above 672 with volume = momentum continuation (AI/FOMO driven).
🎯 Conclusion:
SPY is technically stretched. Risk/reward favors caution.
Watch for pullback to 600–610
The Current State and Future Direction Of The S&P 5006/9/24
Created By Joeseph Emanuel Dennis
Idea:
Critical area and critical moment in not only the NASDAQ but for the entire bull market otherwise we'll start a prolonged retracement or an unlikely bear market turnaround. My SPY target remains 600 based on previous positive FOMC, CPI, Job Report Data, Rate Cuts, Elections, and Current Institutional development. On the technical side, the higher high movement began at the start of 2023 my initial target was 480 and I was correct! after the September weekly retracement on SPY, we have been pushing higher despite January's negative economic data and the conflict with IRAN. The daily is set to move currently above the 20MA with the weekly bullish and the monthly extremely bullish. IMPORTANT WEEK AHEAD! the future data will determine if the bullish trend will progress onward FOMC meeting will either scare people out of the market or drive the market into a rally along with central bank stocks. My bet is bullish even though inflation is record high thanks to the Biden administration we somehow keep pushing higher makes you wonder if the positive economic data is even accurate is employment being at a record high is that a good thing? Many Americans find them selfs more with two jobs or even three jobs is that a positive thing? Underemployment is also at record highs are these post-college graduates getting the salary they deserve or are they settling with two low-wage jobs? Nonetheless, the bull market will rain on with a summer rally. I will keep watching in case something turns around the enemy isn't Jerome Powell it's the liars at the white house and the propaganda creators over at MSNBC.
Note: This goes for Bitcoin as well! 80K here we go!
Are you ready for this scenario?? BUY THE NEXT BOTTOM!!!Spx is gonna drop hard, are you ready to buy the next bottom?
I expect SPX to reach 4,440 atleast... NASDAQ, BITCOIN are gonna drop hard too...
BUY EVERYTHING IN 2026/2027 AND ENJOY THE NEXT CYCLE.
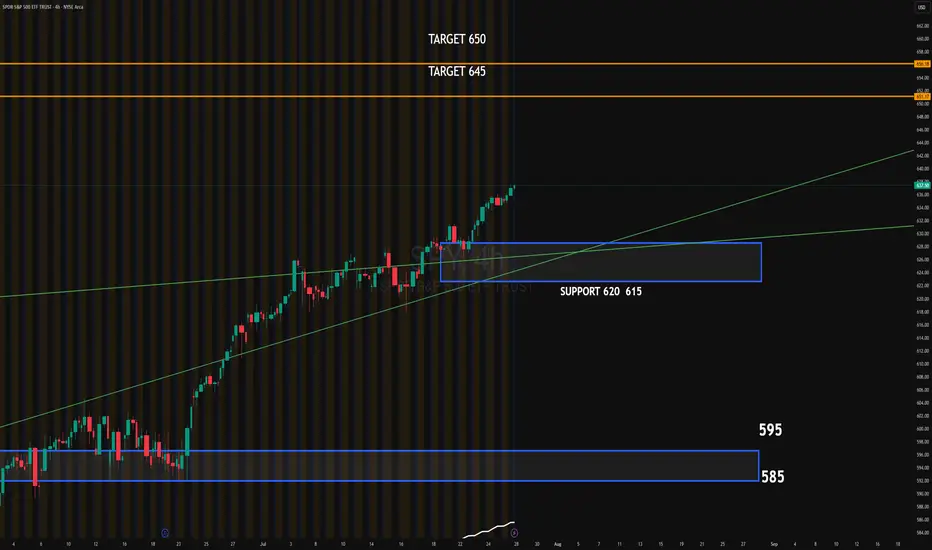
SPY 4HSSPY continues its bullish trend after breaking above the ascending channel. The recent breakout shows strong momentum, supported by institutional absorption around the 620–615 zone. This area now acts as key support.
Upside target: 645
Extended target: 650
Downside target if momentum fails: 620–615 zone, followed by 595
#SPY #globaltrade #investment #investing #stockmarket #wealth #realestate #markets #economy #finance #money #forex #trading #price #business #currency #blockchain #crypto #cryptocurrency #airdrop #btc #ethereum #ico #altcoin #cryptonews #Bitcoin #ipo
Trading as a Probabilistic ProcessTrading as a Probabilistic Process
As mentioned in the previous post , involvement in the market occurs for a wide range of reasons, which creates structural disorder. As a result, trading must be approached with the understanding that outcomes are variable. While a setup may reach a predefined target, it may also result in partial continuation, overextension, no follow-through, or immediate reversal. We trade based on known variables and informed expectations, but the outcome may still fall outside them.
Therefore each individual trade should be viewed as a random outcome. A valid setup could lose; an invalid one could win. It is possible to follow every rule and still take a loss. It is equally possible to break all rules and still see profits. These inconsistencies can cluster into streaks, several wins or losses in a row, without indicating anything about the applied system.
To navigate this, traders should think in terms of sample size. A single trade provides limited insight, relevant information only emerges over a sequence of outcomes. Probabilistic trading means acting on repeatable conditions that show positive expectancy over time, while accepting that the result of any individual trade is unknowable.
Expected Value
Expected value is a formula to measure the long-term performance of a trading system. It represents the average outcome per trade over time, factoring in both wins and losses:
Expected Value = (Win Rate × Average Win) – (Loss Rate × Average Loss)
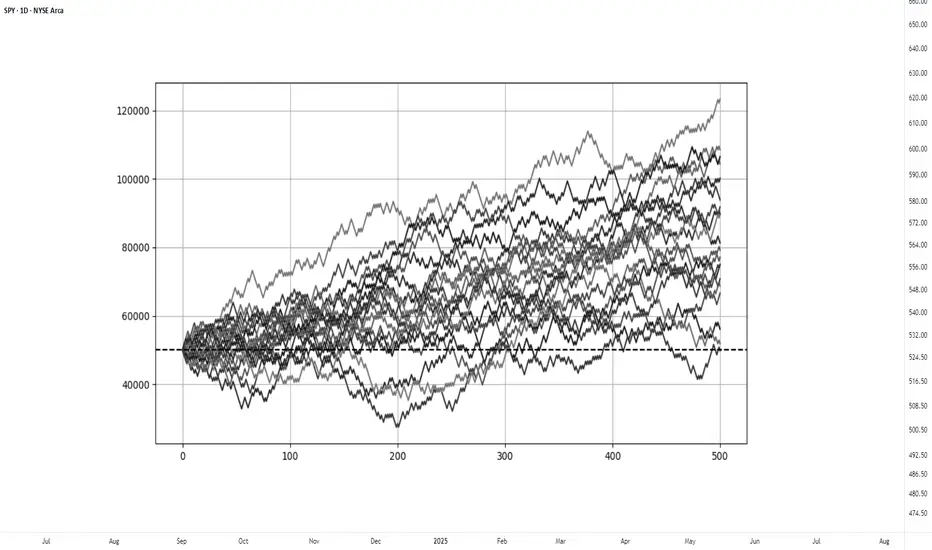
This principle can be demonstrated through simulation. A basic system with a 50% win rate and a 1.1 to 1 reward-to-risk ratio was tested over 500 trades across 20 independent runs. Each run began with a $50,000 account and applied a fixed risk of $1000 per trade. The setup, rules, and parameters remained identical throughout; the only difference was the random sequence in which wins and losses occurred.
While most runs clustered around a profitable outcome consistent with the positive expected value, several outliers demonstrated the impact of sequencing. When 250 trades had been done, one account was up more than 60% while another was down nearly 40%. In one run, the account more than doubled by the end of the 500 trades. In another, it failed to generate any meaningful profit across the entire sequence. These differences occurred not because of flaws in the system, but because of randomness in the order of outcomes.
These are known as Monte Carlo simulations, a method used to estimate possible outcomes of a system by repeatedly running it through randomized sequences. The technique is applied in many fields to model uncertainty and variation. In trading, it can be used to observe how a strategy performs across different sequences of wins and losses, helping to understand the range of outcomes that may result from probability.
Trading System Variations
Two different strategies can produce the same expected value, even if they operate on different terms. This is not a theoretical point, but a practical one that influences what kind of outcomes can be expected.
For example, System A operates with a high win rate and a lower reward-to-risk ratio. It wins 70% of the time with a 0.5 R, while System B takes the opposite approach and wins 30% of the time with a 2.5 R. If the applied risk is $1,000, the following results appear:
System A = (0.70 × 500) − (0.30 × 1,000) = 350 − 300 = $50
System B = (0.30 × 2,500) − (0.70 × 1,000) = 750 − 700 = $50
Both systems average a profit of $50 per trade, yet they are very different to trade and experience. Both are valid approaches if applied consistently. What matters is not the math alone, but whether the method can be executed consistently across the full range of outcomes.
Let’s look a bit closer into the simulations and practical implications.
The simulation above shows the higher winrate, lower reward system with an initial $100,000 balance, which made 50 independent runs of 1000 trades each. It produced an average final balance of $134,225. In terms of variance, the lowest final balance reached $99,500 while the best performer $164,000. Drawdowns remained modest, with an average of 7.67%, and only 5% of the runs ended below the initial $100,000 balance. This approach delivers more frequent rewards and a smoother equity curve, but requires strict control in terms of loss size.
The simulation above shows the lower winrate, higher reward system with an initial $100,000 balance, which made 50 independent runs of 1000 trades each. It produced an average final balance of $132,175. The variance was wider, where some run ended near $86,500 and another moved past $175,000. The drawdowns were deeper and more volatile, with an average of 21%, with the worst at 45%. This approach encounters more frequent losses but has infrequent winners that provide the performance required. This approach requires patience and mental resilience to handle frequent losses.
Practical Implications and Risk
While these simulations are static and simplified compared to real-world trading, the principle remains applicable. These results reinforce the idea that trading outcomes must be viewed probabilistically. A reasonable system can produce a wide range of results in the short term. Without sufficient sample size and risk control, even a valid approach may fail to perform. The purpose is not to predict the outcome of one trade, but to manage risk in a way that allows the account to endure variance and let statistical edge develop over time.
This randomness cannot be eliminated, but the impact can be controlled from position sizing. In case the size is too large, even a profitable system can be wiped out during an unfavorable sequence. This consideration is critical to survive long enough for the edge to express itself.
This is also the reason to remain detached from individual trades. When a trade is invalidated or risk has been exceeded, it should be treated as complete. Each outcome is part of a larger sample. Performance can only be evaluated through cumulative data, not individual trades.
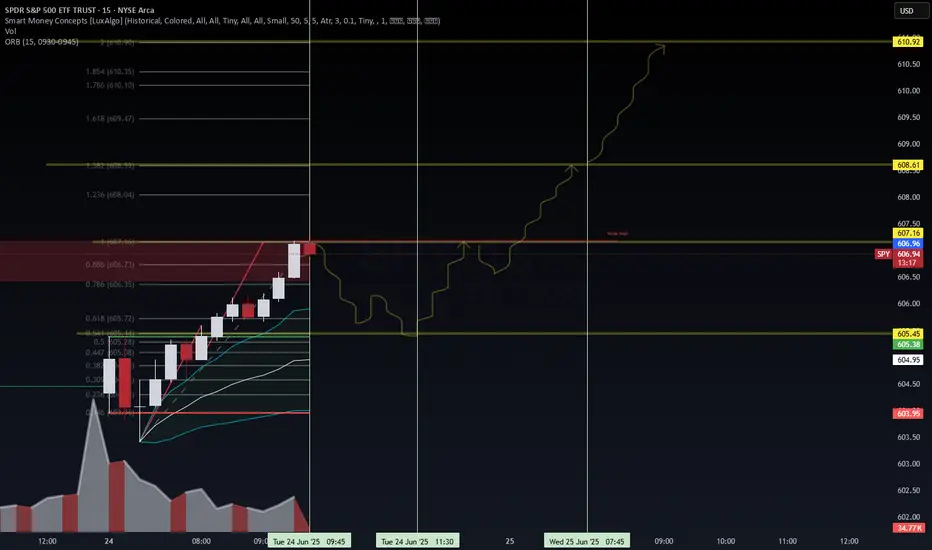
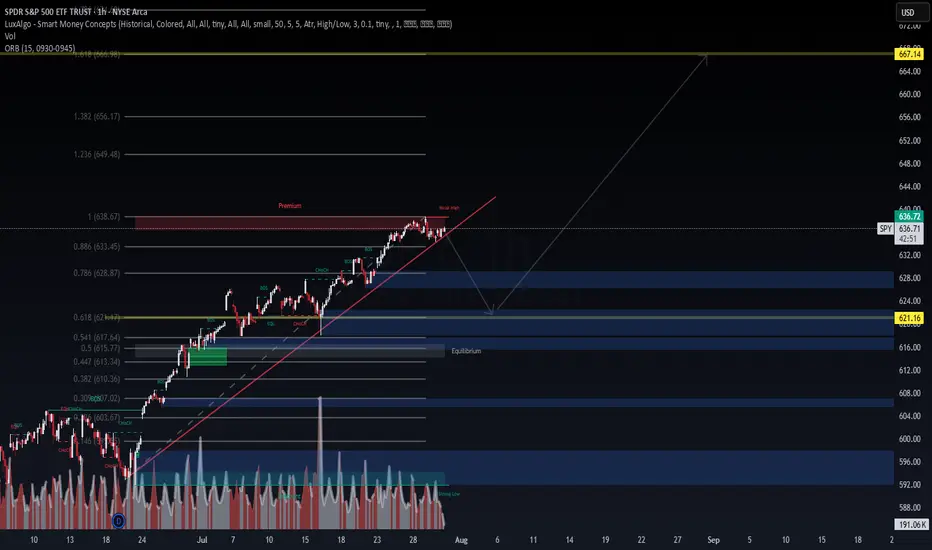
SPY 15-Min — Weak-High Sweep in Play• Discount BOS at 603.95 → impulsive leg to 606.7 (0.886)
• Weak high tagged at 607.16 – expecting continuation to 1.382 ≈ 608.61 then 1.854 ≈ 610.92
• Invalidation if price closes below 605.45 session VWAP band
• Targets: 608.61 → 610.92
• Risk: stop 604.9 (below 0.5 Fib)
VolanX bias remains risk-on while micro structure stair-steps above the 9-EMA channel.
Educational only – not financial advice
#SPY #SMP500 #OrderFlow #Fib #VolanX #WaverVanir