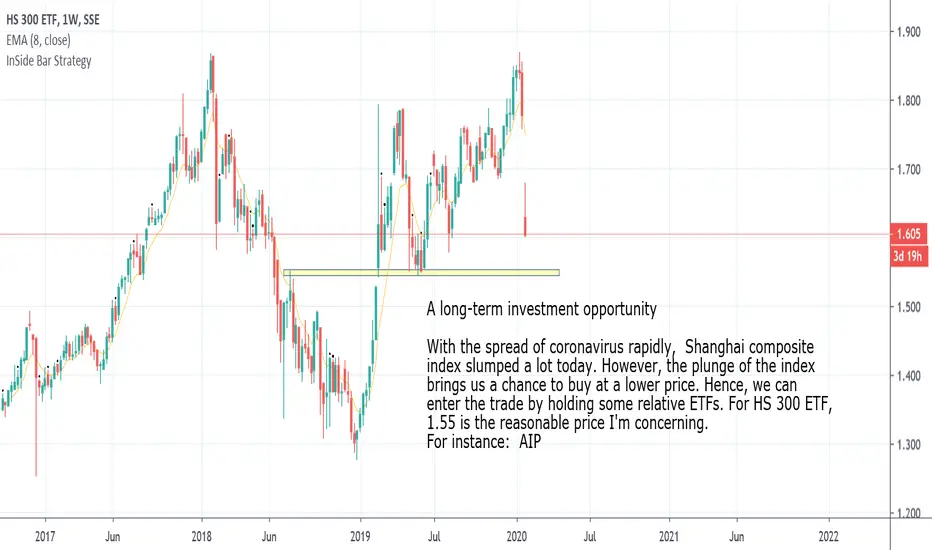
A long-term investment opportunity
With the spread of coronavirus rapidly, Shanghai composite index slumped a lot today. However, the plunge of the index brings us a chance to buy at a lower price. Hence, we can enter the trade by holding some relative ETFs. For HS 300 ETF, 1.55 is the reasonable price I'm concerning.
For instance
Key stats
About HS 300 ETF
Home page
Inception date
Mar 6, 2013
Structure
Open-Ended Fund
Replication method
Physical
Dividend treatment
Distributes
Primary advisor
E Fund Management Co., Ltd.
ISIN
CNE100001NS8
Tightly track the target index, and pursue the minimization of tracking deviation and tracking err.
Related funds
Classification
What's in the fund
Exposure type
Cash
Stock breakdown by region
Top 10 holdings
Summarizing what the indicators are suggesting.
Oscillators
Neutral
SellBuy
Strong sellStrong buy
Strong sellSellNeutralBuyStrong buy
Oscillators
Neutral
SellBuy
Strong sellStrong buy
Strong sellSellNeutralBuyStrong buy
Summary
Neutral
SellBuy
Strong sellStrong buy
Strong sellSellNeutralBuyStrong buy
Summary
Neutral
SellBuy
Strong sellStrong buy
Strong sellSellNeutralBuyStrong buy
Summary
Neutral
SellBuy
Strong sellStrong buy
Strong sellSellNeutralBuyStrong buy
Moving Averages
Neutral
SellBuy
Strong sellStrong buy
Strong sellSellNeutralBuyStrong buy
Moving Averages
Neutral
SellBuy
Strong sellStrong buy
Strong sellSellNeutralBuyStrong buy
Displays a symbol's price movements over previous years to identify recurring trends.
Frequently Asked Questions
An exchange-traded fund (ETF) is a collection of assets (stocks, bonds, commodities, etc.) that track an underlying index and can be bought on an exchange like individual stocks.
510310 trades at 4.005 CNY today, its price has fallen −1.43% in the past 24 hours. Track more dynamics on 510310 price chart.
510310 net asset value is 4.06 today — it's risen 4.26% over the past month. NAV represents the total value of the fund's assets less liabilities and serves as a gauge of the fund's performance.
510310 assets under management is 278.40 B CNY. AUM is an important metric as it reflects the fund's size and can serve as a gauge of how successful the fund is in attracting investors, which, in its turn, can influence decision-making.
510310 price has risen by 2.82% over the last month, and its yearly performance shows a 16.64% increase. See more dynamics on 510310 price chart.
NAV returns, another gauge of an ETF dynamics, have risen by 4.26% over the last month, showed a 9.87% increase in three-month performance and has increased by 20.88% in a year.
NAV returns, another gauge of an ETF dynamics, have risen by 4.26% over the last month, showed a 9.87% increase in three-month performance and has increased by 20.88% in a year.
510310 fund flows account for 53.82 B CNY (1 year). Many traders use this metric to get insight into investors' sentiment and evaluate whether it's time to buy or sell the fund.
Since ETFs work like an individual stock, they can be bought and sold on exchanges (e.g. NASDAQ, NYSE, EURONEXT). As it happens with stocks, you need to select a brokerage to access trading. Explore our list of available brokers to find the one to help execute your strategies. Don't forget to do your research before getting to trading. Explore ETFs metrics in our ETF screener to find a reliable opportunity.
510310 invests in cash. See more details in our Analysis section.
510310 expense ratio is 0.20%. It's an important metric for helping traders understand the fund's operating costs relative to assets and how expensive it would be to hold the fund.
No, 510310 isn't leveraged, meaning it doesn't use borrowings or financial derivatives to magnify the performance of the underlying assets or index it follows.
In some ways, ETFs are safe investments, but in a broader sense, they're not safer than any other asset, so it's crucial to analyze a fund before investing. But if your research gives a vague answer, you can always refer to technical analysis.
Today, 510310 technical analysis shows the neutral rating and its 1-week rating is buy. Since market conditions are prone to changes, it's worth looking a bit further into the future — according to the 1-month rating 510310 shows the strong buy signal. See more of 510310 technicals for a more comprehensive analysis.
Today, 510310 technical analysis shows the neutral rating and its 1-week rating is buy. Since market conditions are prone to changes, it's worth looking a bit further into the future — according to the 1-month rating 510310 shows the strong buy signal. See more of 510310 technicals for a more comprehensive analysis.
Yes, 510310 pays dividends to its holders with the dividend yield of 0.00%.
510310 trades at a premium (0.05%).
Premium/discount to NAV expresses the difference between the ETF’s price and its NAV value. A positive percentage indicates a premium, meaning the ETF trades at a higher price than the calculated NAV. Conversely, a negative percentage indicates a discount, suggesting the ETF trades at a lower price than NAV.
Premium/discount to NAV expresses the difference between the ETF’s price and its NAV value. A positive percentage indicates a premium, meaning the ETF trades at a higher price than the calculated NAV. Conversely, a negative percentage indicates a discount, suggesting the ETF trades at a lower price than NAV.
510310 shares are issued by E Fund Management Co., Ltd.
510310 follows the China Shenzhen SE / CSI 300 Index. ETFs usually track some benchmark seeking to replicate its performance and guide asset selection and objectives.
The fund started trading on Mar 6, 2013.
The fund's management style is passive, meaning it's aiming to replicate the performance of the underlying index by holding assets in the same proportions as the index. The goal is to match the index's returns.