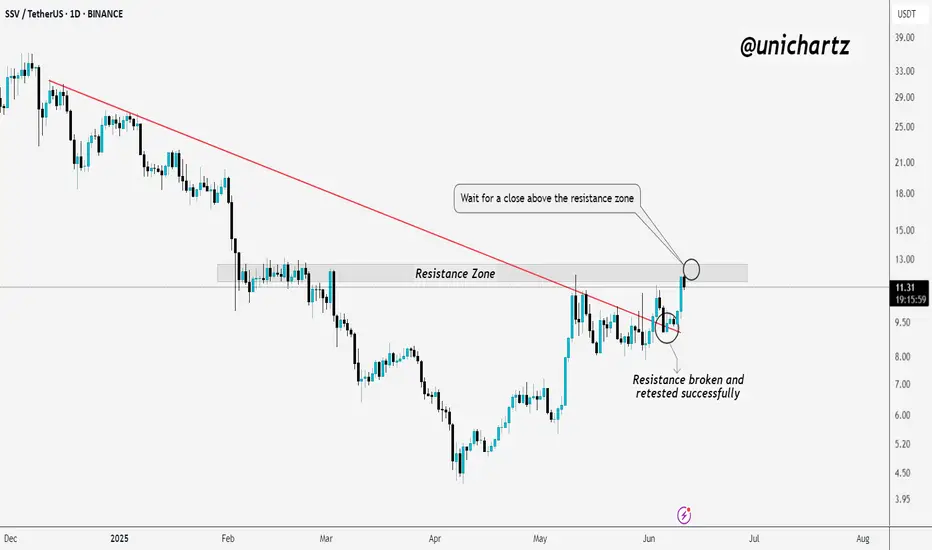
SSV | Bullish Market Structure Shift in PlayTSXV:SSV is showing strong bullish momentum. The key resistance line has been broken and successfully retested, confirming a shift in market structure.
Now, price is testing the major resistance zone. For further upside confirmation, it's important to wait for a clear daily close above this resist
SSV/USDTKey Level Zone: 8.000 - 8.700
HMT v8.1 detected. The setup looks promising, supported by a previous upward/downward trend with increasing volume and momentum, presenting an excellent reward-to-risk opportunity.
HMT (High Momentum Trending):
HMT is based on trend, momentum, volume, and market struc
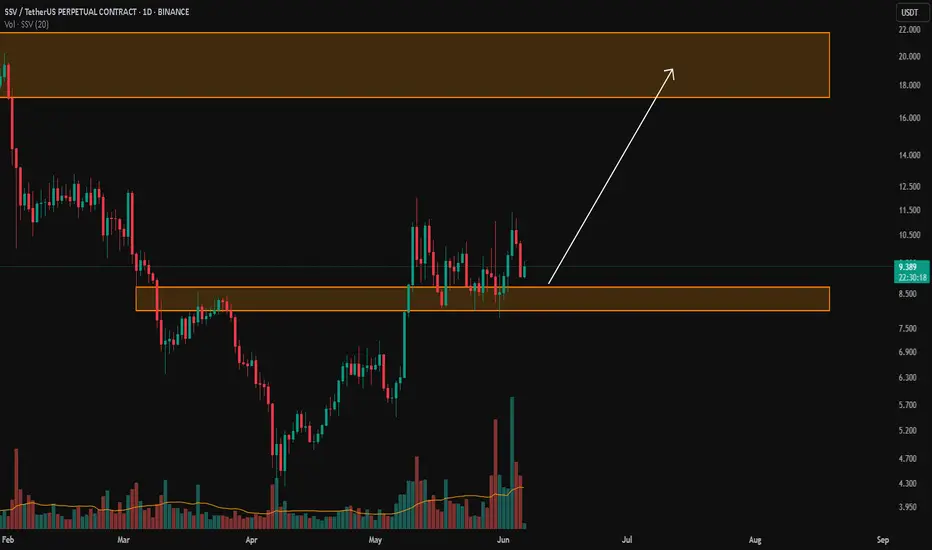
SSVUSDT Forming a Bullish PennantSSVUSDT is currently forming a bullish pennant pattern, which is typically a continuation formation that appears after a strong upward impulse. The pair recently experienced a significant breakout to the upside, followed by a consolidation phase forming a symmetrical triangle or pennant structure. W

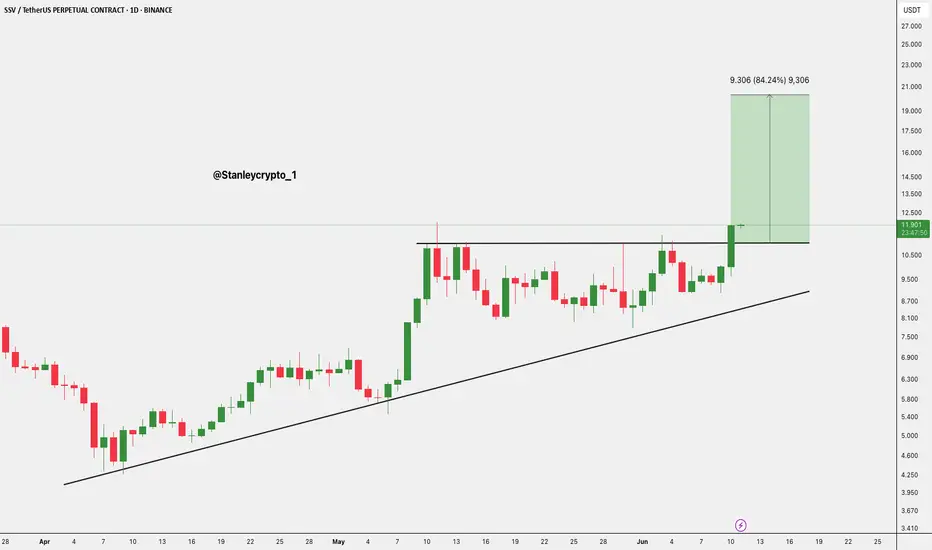
$SSV/USDT has broken out$SSV/USDT has broken out of a key ascending triangle on the daily chart, clearing resistance around $11.90 with strong momentum.
The breakout targets an 84% potential upside toward the $21+ zone.
As long as it holds above the breakout level, the trend remains bullish with further gains likely.
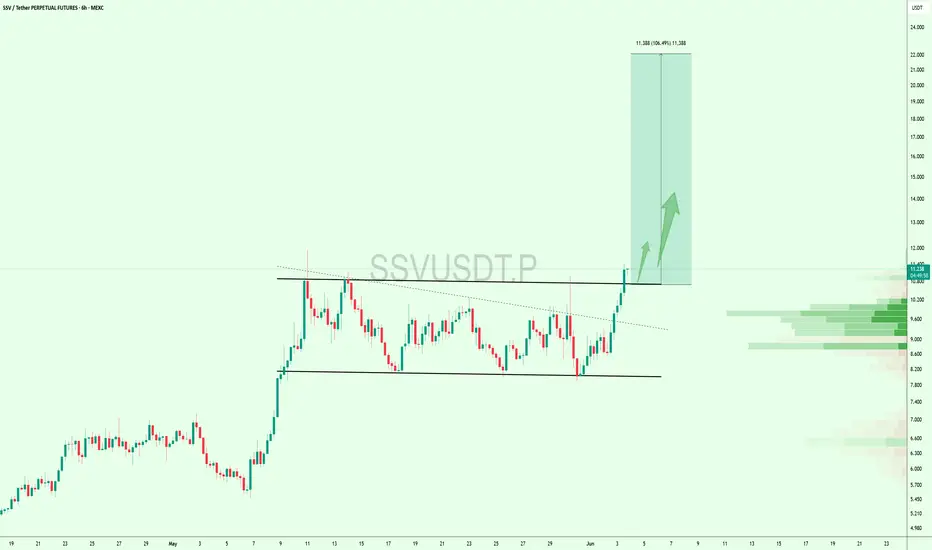
$SSV BREAKOUT CONFIRMED !!TSXV:SSV BREAKOUT CONFIRMED 🚀
Massive breakout from the long-term range on the 6H chart!
SSV smashed above resistance potential 100 %+ upside in play
Retweet if you are bullish!
DYOR, NFA
#SSV #ALTSEASON
Crypto Market Update for week 1 June 2025In this video I have given detailed market update analyzing BTC, ETH and other major coins with Buying and Sell levels that we may expect in the following 2 months.

Watch $SSV Closely – Big Move Ahead if Resistance Breaks#SSVUSDT Falling Wedge on 6H
The pattern is still holding strong! Price is coiling tighter inside the wedge.
A breakout above resistance could trigger a sharp 50%+ move to the upside. Eyes on $13+ 🚀
Setup looks promising — watch closely!

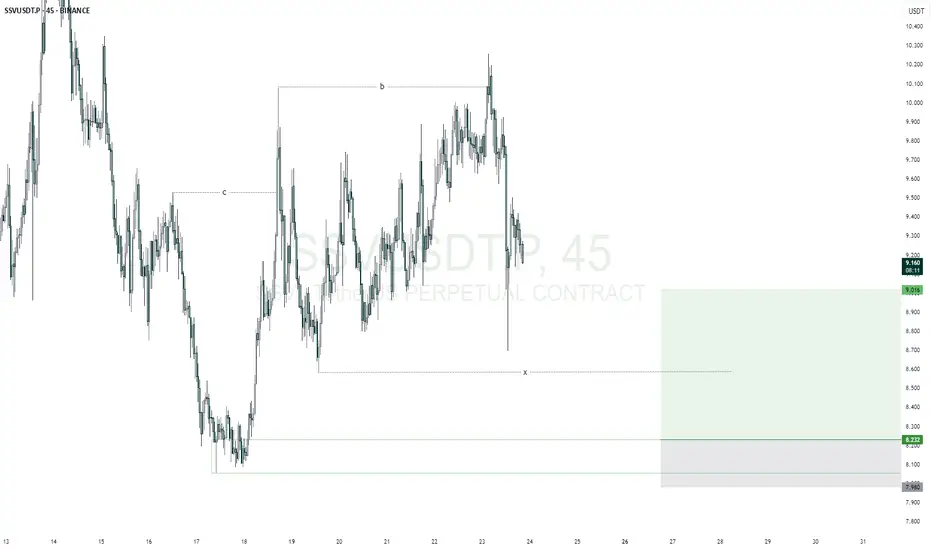
SSVUSDTmy entry on this trade idea is taken from a point of interest below an inducement (X).. I extended my stoploss area to cover for the whole swing as price can target the liquidity there before going as I anticipate.. just a trade idea, not financial advise
Entry; $8.232
Take Profit; $9.016
Stop Lo
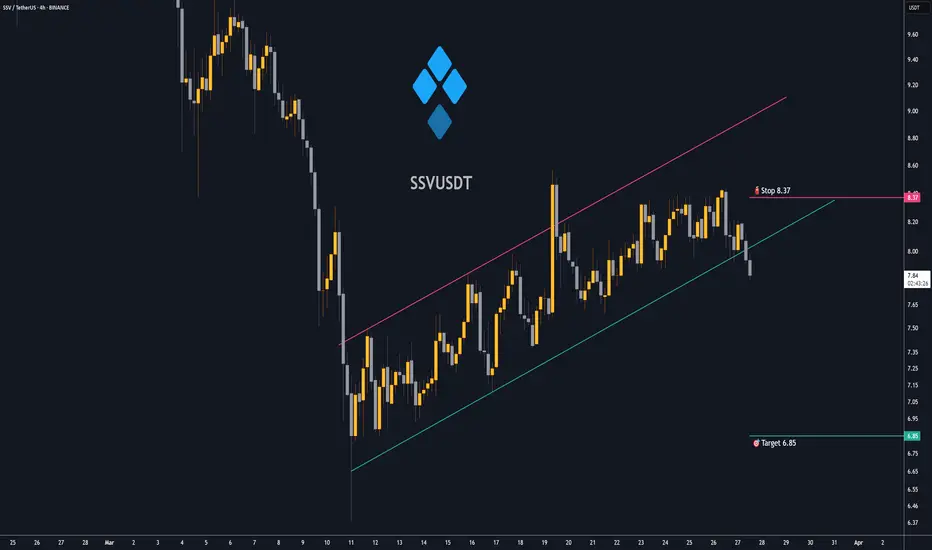
Trading opportunity for SSVUSDTBased on technical factors there is a Sell position in :
📊 SSVUSDT
🔴 Sell Now
🪫Stop loss 8.37
🔋Target 6.85
📏 R/R 2
💸RISK : 1%
We hope it is profitable for you ❤️
Please support our activity with your likes👍 and comments📝
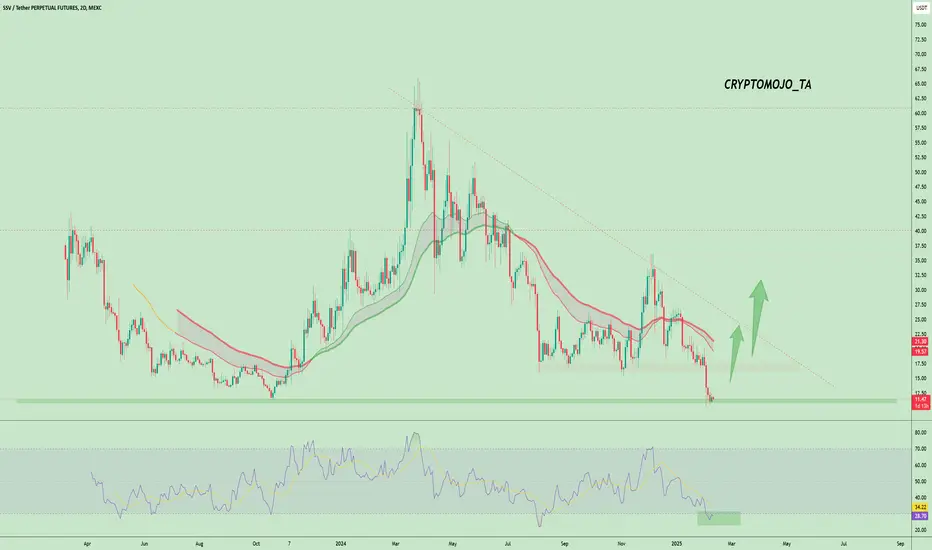
SSV Holds Key Support: Bullish Reversal on the Horizon?TSXV:SSV is holding above a key horizontal support zone, hinting at a potential bullish reversal if this level remains intact.
Support: Strong demand zone acting as a base, preventing further downside.
Breakout Watch: A bounce here could trigger a breakout above the descending trendline, targeting
See all ideas
Summarizing what the indicators are suggesting.
Oscillators
Neutral
SellBuy
Strong sellStrong buy
Strong sellSellNeutralBuyStrong buy
Oscillators
Neutral
SellBuy
Strong sellStrong buy
Strong sellSellNeutralBuyStrong buy
Summary
Neutral
SellBuy
Strong sellStrong buy
Strong sellSellNeutralBuyStrong buy
Summary
Neutral
SellBuy
Strong sellStrong buy
Strong sellSellNeutralBuyStrong buy
Summary
Neutral
SellBuy
Strong sellStrong buy
Strong sellSellNeutralBuyStrong buy
Moving Averages
Neutral
SellBuy
Strong sellStrong buy
Strong sellSellNeutralBuyStrong buy
Moving Averages
Neutral
SellBuy
Strong sellStrong buy
Strong sellSellNeutralBuyStrong buy
Displays a symbol's price movements over previous years to identify recurring trends.