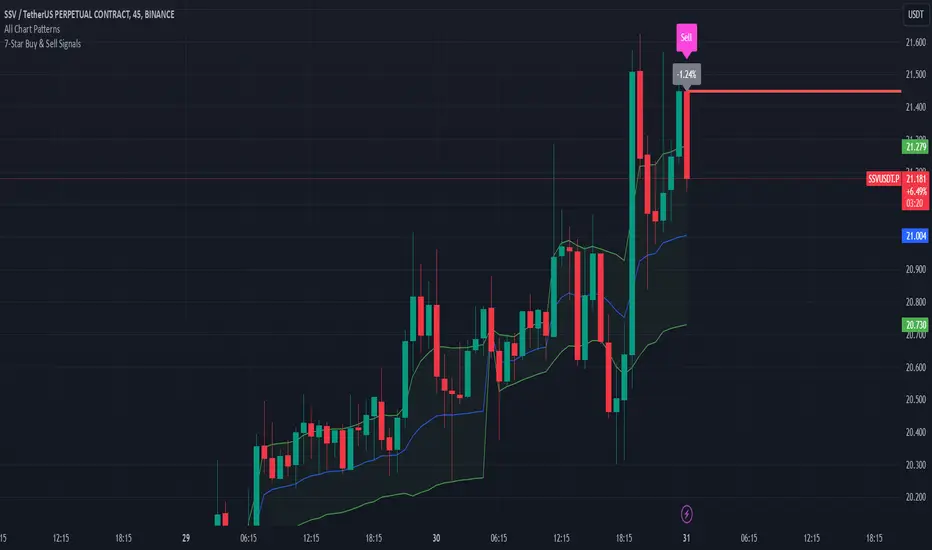
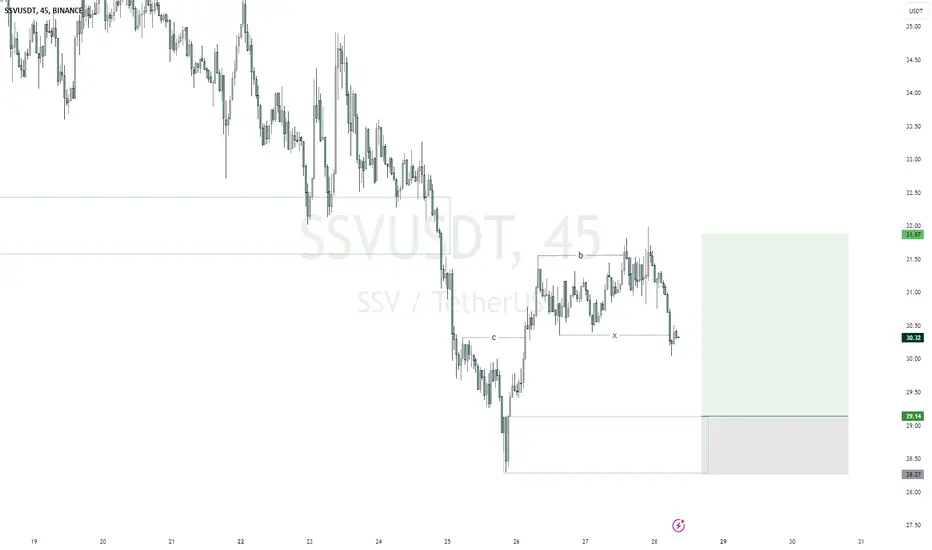
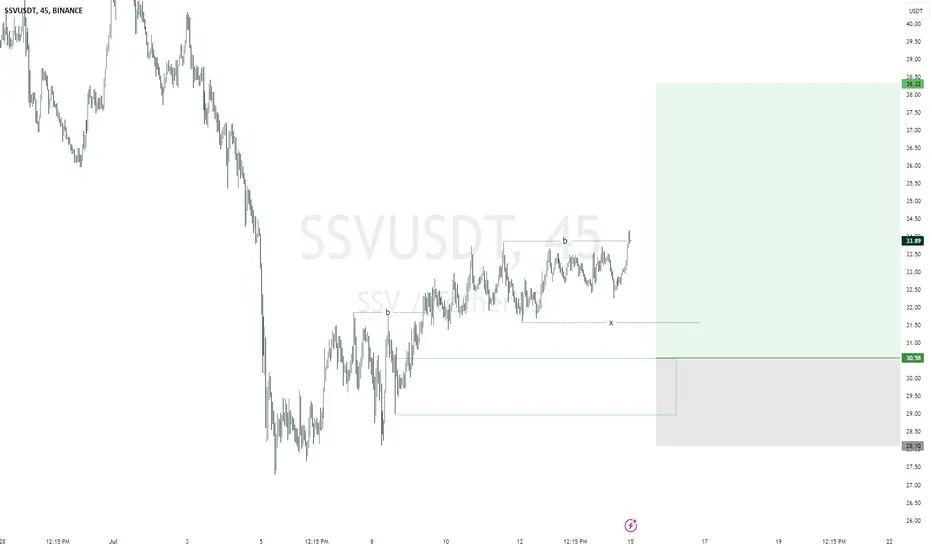
SSV shortTrying to short SSV with our new Sell print. A specialized tool to address volatile assets like alt coins in crypto. The price pullback is expected to the lower green line. Any upward movement crossing our sell point will be trend continuation.
DYOR
drop a message for indicator access.
SSVUSDT.P trade ideas
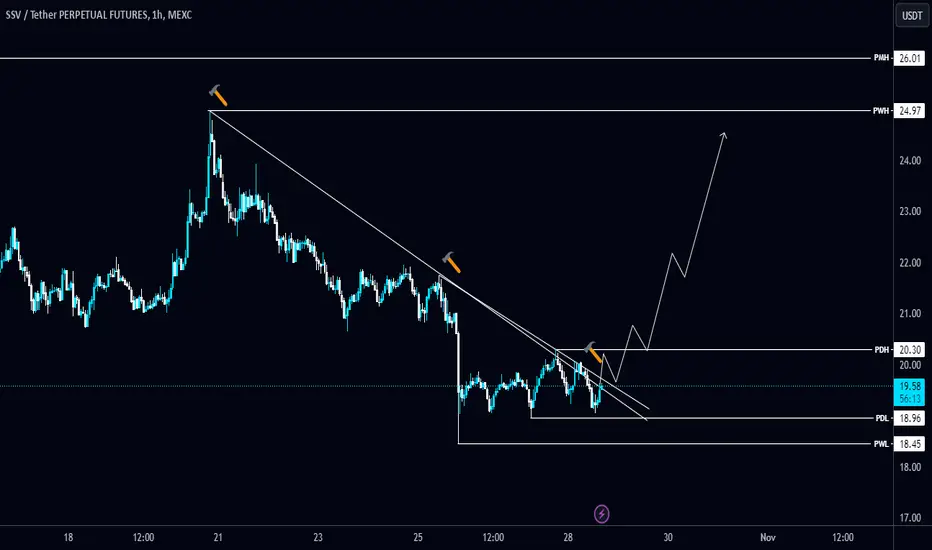
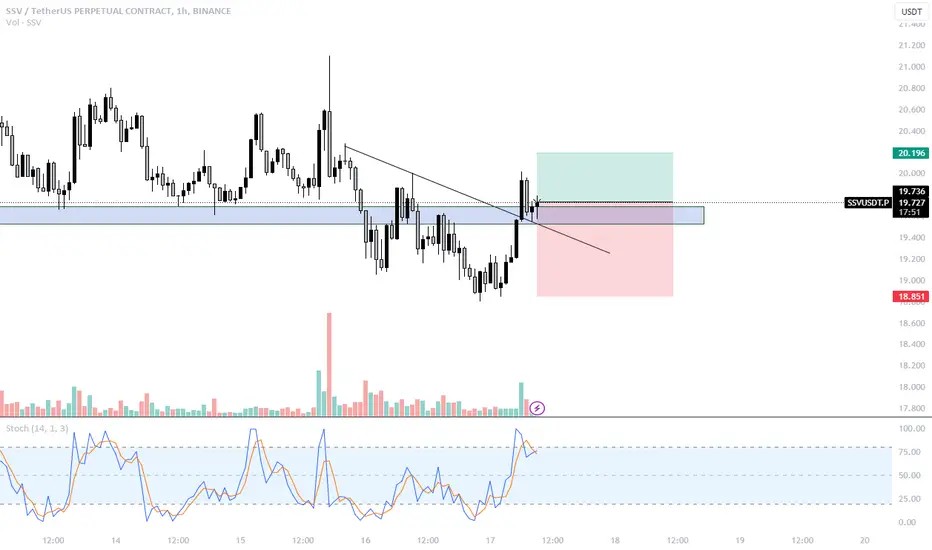
#SSV/USDT is trying to break the Diagonal Trendline in 1-Hour TF#SSV/USDT is trying to break the Diagonal Trendline in 1-Hour TF!
Wait for BO/retest to long $SSV. The local resistance level is PMH $26 and the local support level is PWL $18.45.
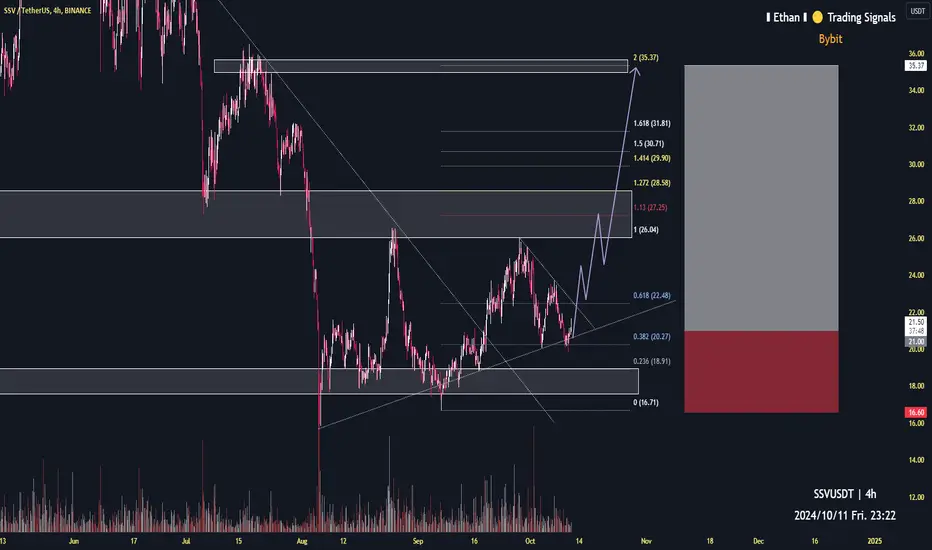
SSV target 354h time frame
-
Entry: $21
TP: $35.37
SL: $16.6
RR: 3.27
-
(1) Slowly climbing with the uptrend
(2) Got support twice at fib projection 0.382, also made a SL hunting ($19.82)
(3) Target for fib projection is $35.37, overlap with structural resistance
(4) Stop loss once going below $16.6
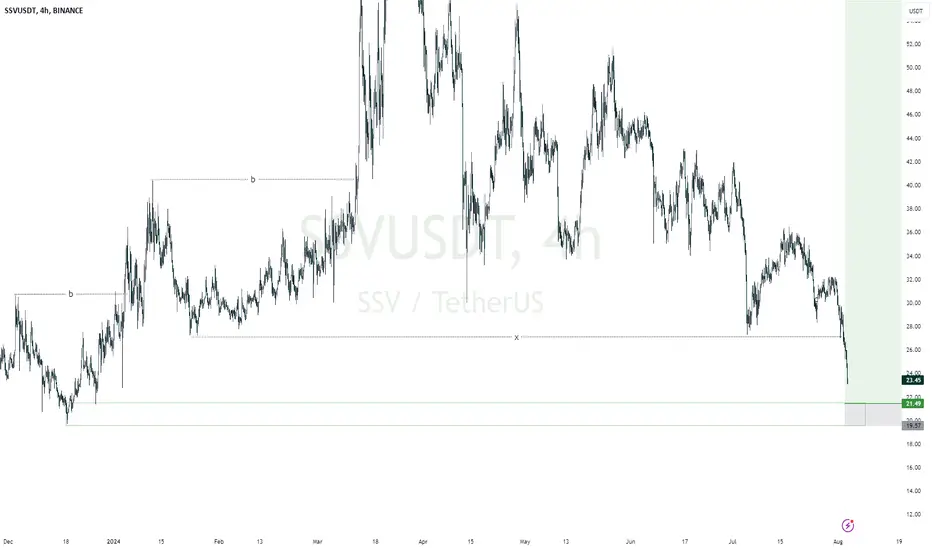
SSV looks bullish (4H)It looks like we had a big ABC (zigzag) now that wave C which had 5 waves is over.
SSV can move towards the specified targets on the chart while maintaining the green range.
Closing a daily candle below the invalidation level will violate the analysis.
For risk management, please don't forget stop loss and capital management
When we reach the first target, save some profit and then change the stop to entry
Comment if you have any questions
Thank You

SSV Level Flip + BreakoutThis looks really nice, and I think we will get BTC relief today running into FOMC meeting tomorow.
Longed.
SSV target 26.54h time frame
-
Entry: $19.05
TP: $26.5
SL: $16.6
RR: 3.04
-
(1) Potential double bottom, expected time to reach $19.05 is Sep/E
(2) Maintain uptrend since $16.71
(3) Supports are overlapped from uptrend line and Fib retracement 0.382
(4) Need to break out the long-term downtrend since $66
(5) Stop loss once going below $16.6


SSVUSDTmy entry on this trade idea is taken from a point of interest BELOW an inducement.. I extended my stoploss area to cover for the whole swing as price can target the liquidity there before going as i anticipate.. just a trade idea, not financial advise
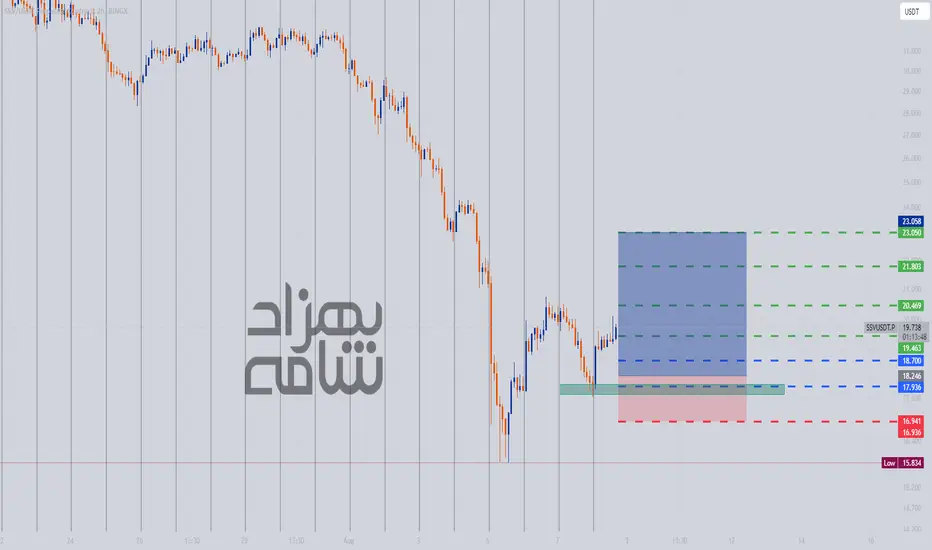
LONG POSITION SSV/USDTwe can enter the LONG position at the specified entry points.
It is clear that risk management is followed
SSVUSDTmy entry on this trade idea is taken from a point of interest BELOW an inducement.. I extended my stoploss area to cover for the whole swing as price can target the liquidity there before going as i anticipate.. just a trade idea, not financial advise
SSVUSDTmy entry on this trade idea is taken from a point of interest BELOW an inducement.. I extended my stoploss area to cover for the whole swing as price can target the liquidity there before going as i anticipate.. just a trade idea, not financial advise
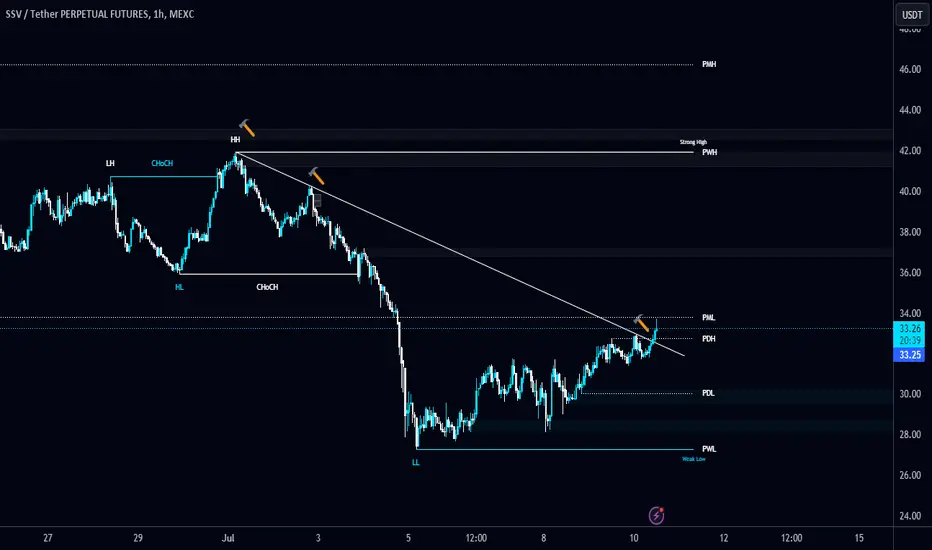
#SSV/USDT breaks the Diagonal Trendline and looks bullish in 1-H#SSV/USDT breaks the Diagonal Trendline and looks bullish in 1-Hour TF!
TSXV:SSV local resistance level is PML $33.8 and the local support level is PWL $27.5.
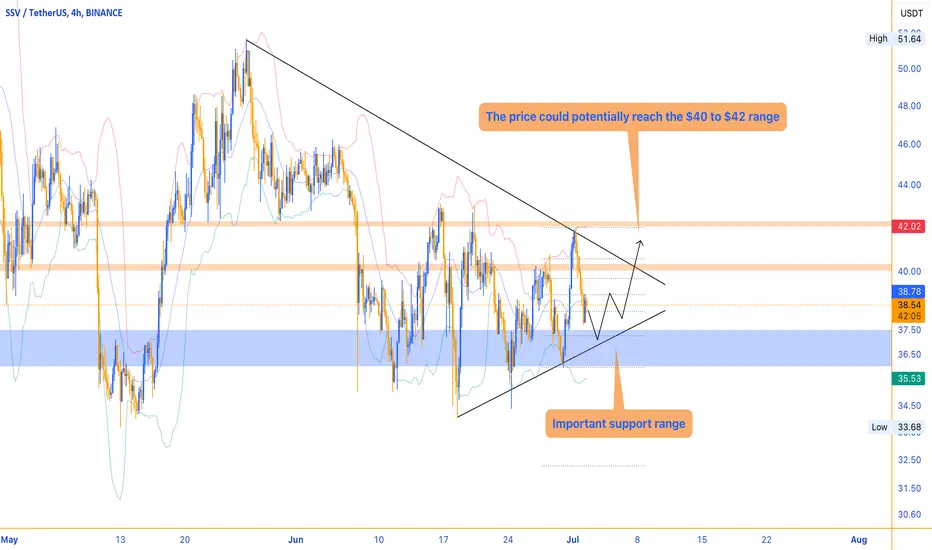
Potential for the price to riseThe $37.5 to $36 support range for SSV is noteworthy for monitoring as it may indicate significant market changes. If market conditions align, there is potential for the price to rise to the $40 and $42 resistance ranges.


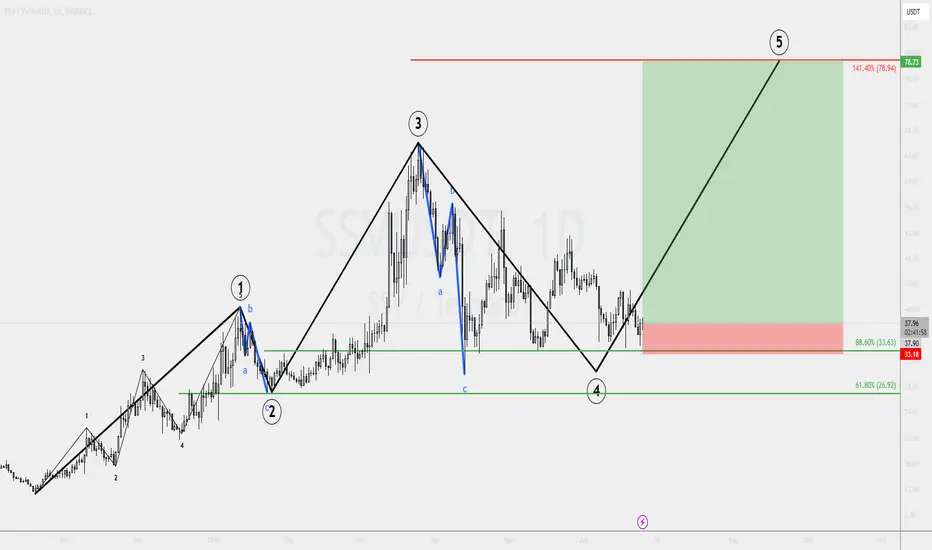
SSVUSDT Corrective Wave 4 CompletedOn the daily timeframe SSV is showing that the corrective wave 4 is likely to be completely. The price has found strong support at 88.6% Fibonacci level, which has been respected multiple times.
Overall, I'd expect at least 1 more wave to the upside, completing the 5-Wave upside move. If/when our upside target will be reached, a 107% profit will be fixed!
Not to mention a superb 1:12 risk/reward setup.
Hope you enjoy it!
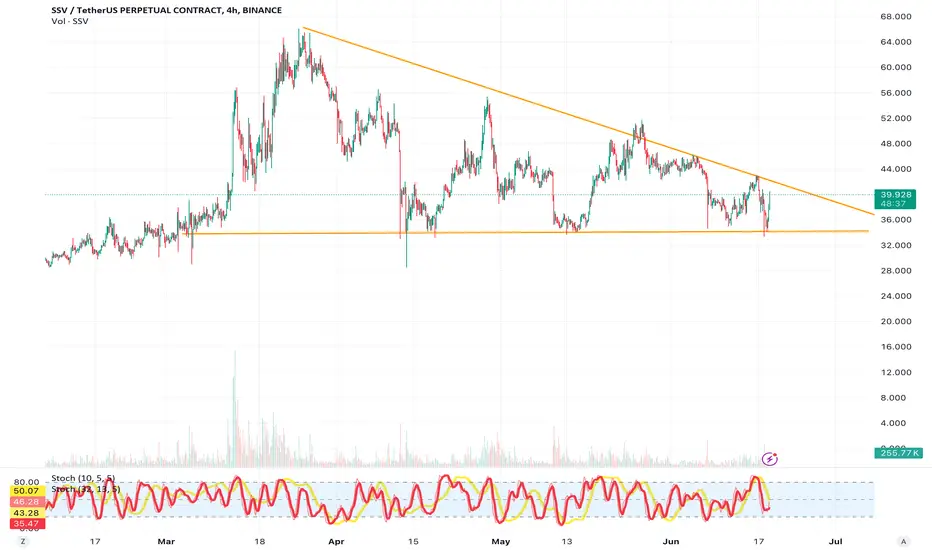
Drop and breakout scenarioThe overall trend is ranging with significant fluctuations. There is a descending trendline that buyers are trying hard to break out of.
The scenario involves a potential drop to gain more strength and then move towards breaking the trendline. If it breaks and completes a pullback, it could see significant upward movement. Keep an eye on it.

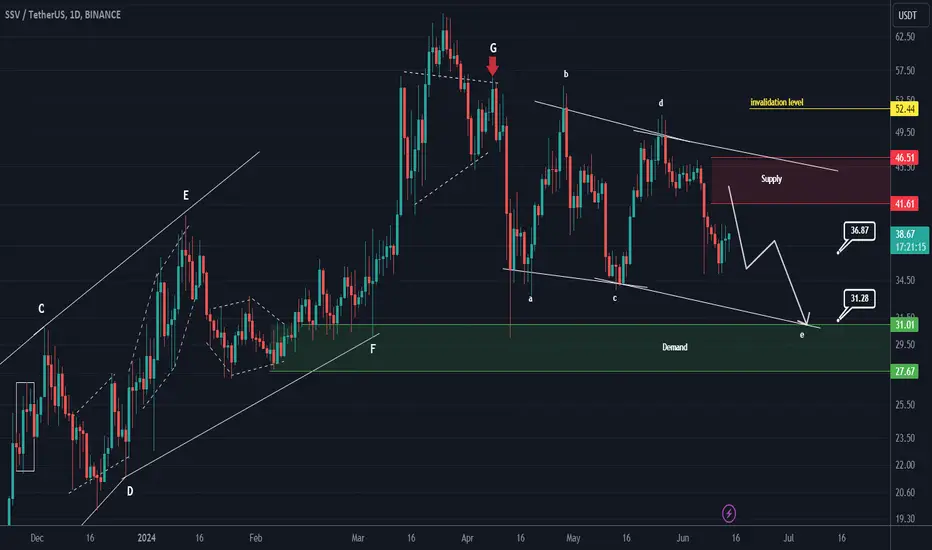
SSV looks bearishFrom where we placed the red arrow on the chart, it looks like the bullish SSV wave has ended and is now entering a correction phase.
The correction pattern looks like a diametric as we are now in the middle of wave E.
We will look for sell/short positions in the red box.
The targets are marked on the chart.
Closing a daily candle above the invalidation level will violate the analysis.
For risk management, please don't forget stop loss and capital management
When we reach the first target, save some profit and then change the stop to entry
Comment if you have any questions
Thank You
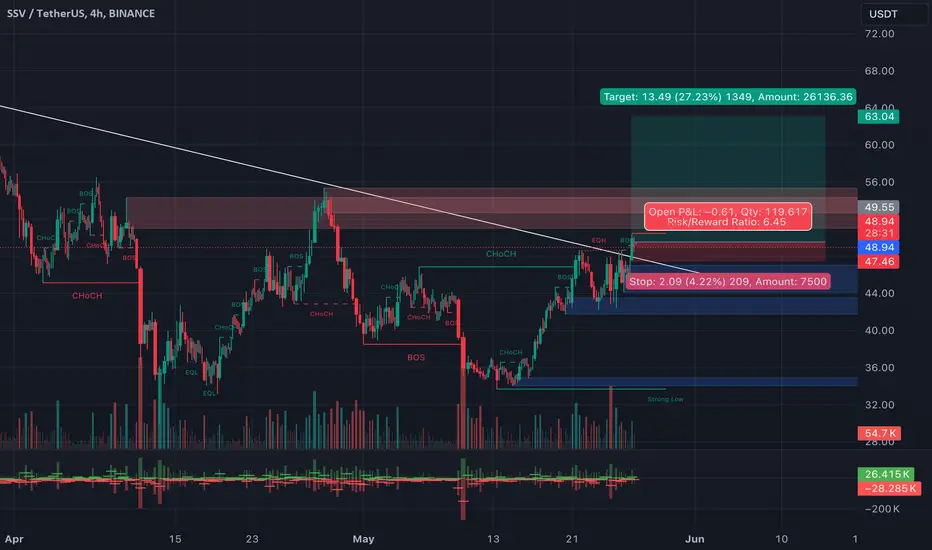
SSV/TetherUS has been in a bullish trendThe recent breakout above the $49.17 resistance level is a bullish signal that suggests that the price could continue to rise, the target on around 63.
SSV MARKET ANALYSISSSV has broken long term descending triangle with good volume and is expected to move up from current price. If price slightly plummets then it will be good buying opportunity.
Buy Range 44-48
Stop 42
target 52, 56, 60, 64
SSV target 69 in perp4h time frame
-
SSV is retesting the robust uptrend line with a precipitous drop from $55. Usually need more consolidation or accumulation to reverse after a quick dip like this. However, SSV has been increasing on this upward slope since $11, that makes this uptrend pivotal, so the timing is an entry for left-hand side traders to gain perfect risk to reward ratio. Moreover, next entry will be around $25~$28 once current plan got liquidated, and you can have more detail about 1st amd 2nd entry on chart from my previous analysis of SSV spot.
-
TP: $69
SL: $32

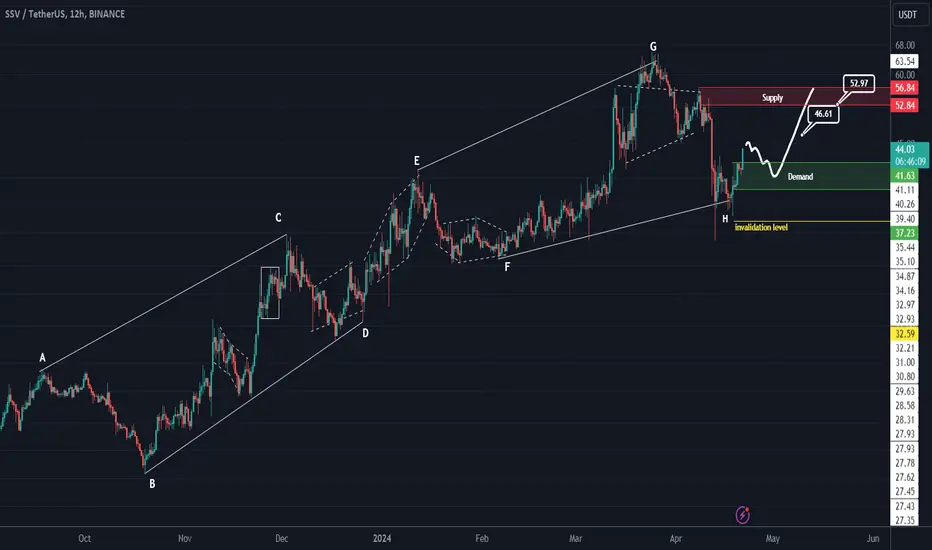
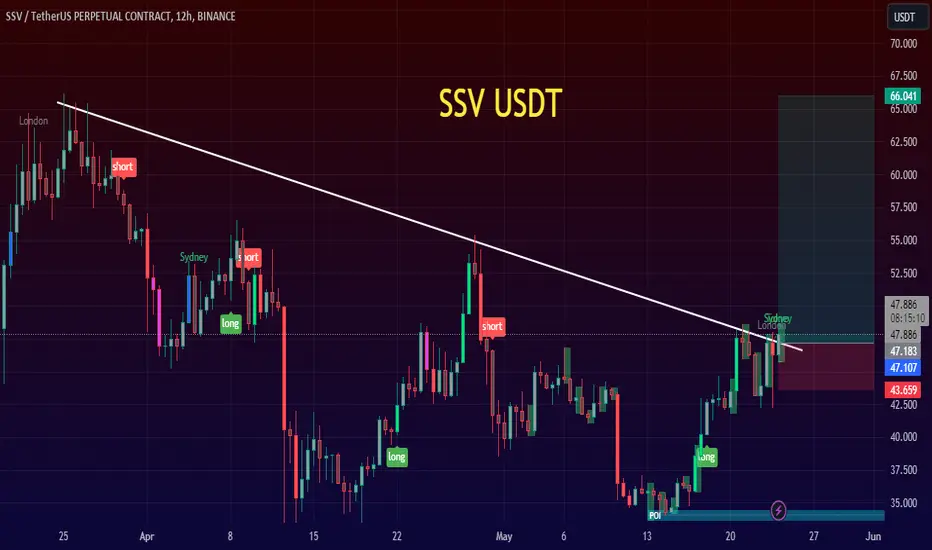
SSV ANALYSIS (12H)SSV seems to have formed a large and bullish symmetrical which is now in wave i of this symmetrical.
By maintaining the green range, it can move towards the two specified targets.
The targets are clear on the chart.
Closing a daily candle below the invalidation level will violate the analysis
For risk management, please don't forget stop loss and capital management
When we reach the first target, save some profit and then change the stop to entry
Comment if you have any questions
Thank You