STEEMBTC trade ideas
Potential STEEM/BTC TradeLooking like a great long trade here for STEEM/BTC. Coming into a corrective elliot wave phase. This is supported by a potential Bollinger bounce. We can also see it's just hit that trend line nicely and RSI shows it could be slightly oversold. I've placed a sell order at .0007 and a stop loss at .000565
Just started out with TA so any feedback or advice you could give would be great :)
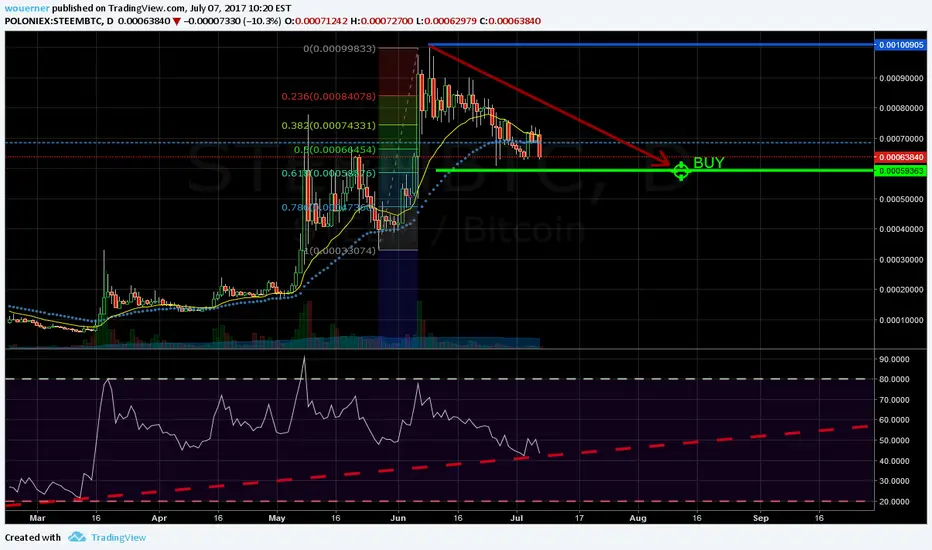
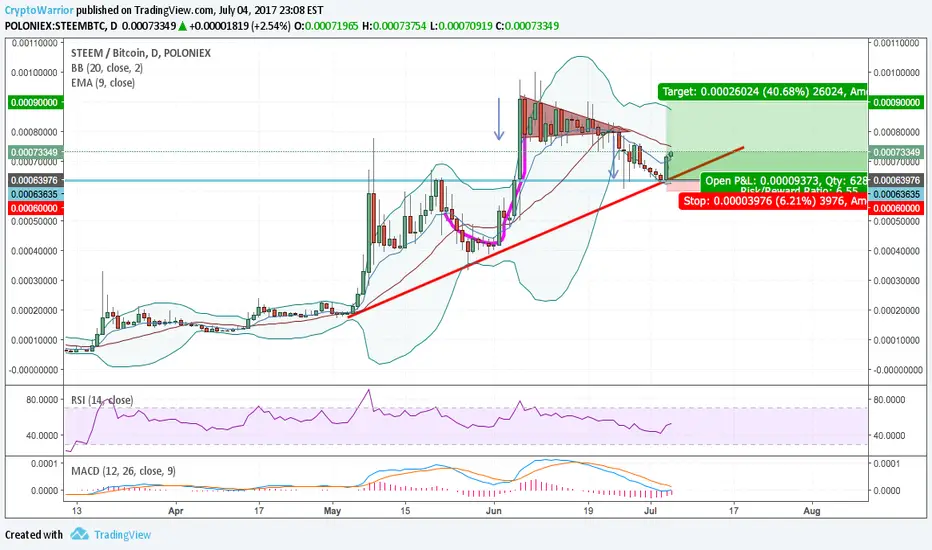
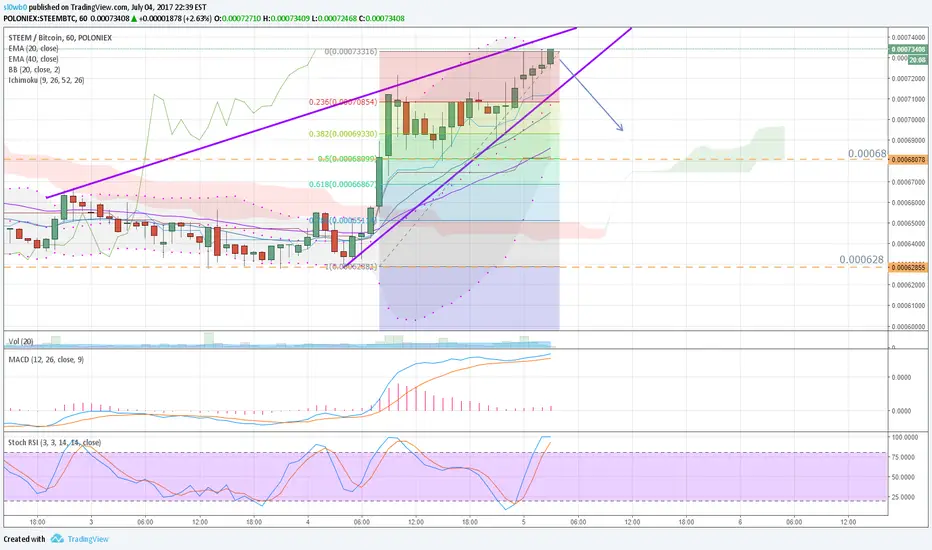
LONG on STEEM/BTC, SOLID 8:1 risk reward ratioThis chart looks really good to me, hopefully we can catch an entry at 0.00064125, if we do, we could see potential jump and solid exit points. Ichimoku cloud acts as a strong support, and also this line was tested previously and had a strong buy support and a quick rejection whenever it was passed. Stop loss has been set just in case, because I think trend wont recover if it goes 10% below the support line.
The way we exit according to the chart is to see if we pass Exit1 and based on RSI and MACD we make conclusion that momentum is still moving us up, if we for instance hit Exit2, and have a strong pullback towards Exit1, we should get out of our position. Ideally, we will reach Exit3.

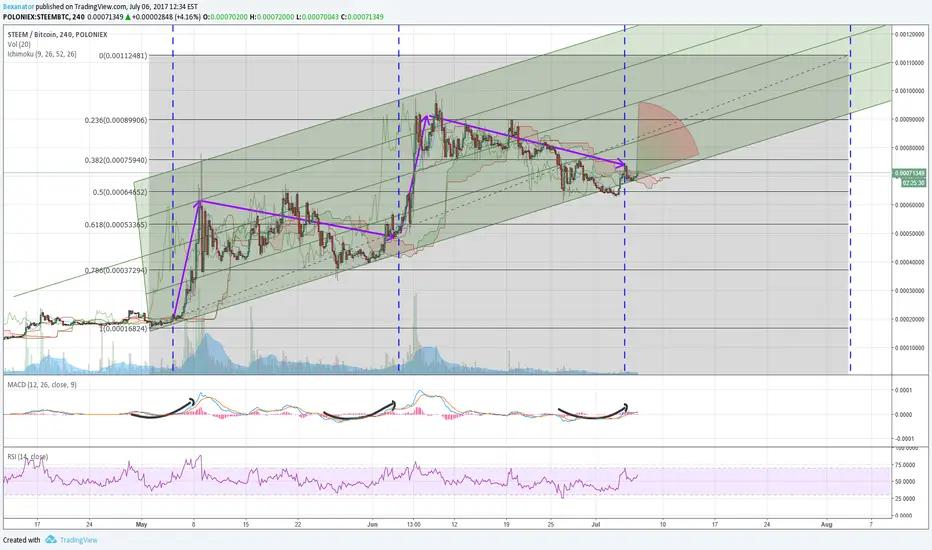
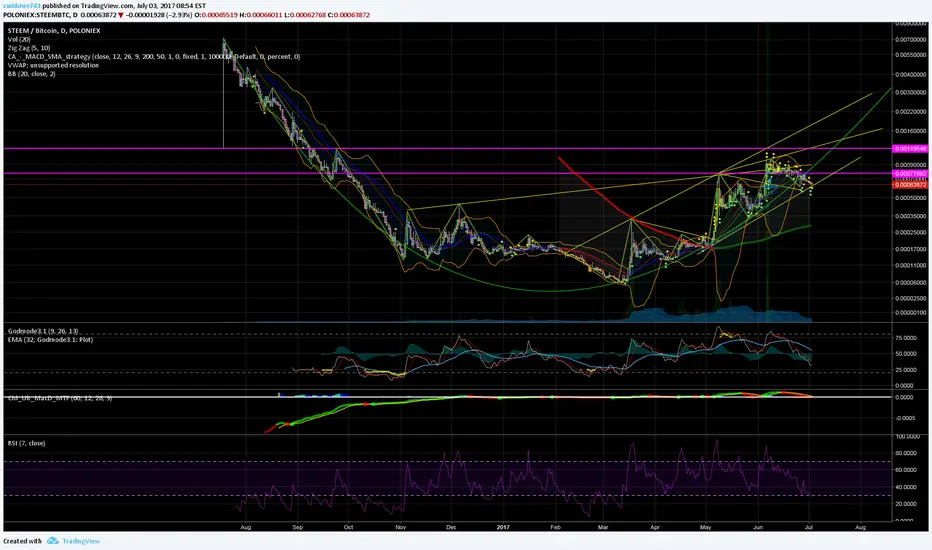
STEEM/BTC - Potential repeating patternTo establish a pattern you require a minimum of 3 data points. Unfortunately, this TA does not meet that criteria so is nothing more than optimistic speculation.
However, having a look at the graph I will let you make up your own mind. A similar pattern has occurred as the price has met the overall resistance (bottom of pitchfork) at which point there is a slight drop in the MACD and a rather high RSI. As the price breaks above the ichimoku cloud it begins to rocket, that it has the potential of doing very soon.
As always, any questions or recommendations please post in the comments, and if you like what you see throw over a thumbs up!
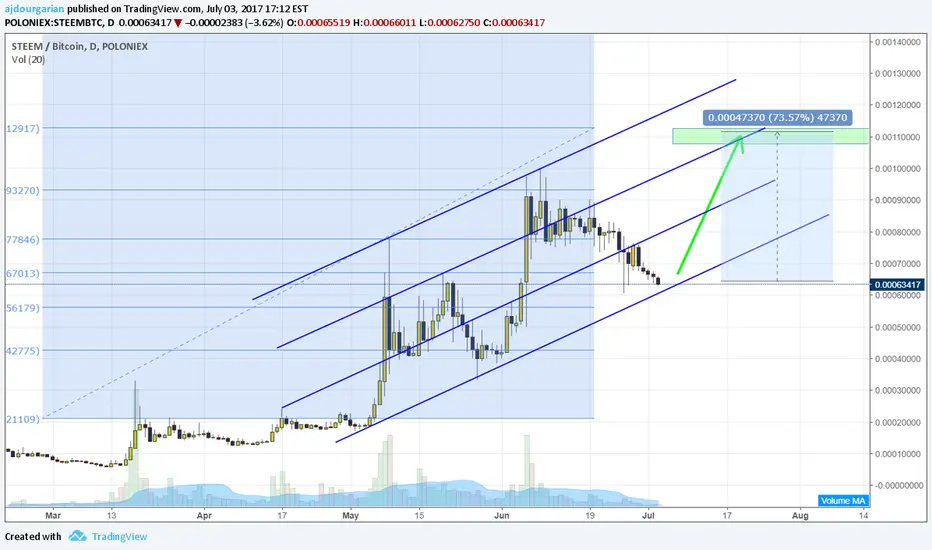
Take another 10% - Steem up Technical analysis tools suggesting UP
RSI directed up
recent strong green bar
MACD turning
Best of luck everyone
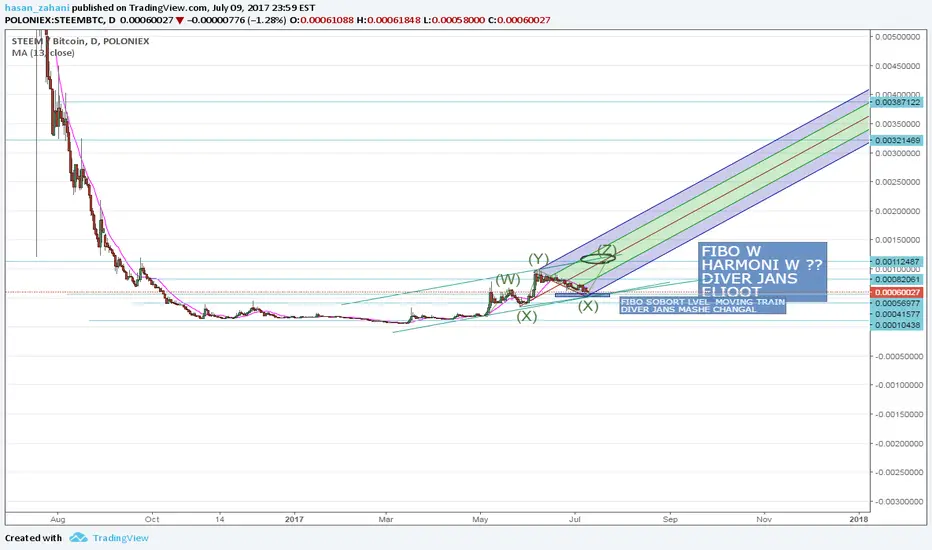
Steem it's look like a grapes.Steem has high potential for grow up. It is look like grapes. You buy it, wait for long time and your wine is ready.
working with fibo lines shows these TPs
Tp1=0.00075
Tp2=0.00082
Tp3=0.00089
Tp4=0.00130
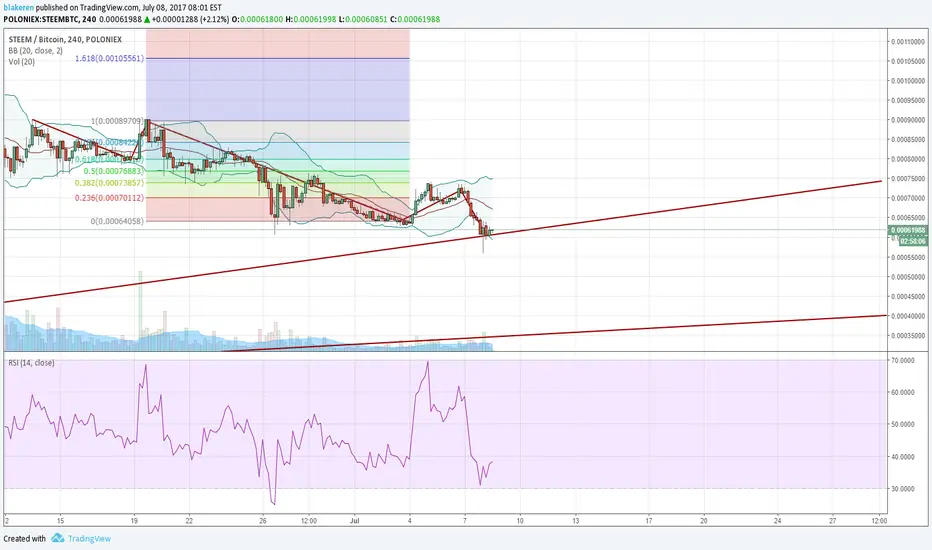
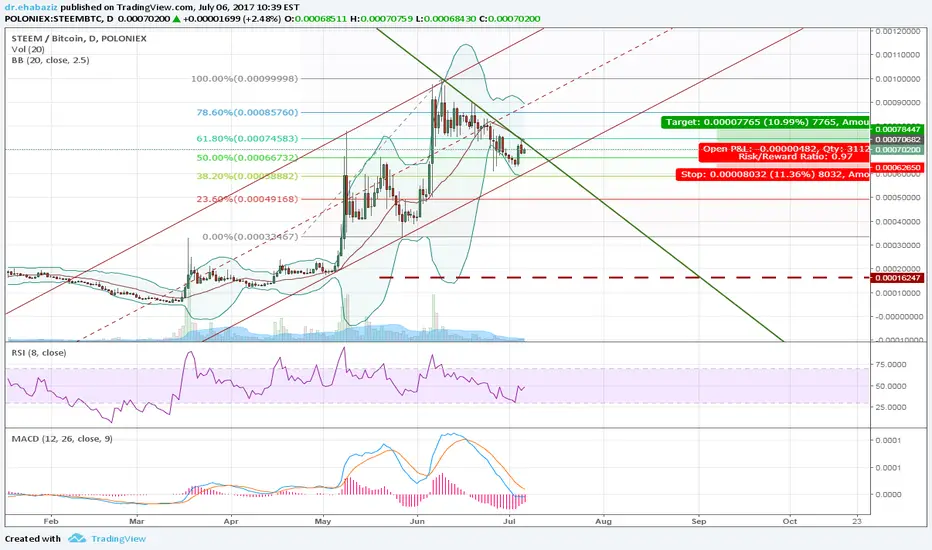
STEEM oversold and ready to reverse at top of bearish pennantSTEEM's steam is running out, it seems... sell soon and look to buy back at marked fib levels
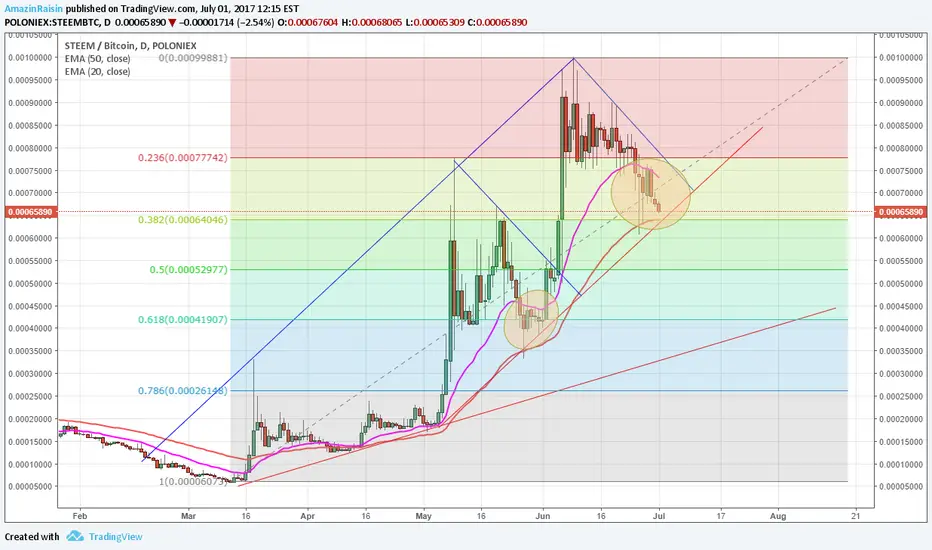
Steem SupportSo many support lines are going to be hit soon. The .382 FIB, 50 EMA, and the uptrend line. On top of this Poloniex is soon to allow steem deposits and withdrawals today. Also, last time it was in between the 20 and 50 ema steem shot up.
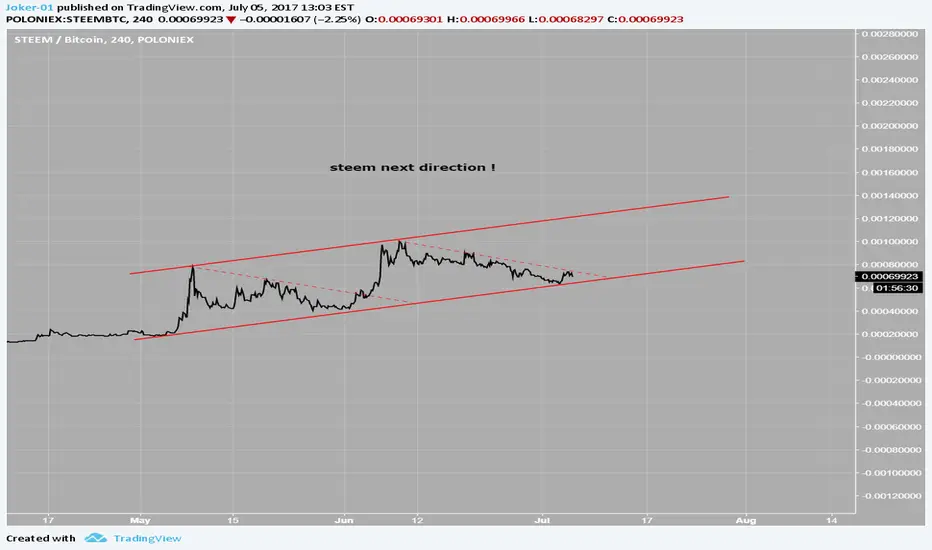
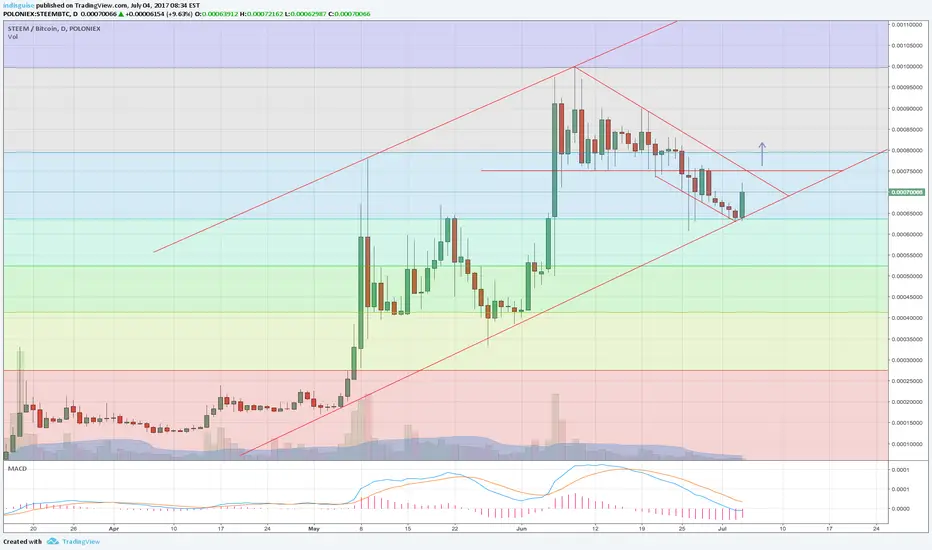
STEEM repeating same breakout cycle for third time?(Looks like the bottom line shifted before I publish couple seconds ago, dark green line goes under today's 7/4 daily candle. Rest is the same.)
Haven't followed $STEEM much, but these fractals are quite telling..
Pullback to line before next candle up?
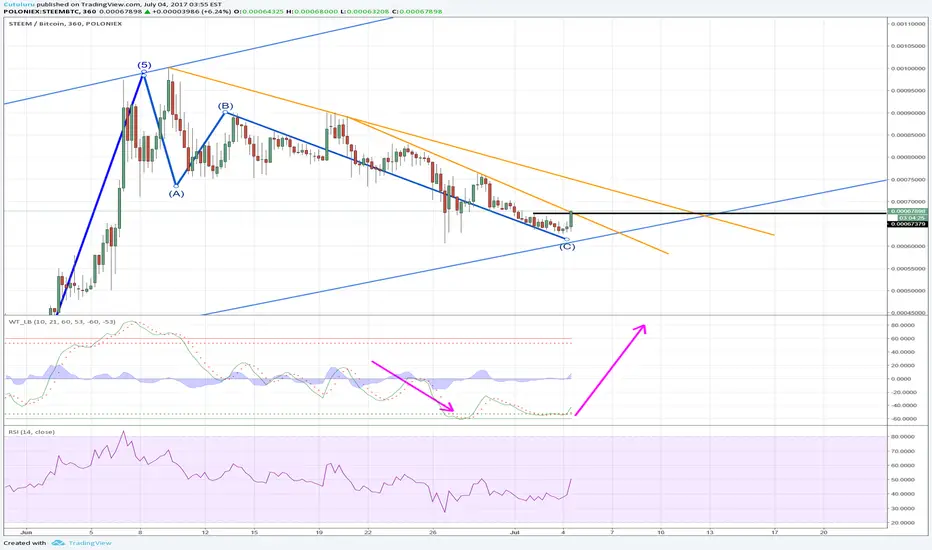
STEEM - BACK ON TRACKmy simple point of view:
back on track, with a perfect bounce from the 0.61er fiblevel.
but i would wait 2-3 days for confirmation (macd + >0.00075).
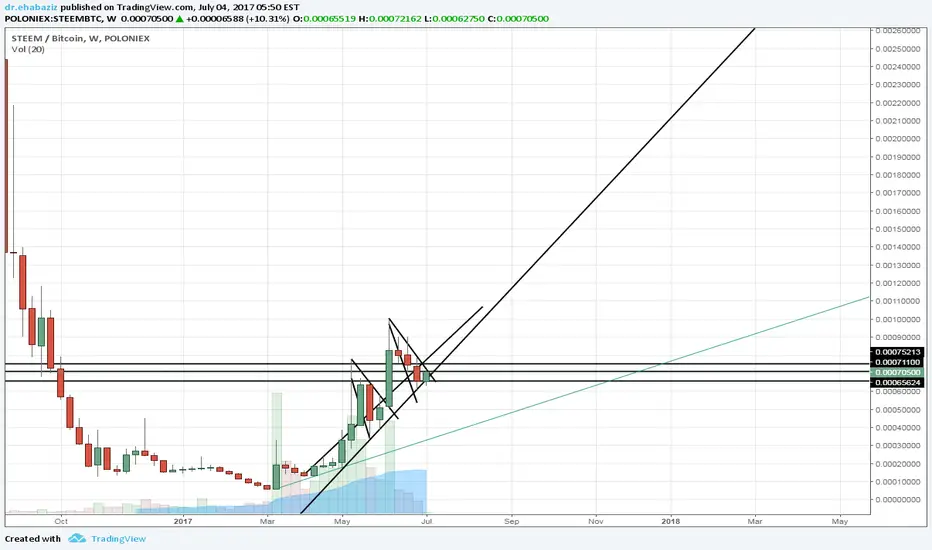
Steem Weekly chart
Price action bullish
price correction
Brakes applied on the fall and now accelerating again
finding lower line and moving on
volumes are picking up on the daily chart if that continues next leg up is not here yet
Lots of attention as evident by the number of posts about it on trading view
on the other side, we might want to test the 65 mark one more time
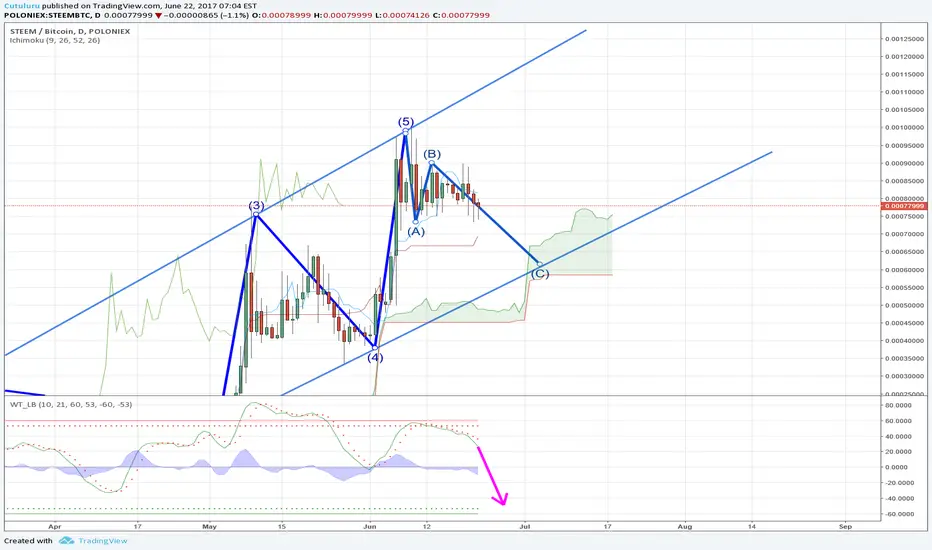
STEEM must Wait for Next EntrySteam seems to move by the Elliot wave.
Now it will go down to the bottom by ABC.
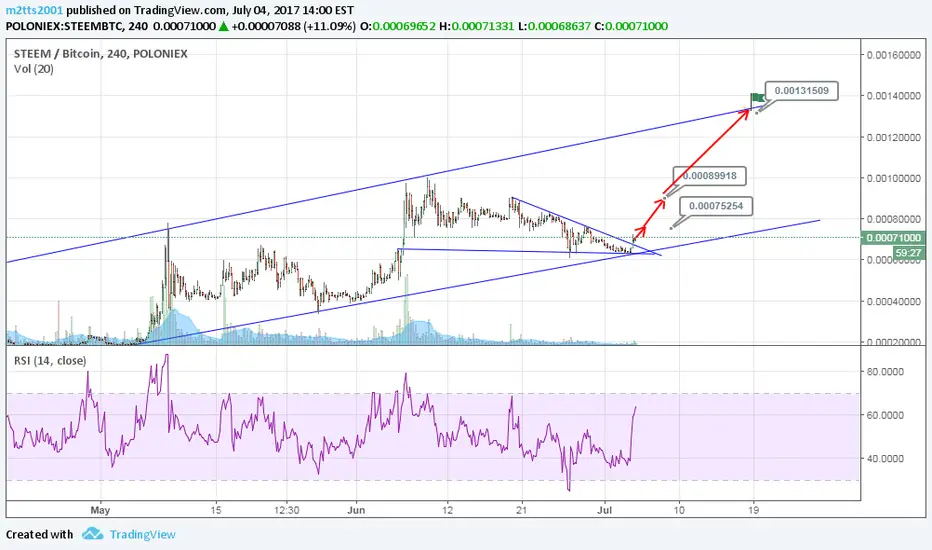
STEEM up up and away!We are looking at this lazy lady again, this time STEEM is forming a beautiful bullish wedge and has a lot of potential upside! i will definitely be keeping a very close eye on this one.

STEEM to to break .001 BTCI like this pattern. I like money too. I think I will buy some steem. For reference, compare with the Siacoin chart.
STEEM EngineLong. Fundamentals are good, and chart implied heavy upside. Approaching log channel support, and Bitcoin has broken upward from pennant, implying market will lift all boats here and facilitate upward action. TP of .0012 in the near term. Could run to a 10-bagger over next few years


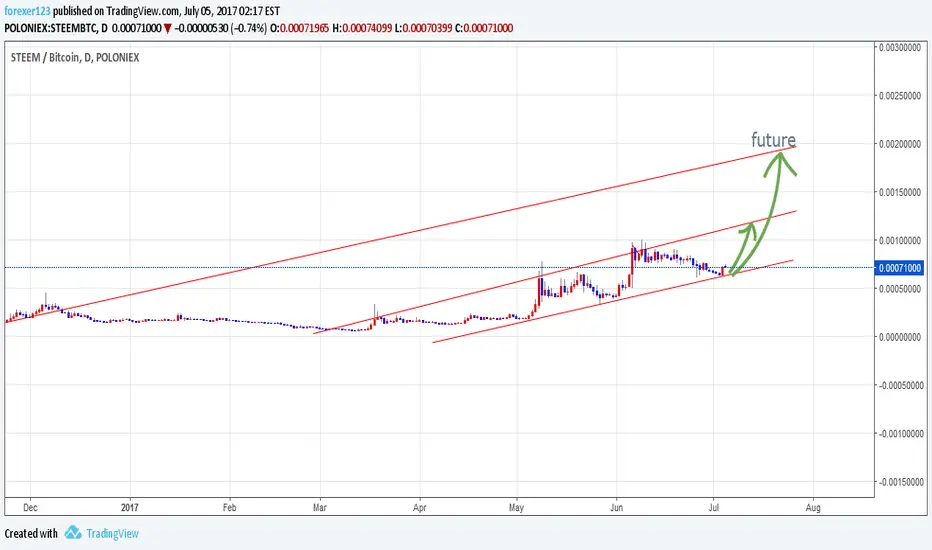
Steem - The CurveI'm back with another market insight on cryptocurrencies, today I'm on the daily chart with STEEM/BTC.
As many of you already know I recently started contributing on Steemit throughout June, you can follow me @lewisglasgow.
I see a lot of potential in their platform and cryptocurrency, although it is not ready for mass adoption it certainly has many positives in the eyes of investors/traders.
What is Steemit?
Steemit is a social network that looks and functions a lot like Reddit, but with one HUGE difference... Steemit pays both the content creators when their work gets upvoted, as well as the people who curate the best content on the site by upvoting others work.
Now that I've got that out of the way, here is my view from a technical standpoint
The curve presented on the chart can be seen across various financial markets and is simply a representation of an asset becoming less valuable over a long period of time.
As price is pushed towards the lowest possible value there are three potential outcomes:
1. STEEM will crash (highly unlikely).
2. It will continue to trade below the curve.
3. Experience a huge breakout to the upside.
Of course, we experinced a brekout of the curve moving from around $0.60 to $2.40.
Earlier this year I came across a similar situation with BTS and XRP, in which both of those assets experienced a tremendous amount of growth.
BitShares.
Ripple.
Just to clear this up, I do not expect a surge in price like we seen with BTS and XRP.
I'm expecting a steady move up between the key zones highlighted in grey, use these levels as an indication to where price will stall.
Right now the market is now correcting itself and preparing for the next move up.
Updates to follow! Don't forget to add me on social media :)
