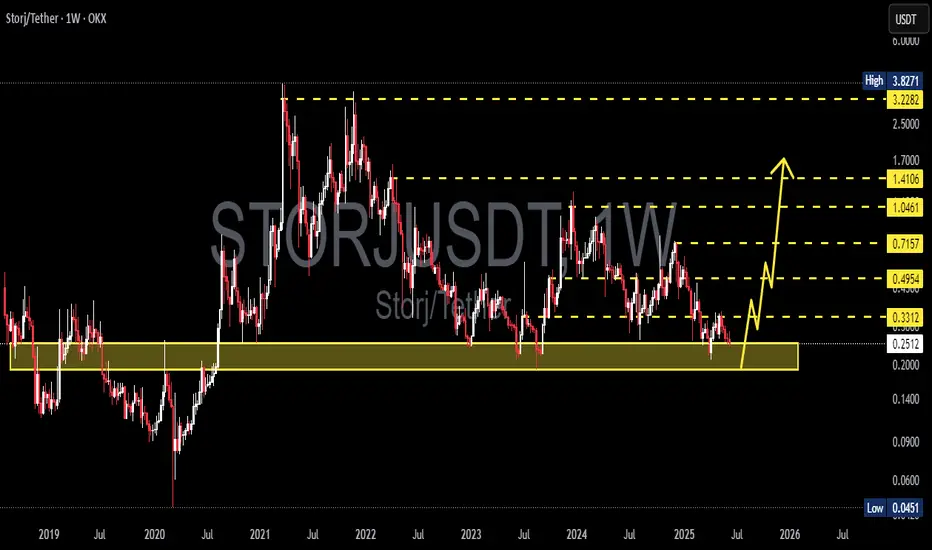
STORJUSDT 1W Analysis STORJ ~ 1W Analysis
#STORJ This is the closest support for now. Buy if you still have confidence in this coin with a short term target of at least 20%+ from this support.
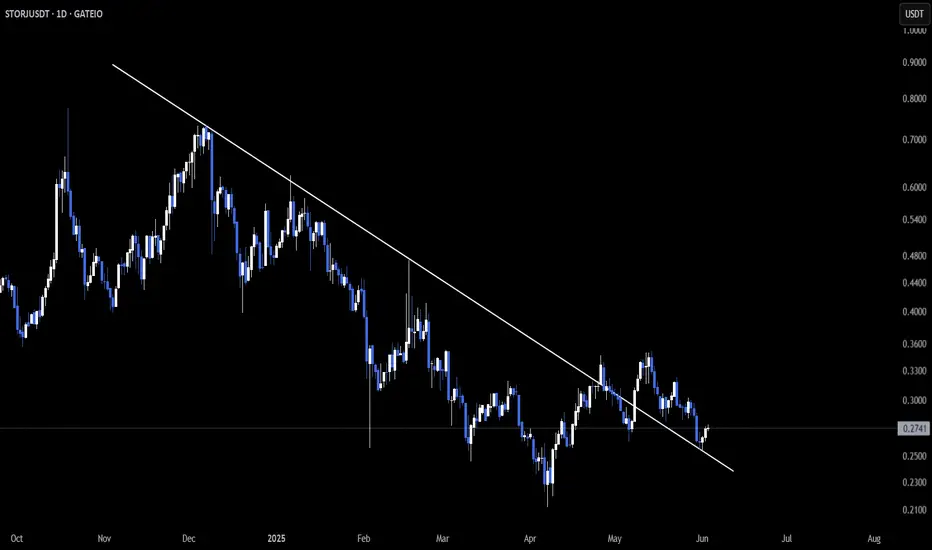
$STORJ – Testing Descending Trendline Support📊 GATEIO:STORJUSDT.P STORJ is testing the descending trendline support on the daily timeframe, and it’s holding firm for now.
⚠️ This level is crucial — will it act as a springboard for a bullish reversal or let the bears take over?
👀 Watch price action closely for clues!
STORJUSDT 1D AnalysisSTORJ ~ 1D Analysis
#STORJ Buy gradually from here if you still have confidence in this coin with a short term target of at least 10%++

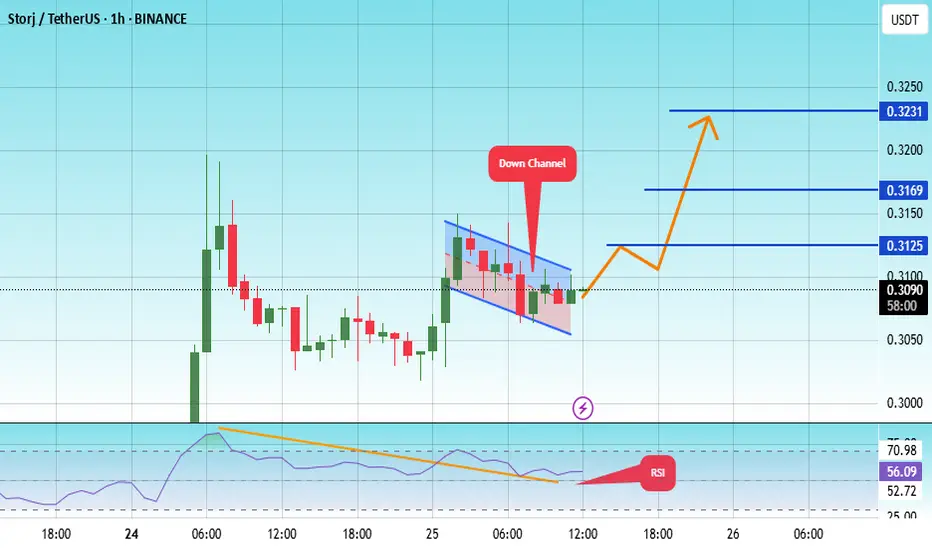
#STORJ/USDT#STORJ
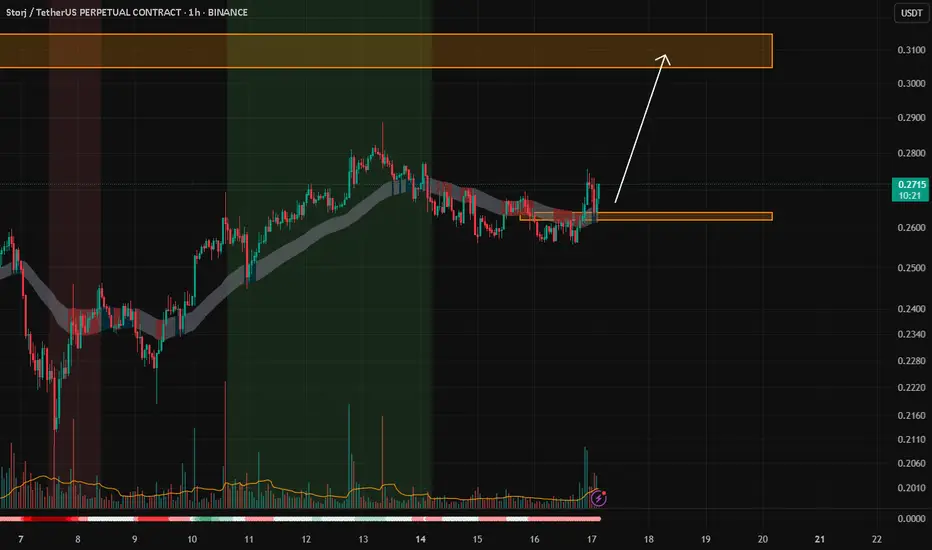
The price is moving within a descending channel on the 1-hour frame, adhering well to it, and is on its way to breaking it strongly upwards and retesting it.
We are seeing a bounce from the lower boundary of the descending channel, which is support at 0.3060.
We have a downtrend on the RSI
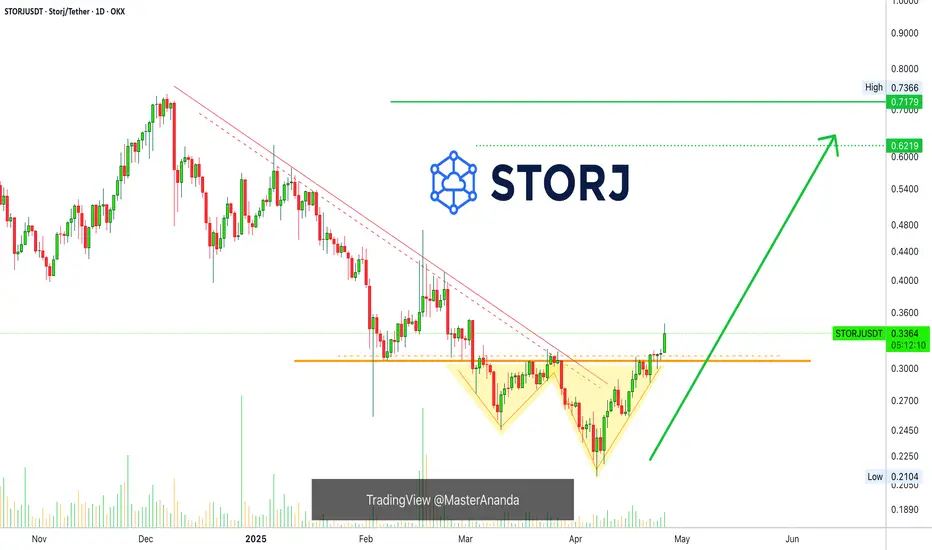
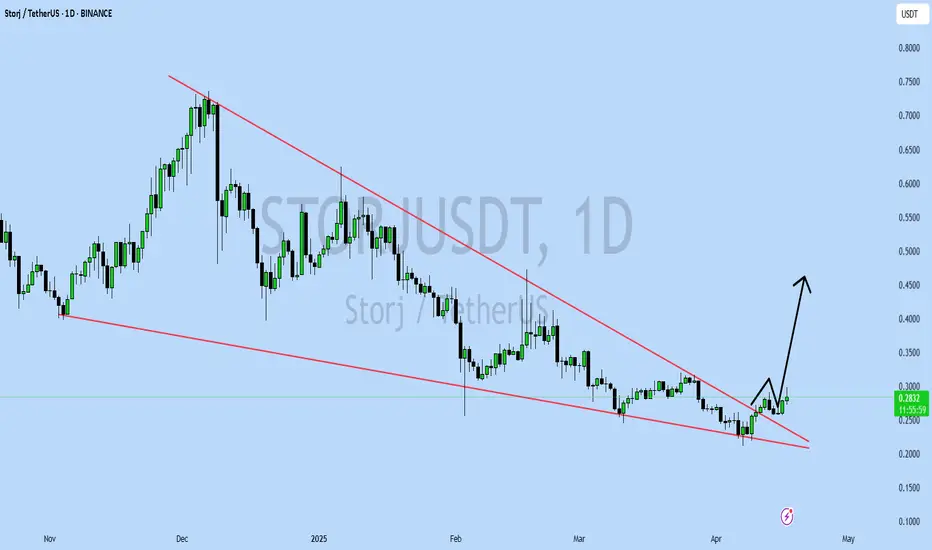
Storj —Strong Move Ahead (Easy 100-200% Profits Potential)The inverted triangles depict the bottom. After Storj moved above the 3-Feb low and broke the downtrend we entered bullish territory.
The chart was bullish when the bottom hit 7-April and we can predict a recovery, but this is only a prediction. When the action moves decisively above support, and g
STORJUSDT UPDATESTORJ/USDT Technical Setup
Pattern: Falling Wedge Breakout
Current Price: $0.2831
Target Price: $0.35, $0.45
Target % Gain: ~24% to ~59%
Technical Analysis: STORJ has broken out of a falling wedge on the daily chart, signaling a potential trend reversal. Price is retesting the breakout with bullis
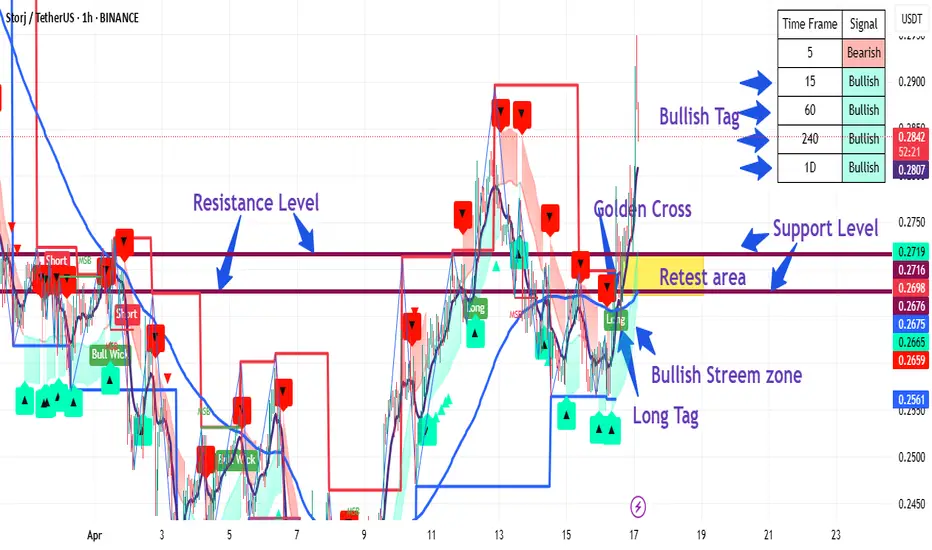
STORJUSDT.P Ready To Long Position with Our CGI IndicatorSTORJUSDT.P Ready To Long Position with Our CGI Indicator
STORJUSDT 1D AnalysisSTORJ ~ 1D Analysis
#STORJ Looks very bullish after successfully penetrating this resistant line.

Storj Breaking out Expecting Solid Bullish Rally Storj Chart Looking Very Good For Midterm, Testing Falling Wedge (Trendline Resistance) Successful Breakout Can Lead Solid Bullish Rally Towards 0.50$ In Coming Days.

STORJ/USDTKey Level Zone: 0.2720 - 0.2740
HMT v8 detected. The setup looks promising, supported by a previous upward/downward trend with increasing volume and momentum, presenting an excellent reward-to-risk opportunity.
HMT (High Momentum Trending):
HMT is based on trend, momentum, volume, and market struc
See all ideas
Summarizing what the indicators are suggesting.
Oscillators
Neutral
SellBuy
Strong sellStrong buy
Strong sellSellNeutralBuyStrong buy
Oscillators
Neutral
SellBuy
Strong sellStrong buy
Strong sellSellNeutralBuyStrong buy
Summary
Neutral
SellBuy
Strong sellStrong buy
Strong sellSellNeutralBuyStrong buy
Summary
Neutral
SellBuy
Strong sellStrong buy
Strong sellSellNeutralBuyStrong buy
Summary
Neutral
SellBuy
Strong sellStrong buy
Strong sellSellNeutralBuyStrong buy
Moving Averages
Neutral
SellBuy
Strong sellStrong buy
Strong sellSellNeutralBuyStrong buy
Moving Averages
Neutral
SellBuy
Strong sellStrong buy
Strong sellSellNeutralBuyStrong buy
Displays a symbol's price movements over previous years to identify recurring trends.