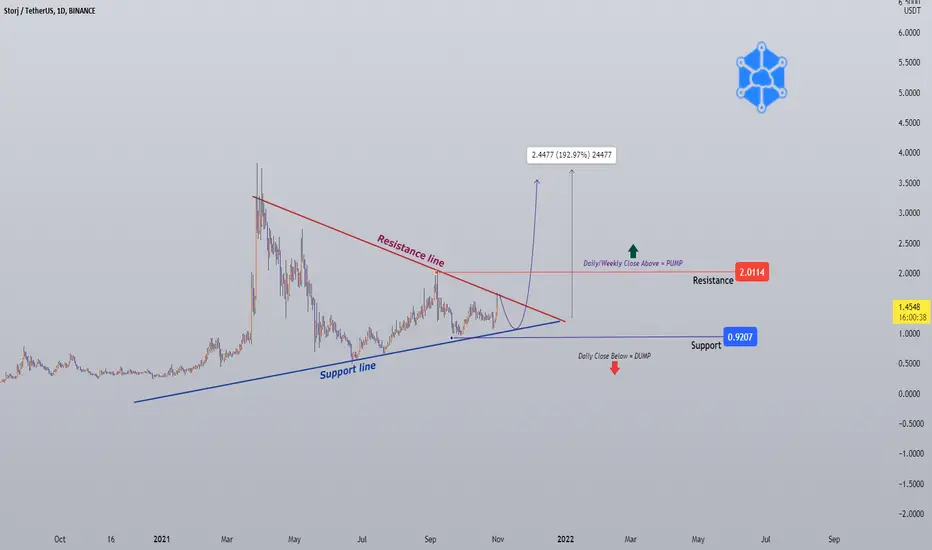
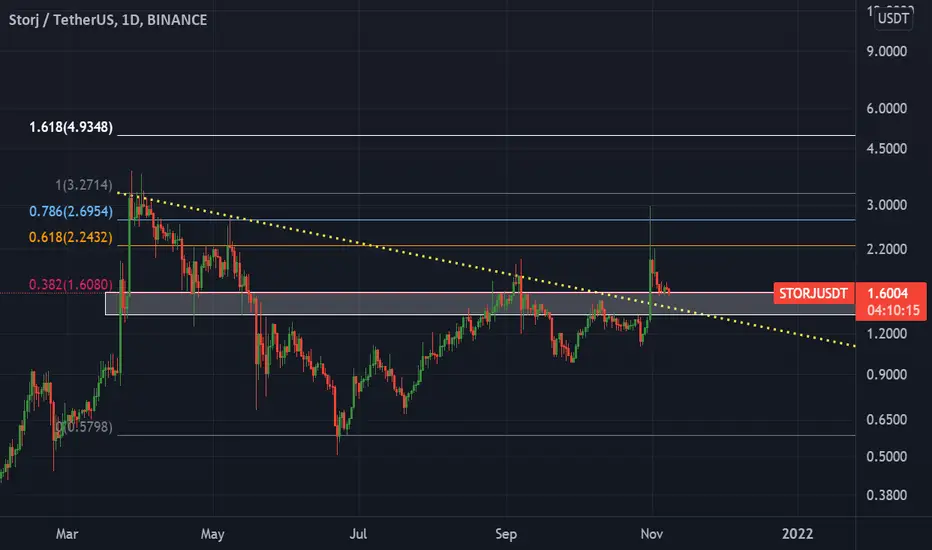
#STORJUSDT (Watchlist) 10/21#STORJ maybe worth it to add this coin to your Watchlist. 👀
Pree "like button" and leaving your "comments" below our ideas is a great thing and supports us to providing more ideas.❤️ (Share it with your folks)
Everything mentioned on the chart (Pattern/Resistance/Support / Breakout/Breadkwon levels, Also R: R)
add to watchlist means the coin we mentioned is forming a pattern or moving near a historical bottom, around or above good support, increase in trading volume , showing a reversal candle, accumulation stage, etc, but no reaction from bulls, so we inform you to add it to your watchlist until the right time for entry.!!
Ps:
we avoid trading any coin if the entire project for it is based on gambling, prostitution, human trafficking, borrowing, and lending, etc.
This is not financial advice, The purpose of these Charts is to give you an idea about coin movement (not buy or sell signal) so before following any idea be sure to do your own research, and follow your risk management. the Cryptocurrency market is very volatile and involves gains and losses as well so know very well what you are heading towards before engaging in it.
The information we mentioned here is a personal effort that is subject to success or failure and we welcome constructive criticism.
Good luck to All.
🙏we ask Allah reconcile and repay🙏
STORJUSDT.P trade ideas
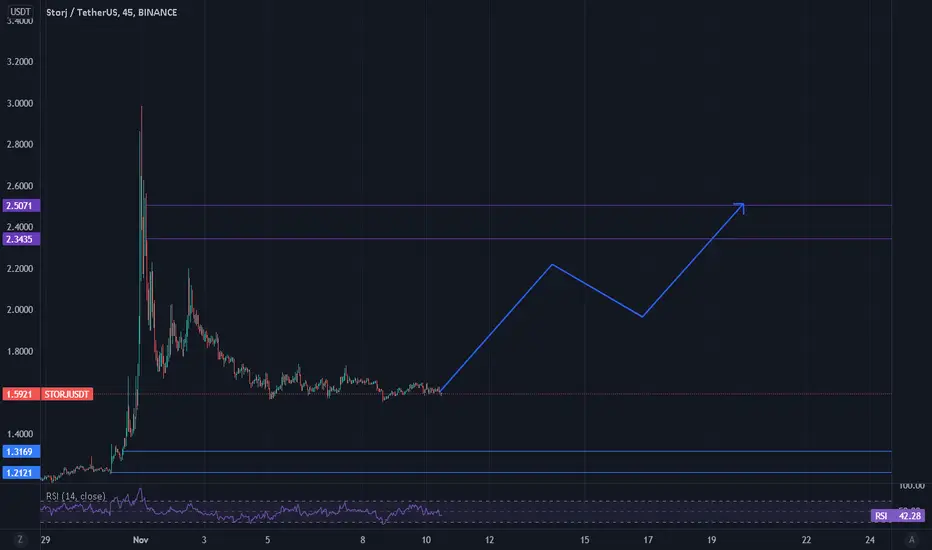
STORJ ready for a big move UPSTORJ about to produce a big move up with any daily closure above $2.19 on a daily time frame.
Target over the next few days would be $2.8
Invalidation point would be any daily closure under $1.95

STORJ/USDT is about to blowThe uptrend is emerging. This is likely to be the beginning of either a small or exceptionally strong growth in the long run.

STORJUSDTThe triangle may be a breakout to one of the local targets, however, the obvious divergences on the RSI are confusing, as well as that the price closes near the session low with increased volume, - shows the CMF.
It's still better to wait for the level test here and then enter.
If you want to enter a breakout, then the stop is very large behind the EMA20, but it can also be broken, as previously seen on the chart.
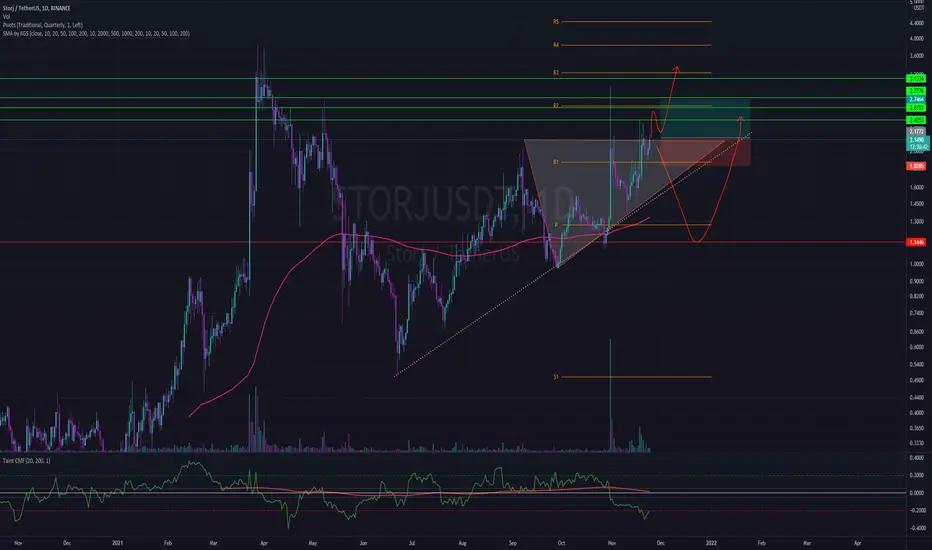
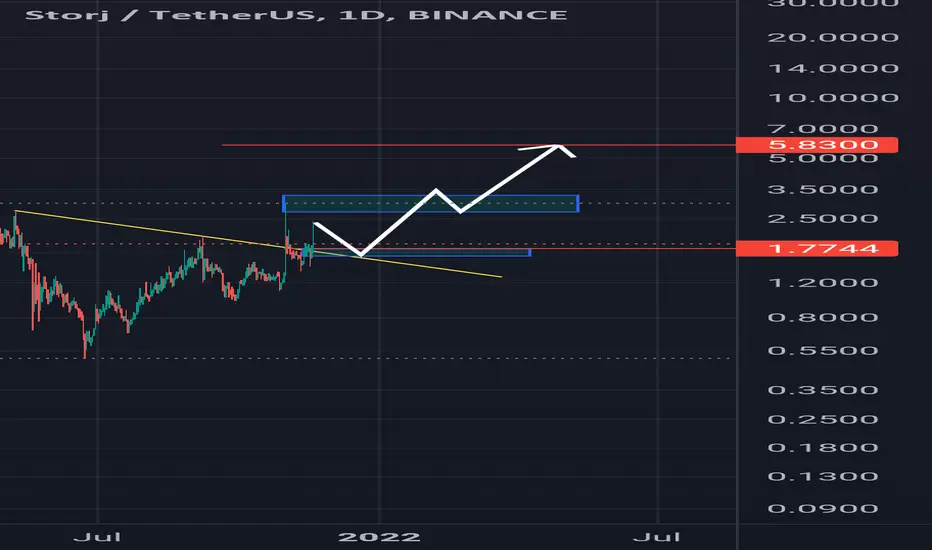
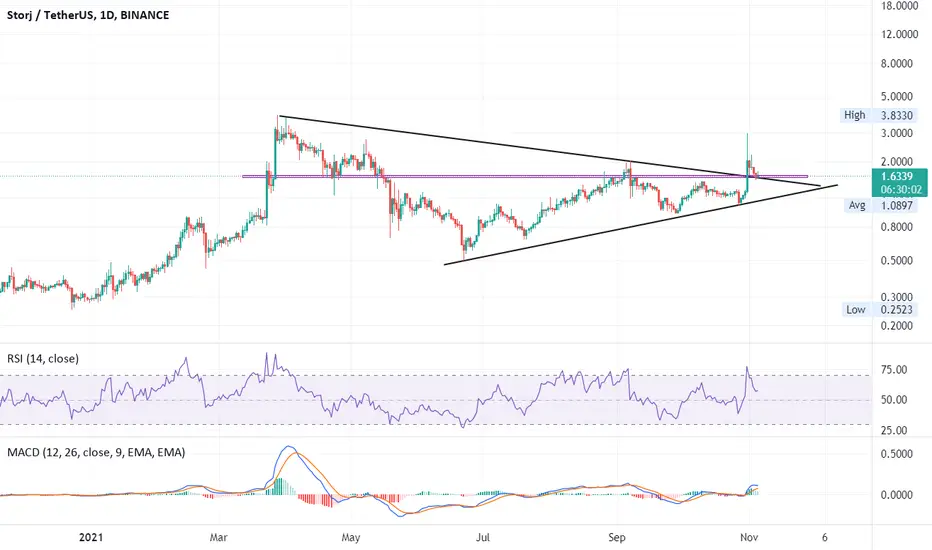
STORJ Story continues- Ascending traingle
- Bullish structure
- 9EMA curling away from 21EMA
Ascending triangles could break either way as buyers are eager to buy up the token in order to break resistance. However, it is definitely not a given that resistance will break.
Target will be the same height as the pole of the triangle. Which coincides with the daily resistance zone.
Stop loss set just below the 4H support level/

Storj if breakout If storj can break out of here. We can see a possible 2x.
a 50% increase to 3 for sure.
STORGUSDT LongGlobal trend is drowth on the different timeframes. Nearest support line is local growing trend. Moreover there are two big support lines on $1.3262 and $1.2348. The resistance line is $2.2601. Local resisance trend penetration finished and now is a good point to open long positons. The target price is $2.2500 a little bit behind nerest resistance on $2.2601. Position oppening at the current price $1.6000. Investment horizont ~ 1.5 weeks. In the negative scenario stop limit price should be under the local growing trend ~ $1.5000. Potencial loss ~ 7%. Potencial profit ~ 40%. Profit/loss ratio is around 6:1.

Storj looking goodLonging Storj here, hoping for a continuation of the rally it recently had. DCA´s at the black lines and tps at the fibs above!

STORJ potential breakout retestSTORJ / USDT
potential retest after breakout of gaint structure
Supports are shown in chart should hold to remain bullish
Best of wishes 🙏

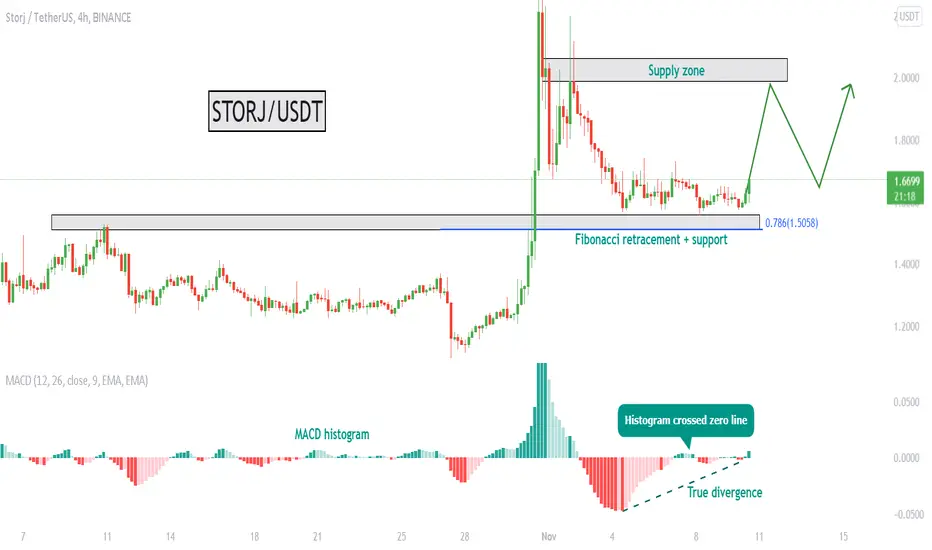
STORJ – quick pump ahead!Hello, everyone!
I found the quick scalping trade on STORJ. As we can see it has very nice consolidation after a huge pump next to the support area and the 0.78 Fibonacci retracement for the last impulse. Moreover the MACD histogram formed the true divergence, when the price made lower lows and the histogram made higher lows with the crossover the zero line to the upside and after that to the downside. This is very strong signal. I am going to take profit next to the supply zone.
DISCLAMER: Information is provided only for educational purposes. Do your own study before taking any actions or decisions at the real market.
momentum play with divergence. its a 3 riser with momentum and a deep retrace. pretty good potential.
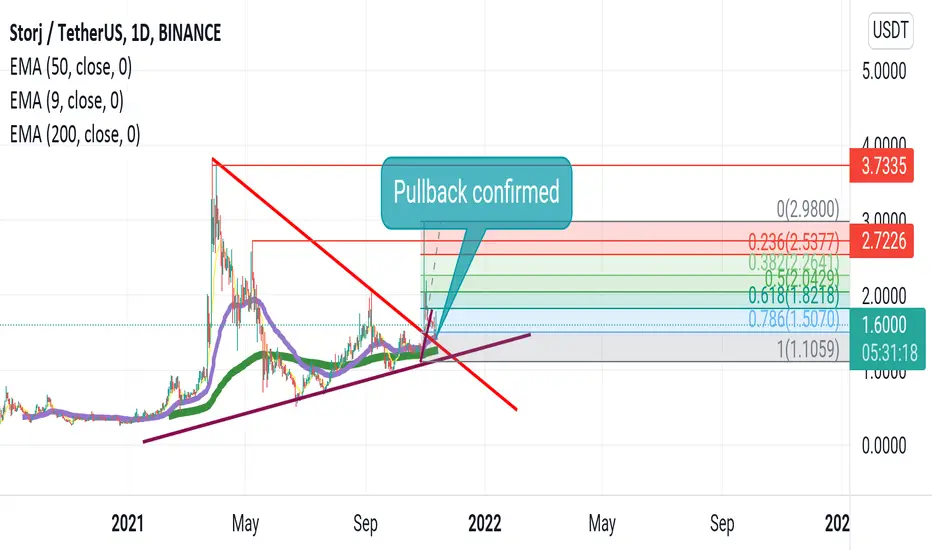
StorjusdtHi . I think pullback for storj is completed and now we should prepare for next bull run. Target and support is drawn in fibo level. Can we see new ath in storj!!!??
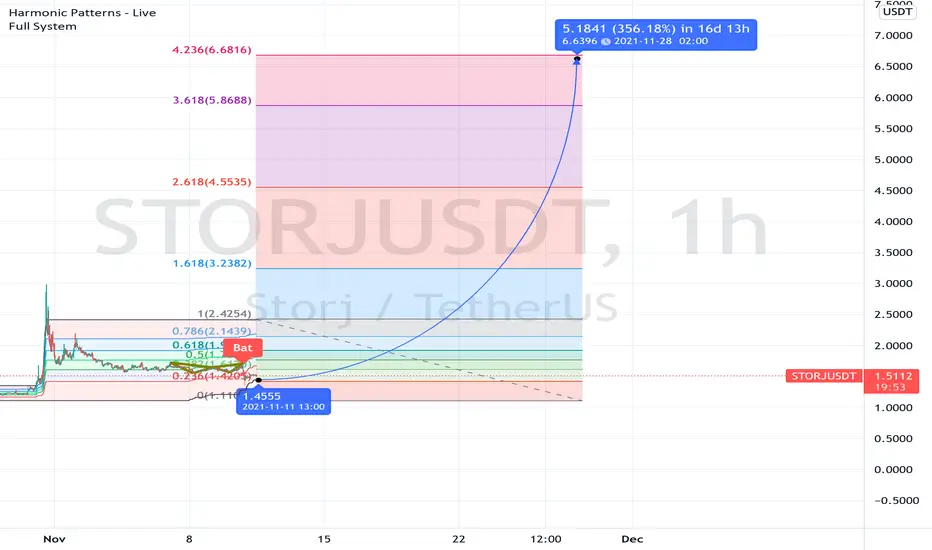
STORJUSDTWho's ready for a run-up to 6.6 dollars in the next coming days, let's make this coin fly, best of luck to everyone involved.
We may be witnessing what is called PO3 on STORJThis is a concept coined I believe by ICT and the first time I heard about it was from RektProof at twitter.
Basically this is when you have a consolidation range, where people have their stops above and below, we then witness a manipulation like in the chart above, and then we may see a significant rally after absorbing all of the liquidity sitting below the range.
Are you ready for the next move?

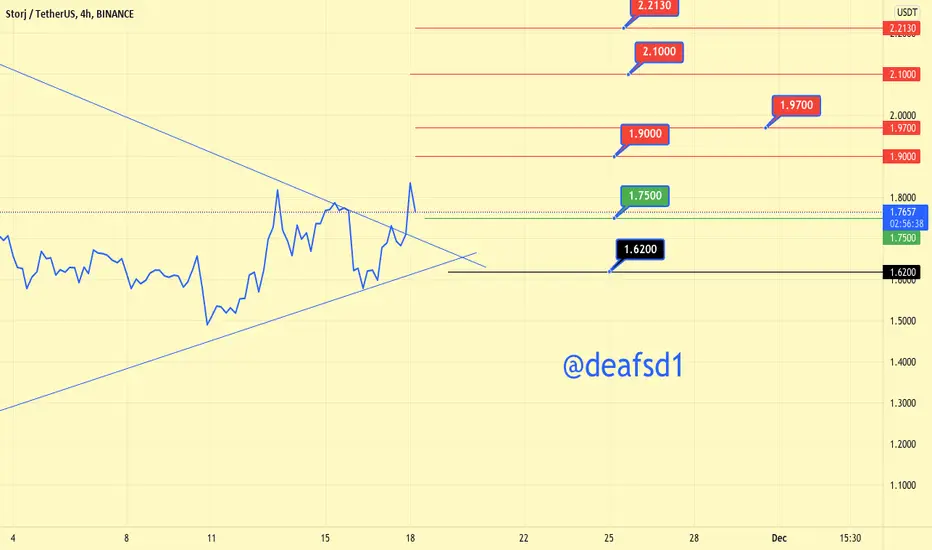
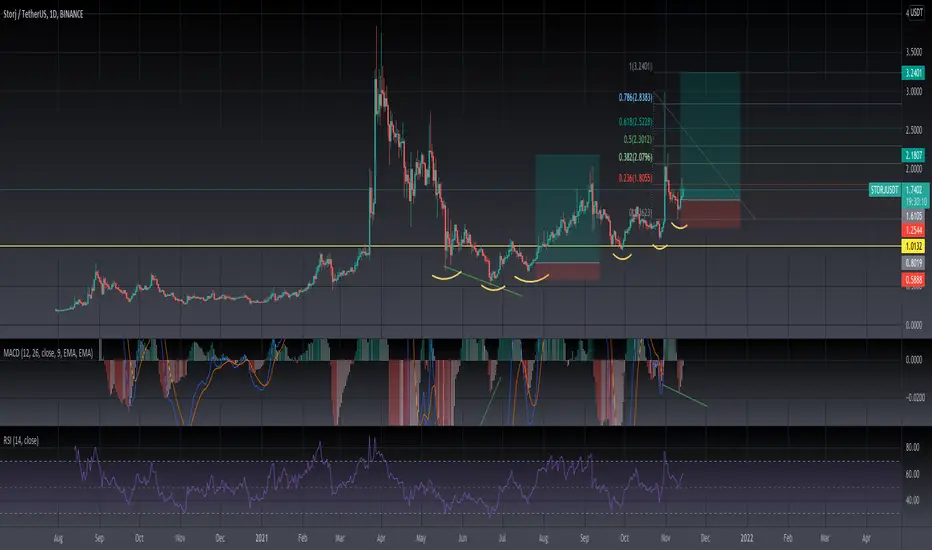
$STORJCurrently on support from that massive pump. Boxed sections are your target profits based on fib retracement/fib extension points.
Rule of thumb sell 1/3 of the value as you go (Don't sell early if its bull run). Then use that profit to put into other coins.
How Storj looking?Hello everyone! After a pump, storj is consolidating above the trend line and supoort area which seems retest of 200 days falling trend. Other resistances also fitting with fibonacci levels on the chart. If you want some coin to be analyzed by me, please write in the comments.
Have a nice day!
STORJUSDTThe coin now is on a good buying zone after a great break of down trend.
waiting for the rise as soon as possible.
GOOD LUCK!

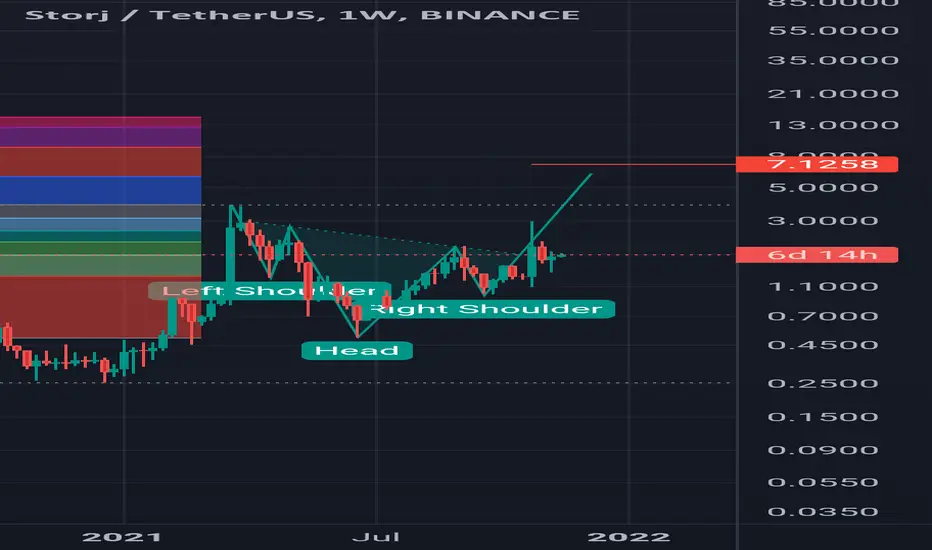
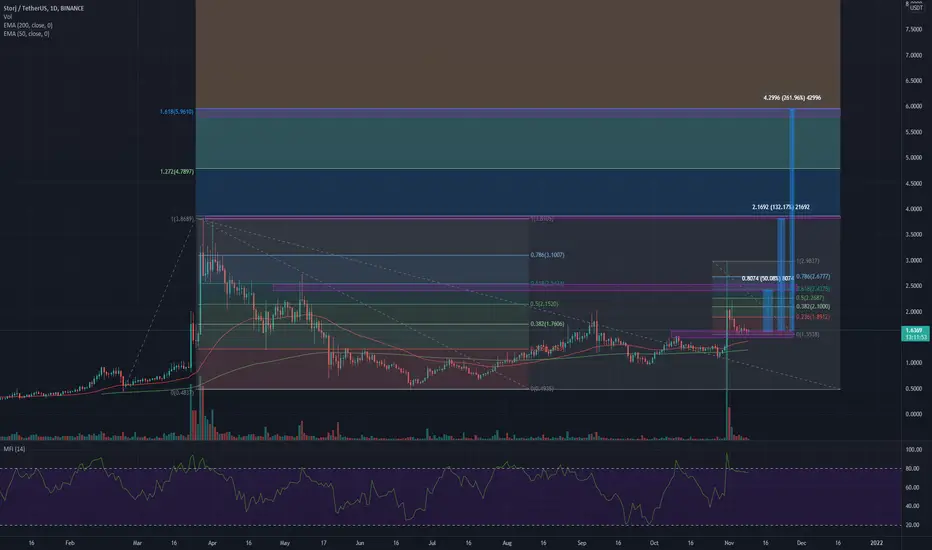
Storj All Time High this Week 3xWe have recently seen movement in STORJUSDT . As chart shows we are very near to bullish flag pattern .
In my opinion Storj value soon touch to ~6.00 USDT in coming week
