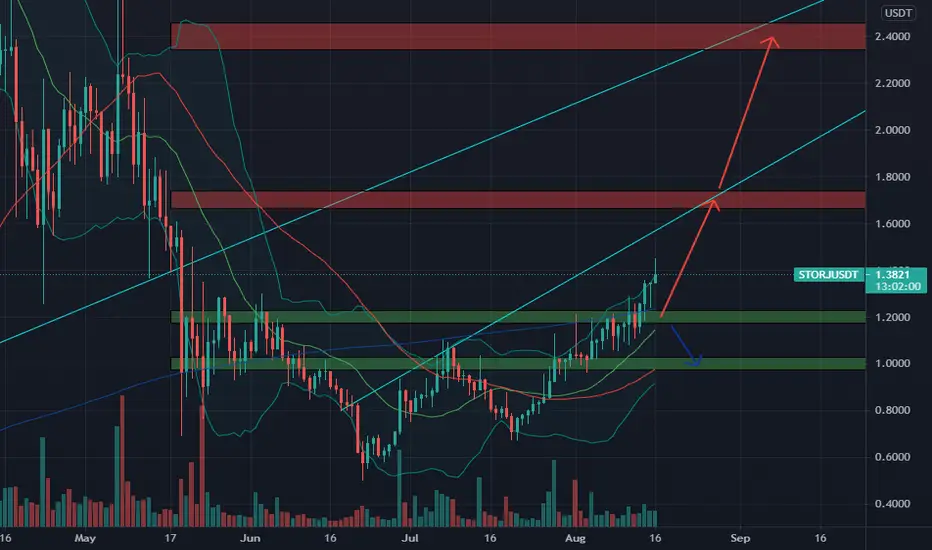
STORJ/USDT - 121% potential setupHello Traders!
Volumetric and cluster analysis shows an increase in demand for STORJ from buyers.
It is possible to consider buying in the middle term at the correction in two ranges:
The first part in the $1.28 to $1.47 range.
The second part in the range of $0.98 - $1.17.
Stop loss at fixing under the $0.75 price level.
The targets for purchases will be price levels:
$1,83
$2,25
$2,60
Good luck and watch out for the market
P.S. This is an educational analysis that shall not be considered financial advice
STORJUSDT.P trade ideas

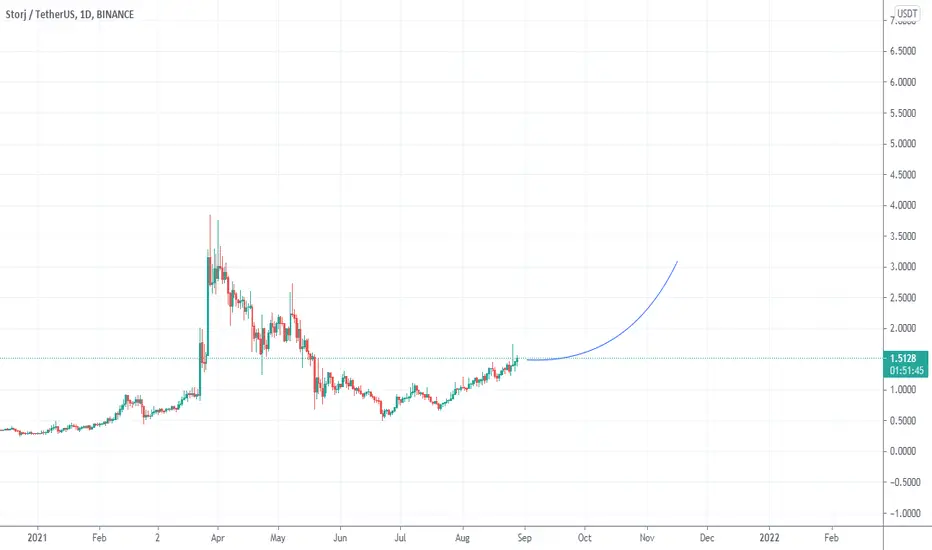
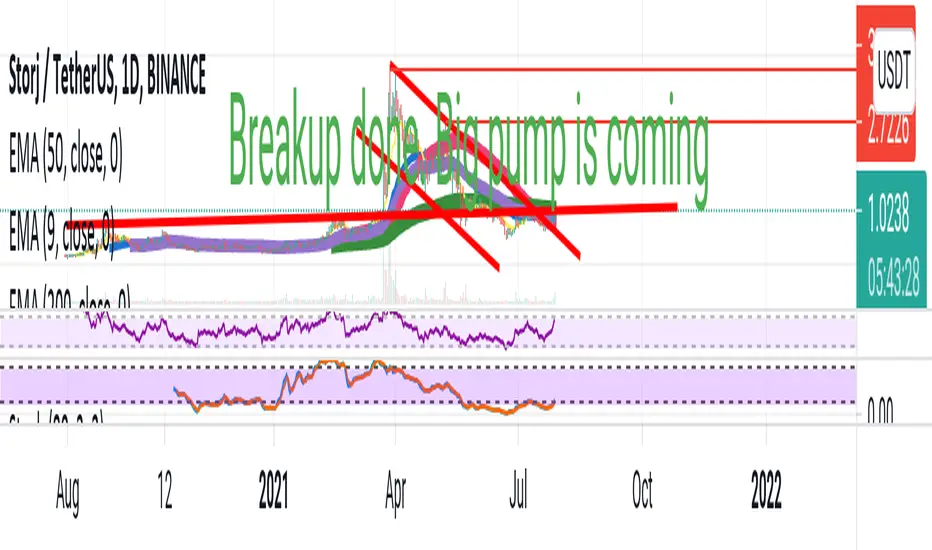
BUY STORJUSDT - TAKE PROFIT AROUND 3+ USDTBUY STORJUSDT - TAKE PROFIT AROUND 3+ USDT
Tt has a very good starting point at this point to start growing.
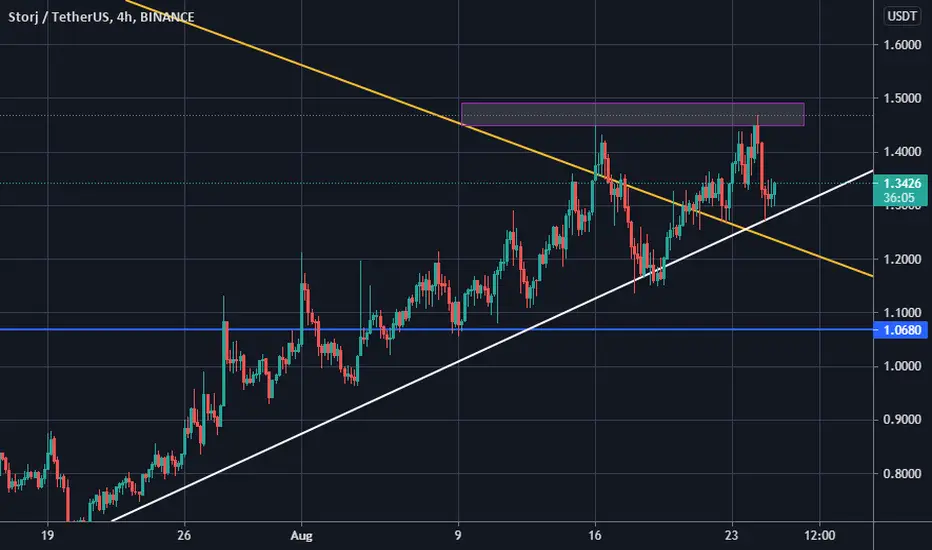
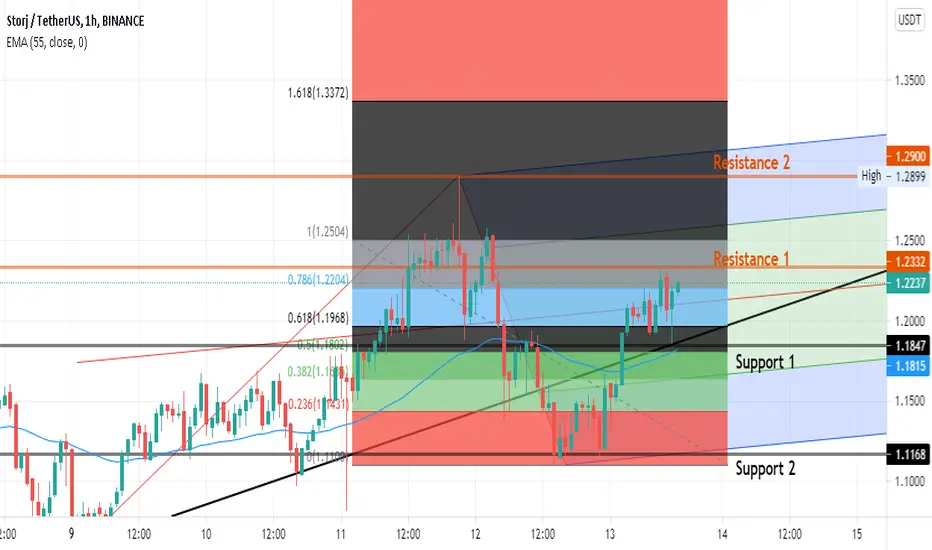
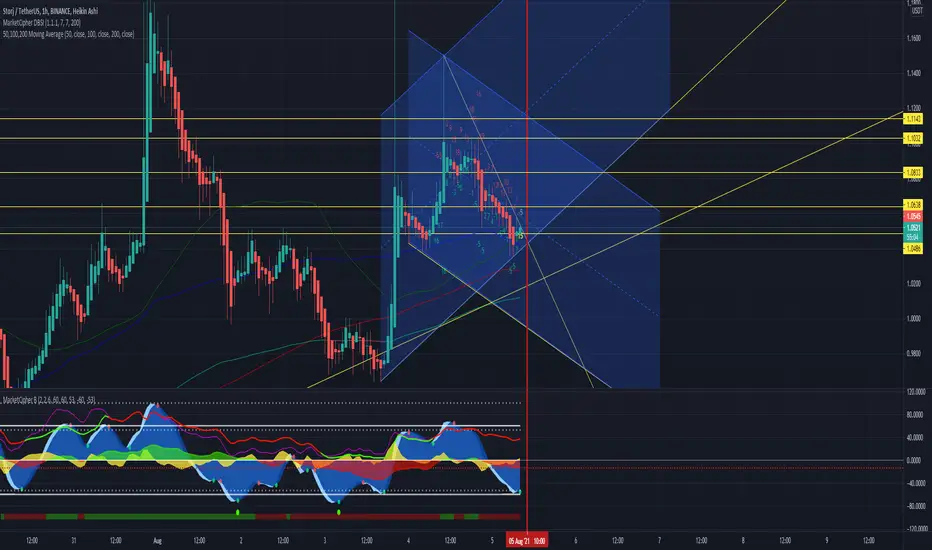
storj/usdt The yellow line of the long-term trend that is broken and on the other hand we are on the uptrend in 4 hours. The specified square area is the resistance area ahead.
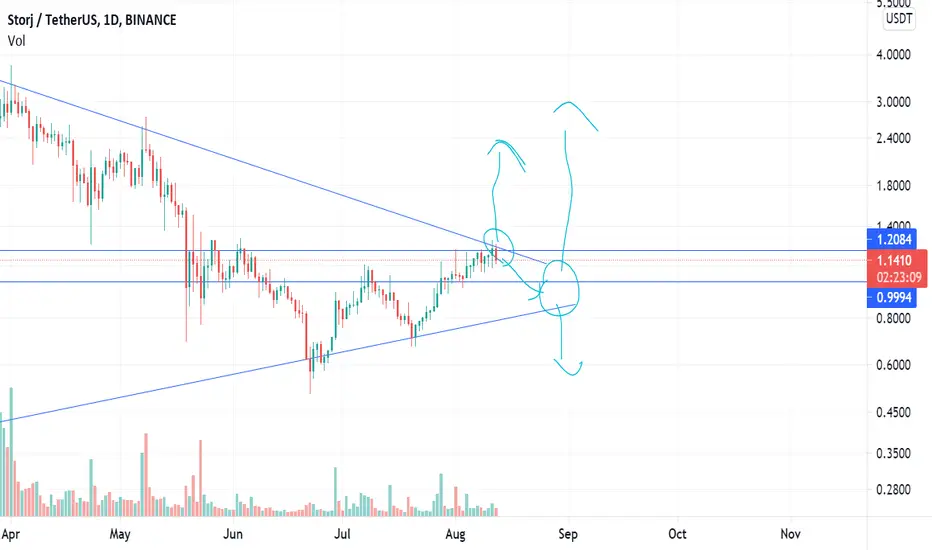
STORJUSDT is creating a descending channel 🦐STORJUSDT is creating a descending channel below the weekly resistance. IF the price is going to have a breakout According to Plancton's strategy (check our Academy ), we can set a nice order
–––––
Follow the Shrimp 🦐
Keep in mind.
🟣 Purple structure -> Monthly structure.
🔴 Red structure -> Weekly structure.
🔵 Blue structure -> Daily structure.
🟡 Yellow structure -> 4h structure.
⚫️ Black structure -> <4h structure.

🆓Storj (STORJ) Aug-16 #STORJ $STORJSTORJ has conquered the $ 1.2 zone and is moving towards the $ 1.7 and $ 2.4 zone. But if it loses the 1.2$ zone, it will fall back to the 1$ zone
📈BUY
🔴Buy : 1.17-1.23$. SL if B
📉SELL
🔴Sell : 1.66-1.74$. SL if A
🔴Sell : 2.34-2.46$. SL if A
♻️BACK-UP
🔵Sell : 1.17-1.23$ if B. SL if A
🔵Buy : 0.97-1.03$ if A. SL if B
❓Details
🕯Timeframe : 1 Day
📈Red Arrow : Main Direction as BUY and SELL section
📉Blue Arrow : Back-Up Direction as BACK-UP section
🟩Green zone : Support zone as BUY section
🟥Red zone : Resistance zone as SELL section
🅰️A : The Close price of candlestick is Above the zone
🅱️B : The Close price of candlestick is Below the zone
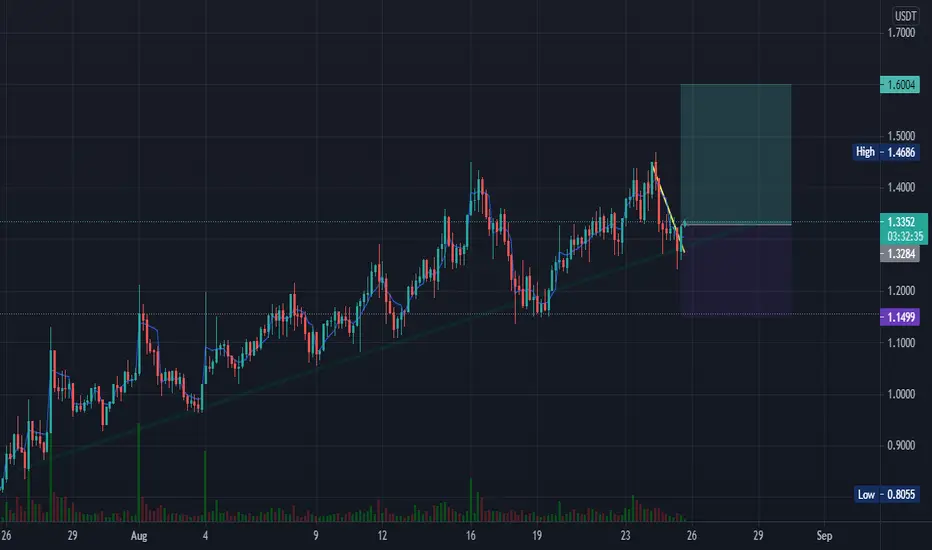
StormjThe biggest resiatnce for stormj is 1.30$ Now it’s scary to try to enter at these type of levels however if it can stay above this level legitiamatly the move will be absolutely incredible. If
You scalp and entry keep stoplosses tight but ive been waiting for this trade for months
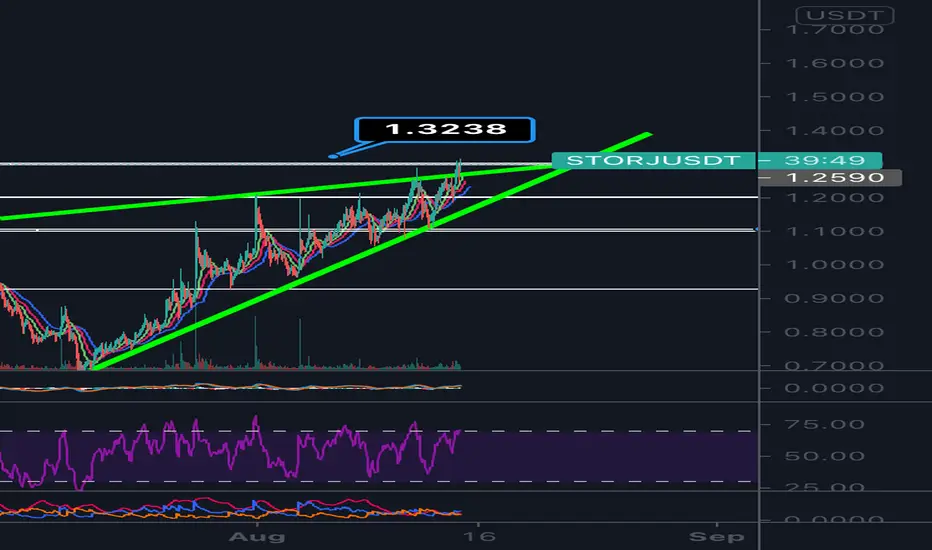
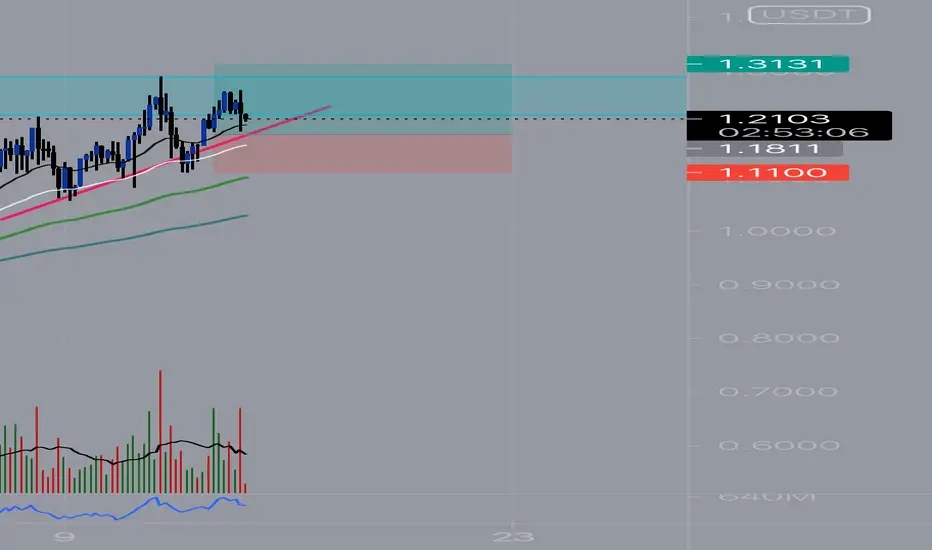
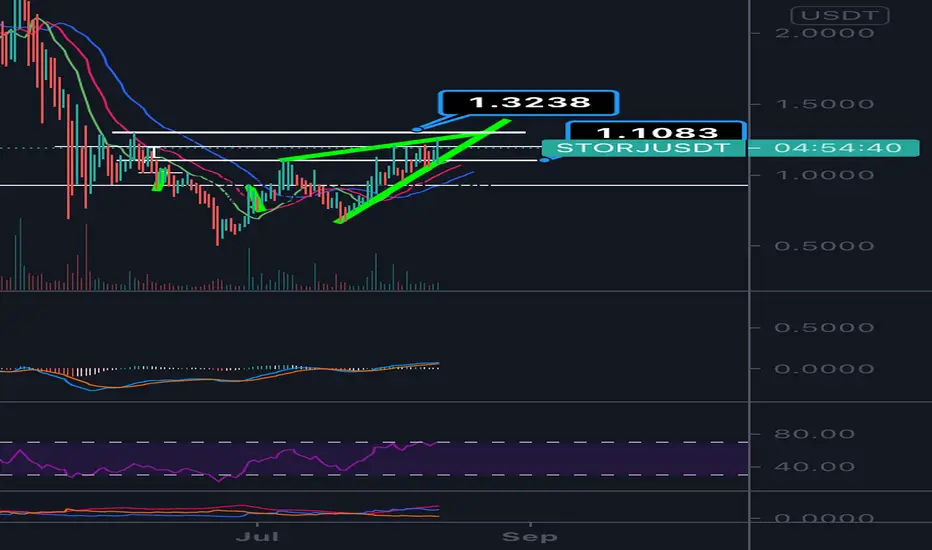
StorJ Ascending triangle formation I go on with spot, if you want to go with leverage trading enter after Breakout/Retest(more confirmation) of the blue zone
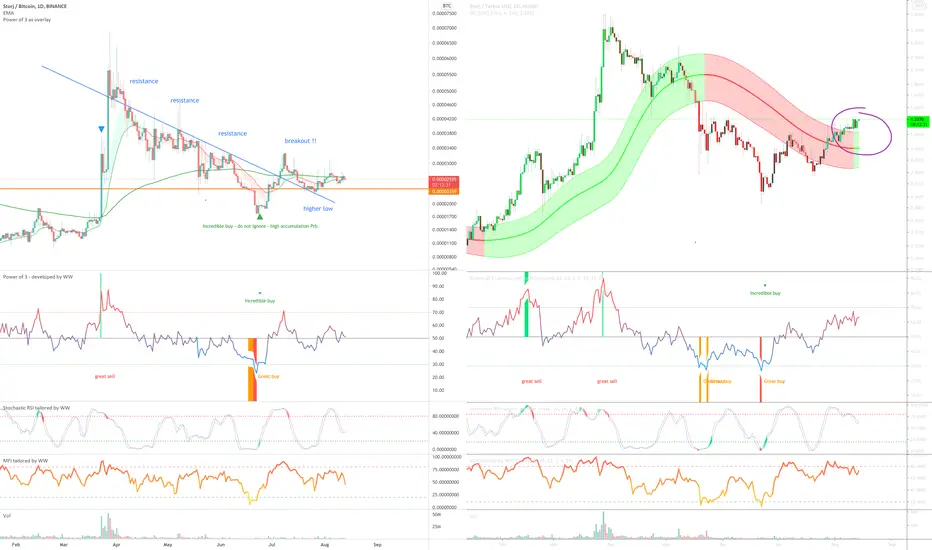
STORJ / BTC / USDOn the above 1-day STORJ/BTC chart (Left) a ‘incredible buy’ signal is shown following:
1) A 70% correction
2) Price action resistance breakout.
Price action is now printing higher low indicating a trend reversal.
On the weekly chart (below) price action prints a bullish engulfing candle following a test of Golden ratio. Excellent.
As for the USD chart (above right), a similar story with the BTC chart with price action recently breaking through the Gaussian channel following a changeover to green. Look left.
Good luck!
WW
Weekly chart
STORJ first analyseHere is my first analysis ever. I chose STORJ because I think it will likely go up soon. Please, have a look and tell me what you think about it. It's just training for me.
StormjSuper appealing. 1.30 resiatnce has been huge for storm if it can finally clear it and close a daily above. It will be insanely bullish. Watching stormy
StormjI entered at 1.10. If we hold that level it’s a great sign. Breaking 1.22 and holding up there is huge but the main resiatnce is 1.31 and if we were to bust through that. Massive trade setup
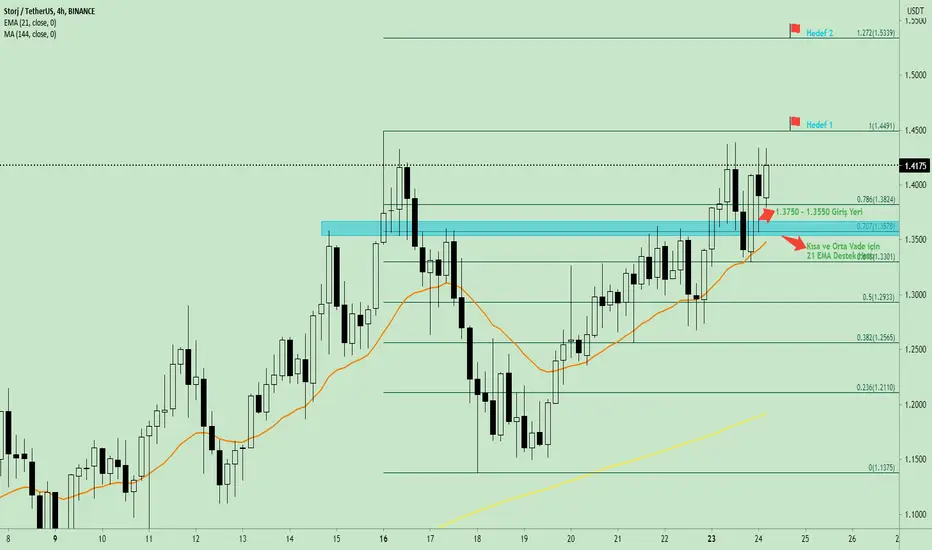
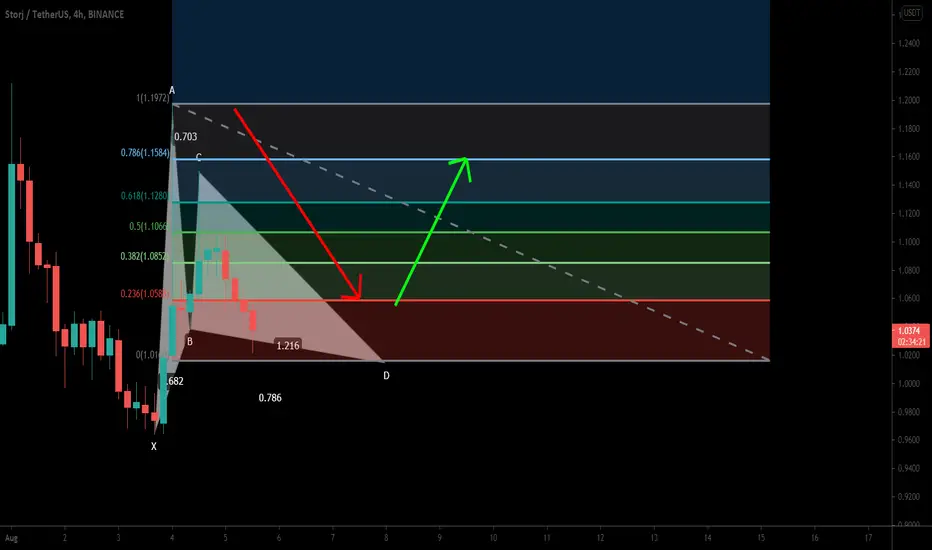
STORJ formed a bullish Gartley for upto 13.5% moveHi friends, hope you are well and welcome to the new trade setup of Storj token.
On a 4-hourly chart, the price line of STORJ has formed a bullish Gartley pattern.

STORJ formed a big BAT for upto 270% big rallyHi dear friends, hope you are well, and welcome to the new update on STORJ token.
On the weekly time frame chart, the price line of Storj has completed the final leg of bullish BAT. There is also 50 SMA support in the buying zone.

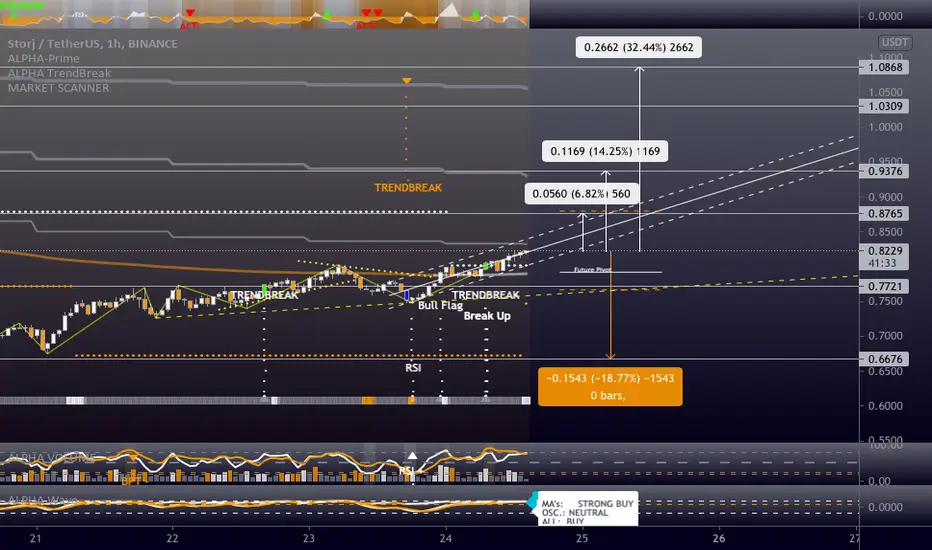
STORJUSDT - Long - Potential 32.44%STORJUSDT - Long - Potential 32.44%
Exchanges: Binance, Huobi.pro
Signal Type: Regular (Long)
Entry Zone:
0.7721 - 0.8207
Take-Profit Targets:
1) 0.8765
2) 0.9376
3) 1.0868
Stop Targets:
1) 0.6676
Entry Triggers- Excellent alt conditions with Storj in active breakup
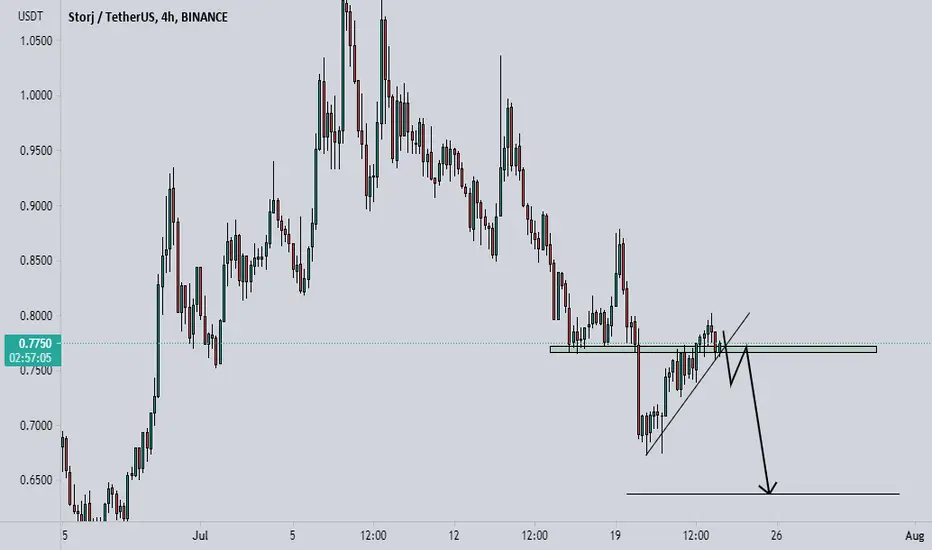
STORJUSDT SETUPSTORJUSDT remains bearish the market on the daily timeframe is still forming lower highs and lower lows, here on the 4hr timeframe we can also clearly see the structure is currently still bearish. What we are waiting to see is a 4hr lower low to break this counter corrective trendline. ONLY if we see a 4hr close below this zone we will then enter a nice short on the retest of this zone.
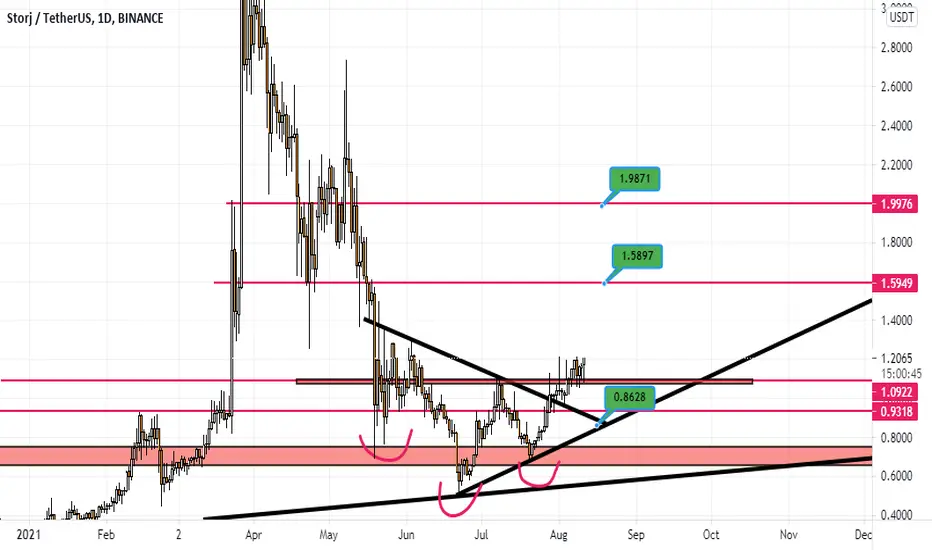
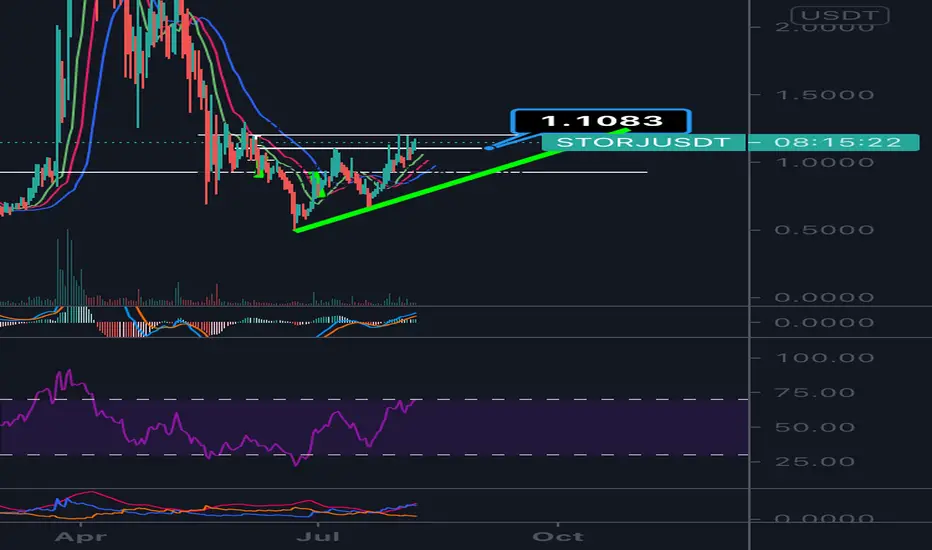
Storj is ready for new ath ?Hello there we are in
1- bullish market
2 - Macd ready
3 - retrace are done
4 - we have broke descending channel
5 - above all important moving average
Targets are mapped in the chart
This will work for
Storj/btc
Storj/usdt
Support : 0.08585
stop : close daily below with strong candle : 0.08585
