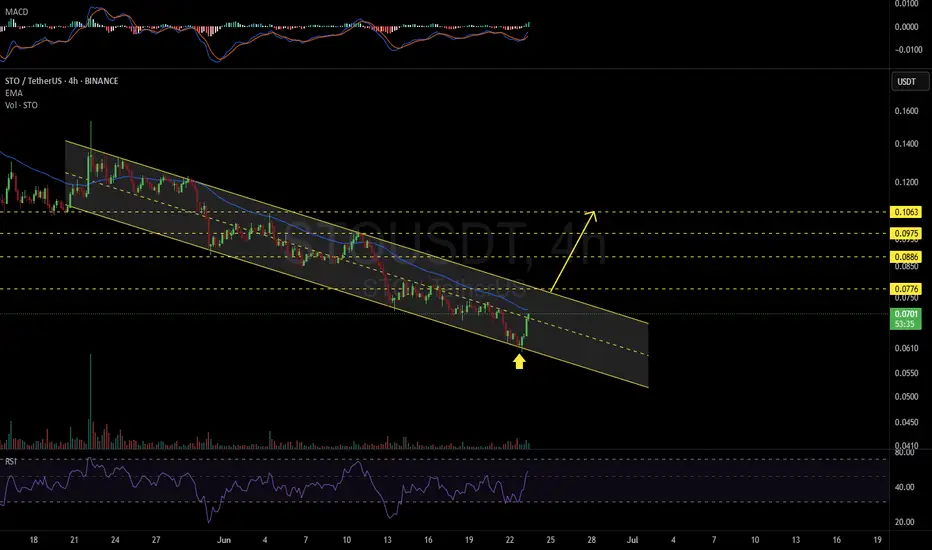
STOUSDT 4H#STO — Breakout Potential Building 🔍
#STO has been trading within a descending channel, reflecting a mid-term corrective structure.
Recently, the price bounced sharply from the channel’s lower boundary (📍yellow arrow), signaling potential bullish momentum emerging from this support zone.
📈 If the
Related pairs
STOUSDT UPDATE
Pattern: Falling Wedge
Current Price: \$0.0693
Target Price: \$0.14
Target % Gain: 100.32%
Technical Analysis: STO is breaking out from a falling wedge pattern on the 12H chart, showing strong bullish momentum with an 8.62% gain today. Volume supports the breakout and the move is aiming for a p

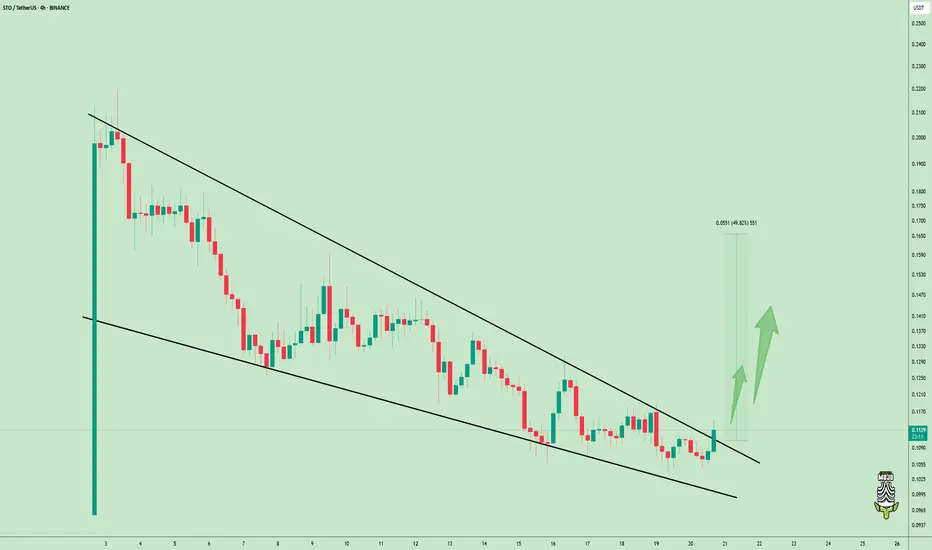
$STO is getting ready for a breakout!ASX:STO is getting ready for a breakout!
After a long downtrend, the chart has formed a clean falling wedge a classic bullish reversal pattern.
We’re now seeing a breakout attempt, and if momentum holds, we could see a sharp 40%+ move to the upside. 🚀
Keep an eye on this, it could move fast
BLU
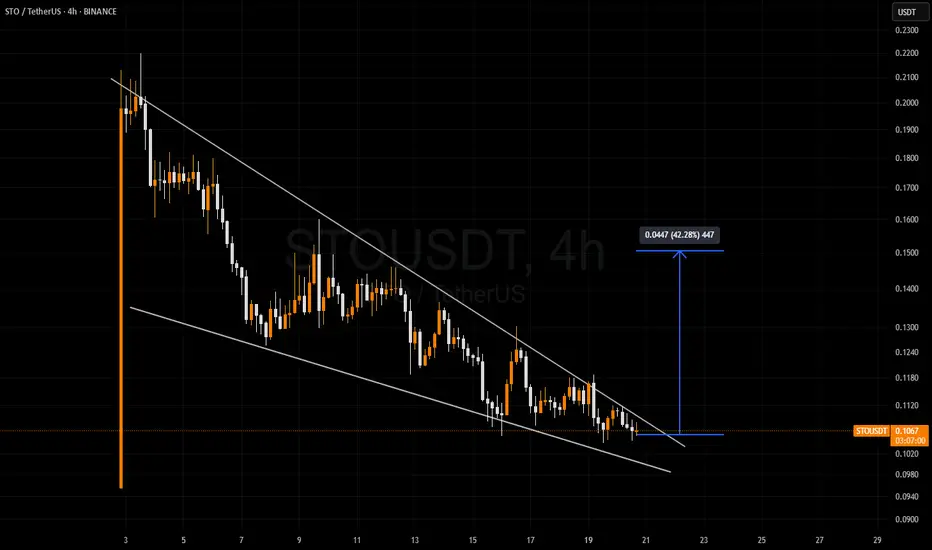
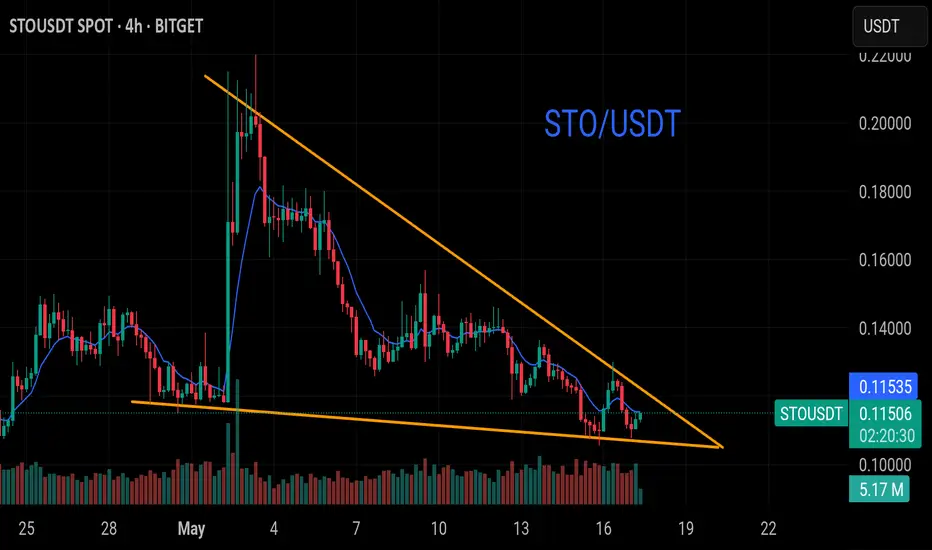
$STO/USDT Bullish Setup:$STO/USDT Bullish Setup:
Price is forming a descending triangle and is now testing the upper trendline — signs of possible breakout.
🔸 Key Support Zone at 0.1100:
This level has held multiple times, showing strong buyer interest.
🔸 Upside Target:
If price breaks 0.1150 with volume, a move toward
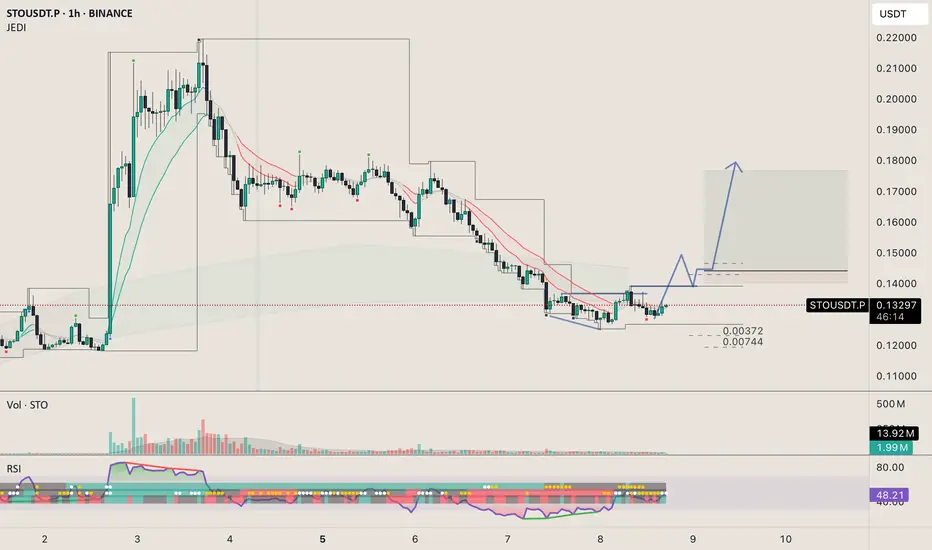
potential continuationwait until bullish momentum crush the supply line.
then look for buy on pullback to the moving averages.
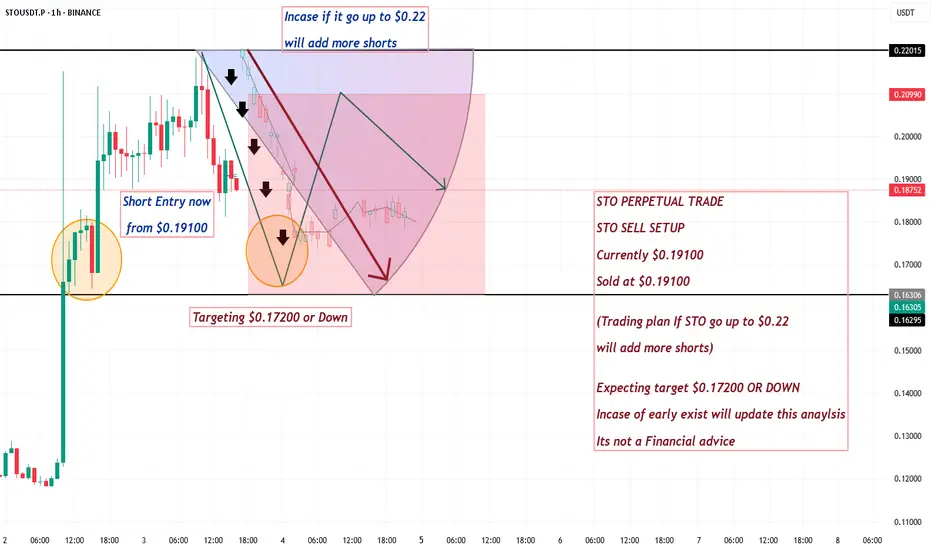
STO PERPETUAL TRADE ,Sold From $0.19100STO PERPETUAL TRADE
STO SELL SETUP
Currently $0.19100
Sold at $0.19100
(Trading plan If STO go up to $0.22
will add more shorts)
Expecting target $0.17200 OR DOWN
Incase of early exist will update this anaylsis
Its not a Financial advice
StousdtSto broke out a corrective bullish pattern after a huge impulsive move and could be followed by another major impulsive move, apply proper risk management

Cross-Chain Liquidity TailwindstakeStone’s infrastructure aligns with rising demand for modular DeFi solutions. Its SDK launch in Q2 2025 could catalyze developer adoption, boosting utility for STO

Tokenomics AdvantageOnly 6% of STO’s 1B supply is allocated to liquidity pools, creating scarcity as adoption grows. Community and ecosystem allocations (17.87% + 4%) incentivize long-term participation
See all ideas
Summarizing what the indicators are suggesting.
Oscillators
Neutral
SellBuy
Strong sellStrong buy
Strong sellSellNeutralBuyStrong buy
Oscillators
Neutral
SellBuy
Strong sellStrong buy
Strong sellSellNeutralBuyStrong buy
Summary
Neutral
SellBuy
Strong sellStrong buy
Strong sellSellNeutralBuyStrong buy
Summary
Neutral
SellBuy
Strong sellStrong buy
Strong sellSellNeutralBuyStrong buy
Summary
Neutral
SellBuy
Strong sellStrong buy
Strong sellSellNeutralBuyStrong buy
Moving Averages
Neutral
SellBuy
Strong sellStrong buy
Strong sellSellNeutralBuyStrong buy
Moving Averages
Neutral
SellBuy
Strong sellStrong buy
Strong sellSellNeutralBuyStrong buy
Frequently Asked Questions
The current price of StakeStone/Tether USD (STO) is 0.07013 USDT — it has risen 10.68% in the past 24 hours. Try placing this info into the context by checking out what coins are also gaining and losing at the moment and seeing STO price chart.
StakeStone/Tether USD price has fallen by −6.21% over the last week, its month performance shows a −42.34% decrease, and as for the last year, StakeStone/Tether USD has increased by 133.77%. See more dynamics on STO price chart.
Keep track of coins' changes with our Crypto Coins Heatmap.
Keep track of coins' changes with our Crypto Coins Heatmap.
StakeStone/Tether USD (STO) reached its highest price on May 2, 2025 — it amounted to 0.22001 USDT. Find more insights on the STO price chart.
See the list of crypto gainers and choose what best fits your strategy.
See the list of crypto gainers and choose what best fits your strategy.
StakeStone/Tether USD (STO) reached the lowest price of 0.03000 USDT on Apr 3, 2025. View more StakeStone/Tether USD dynamics on the price chart.
See the list of crypto losers to find unexpected opportunities.
See the list of crypto losers to find unexpected opportunities.
The safest choice when buying STO is to go to a well-known crypto exchange. Some of the popular names are Binance, Coinbase, Kraken. But you'll have to find a reliable broker and create an account first. You can trade STO right from TradingView charts — just choose a broker and connect to your account.
StakeStone/Tether USD (STO) is just as reliable as any other crypto asset — this corner of the world market is highly volatile. Today, for instance, StakeStone/Tether USD is estimated as 15.26% volatile. The only thing it means is that you must prepare and examine all available information before making a decision. And if you're not sure about StakeStone/Tether USD, you can find more inspiration in our curated watchlists.
You can discuss StakeStone/Tether USD (STO) with other users in our public chats, Minds or in the comments to Ideas.