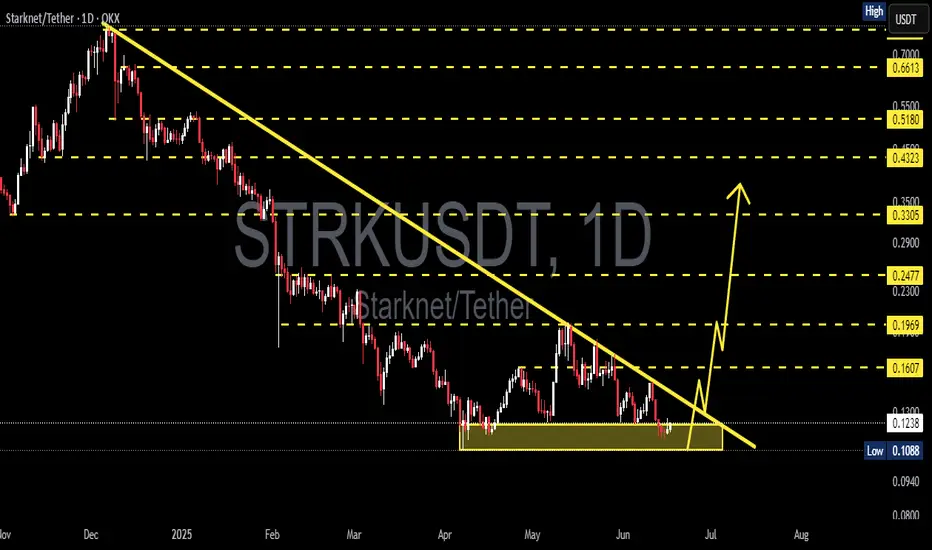
STRKUSDTGiven the price structure and current conditions, the current price data is valuable and worth the risk.
I also kept liquidity for lower levels to reduce the average with each drop.
Please note that this is our team's personal opinion and is not a buy or sell offer.
Sincerely.

STRKUSDT 1D AnalysisSTRK ~ 1D Analysis
#STRK This is the lowest support for now. Buy if you still have faith in this coin with a short term target of at least 15%+ from here.
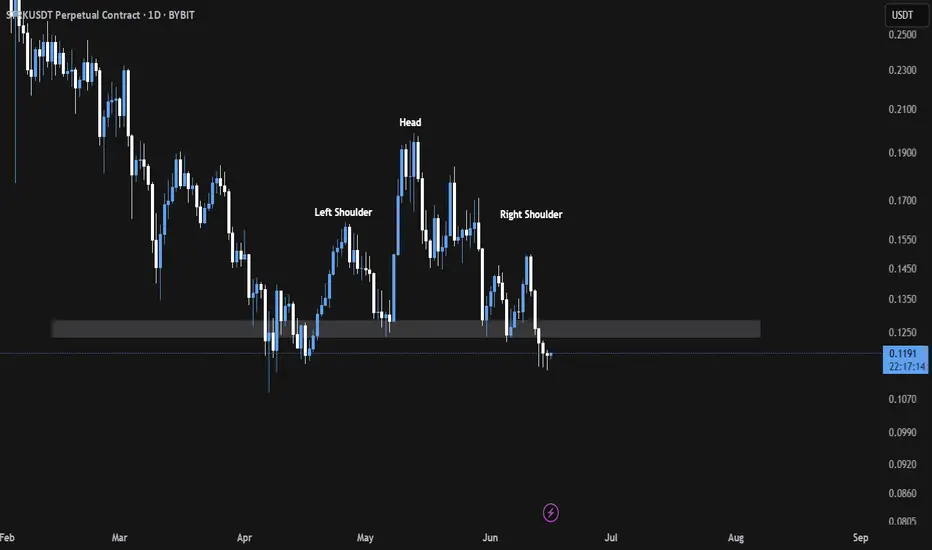
STRK/USDT Breaks Key Support !STRK/USDT has broken down from a clear Head and Shoulders pattern and is now trading below the critical support zone of $0.1234–$0.13, which has flipped into a key resistance area.
Unless price reclaims and closes firmly above this zone, long positions should be avoided. Traders may consider light
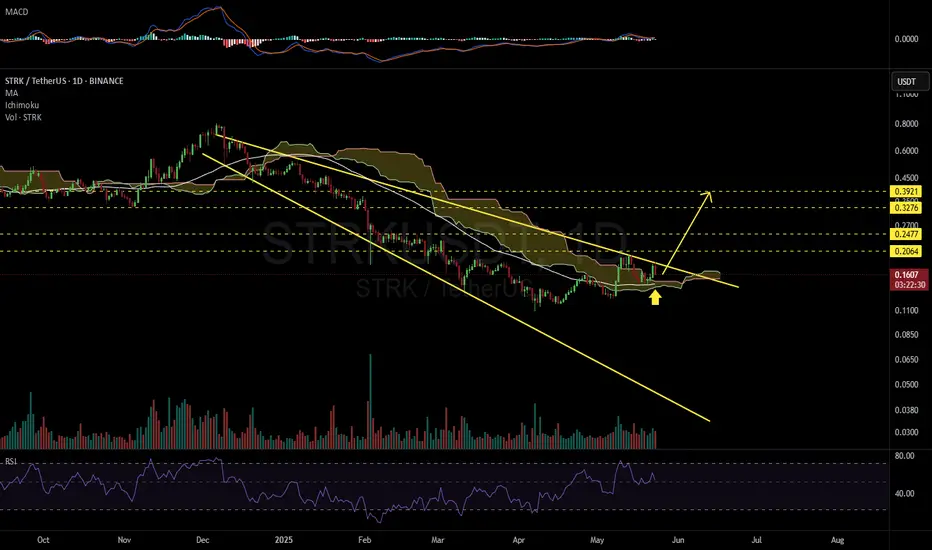
STRKUSDT 1D#STRK is moving inside a Descending Broadening Wedge pattern on the daily chart. It was recently rejected from the wedge resistance. If it manages to close a daily candle above the Ichimoku cloud and the daily MA50, we could see another leg up that breaks the wedge resistance to the upside.
In case
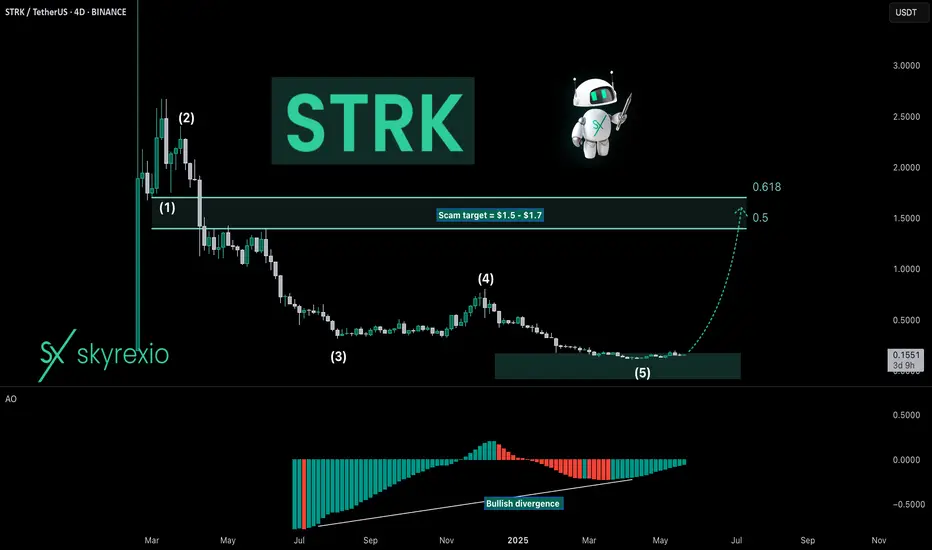
Is Starknet STRK Really Scam? Hello, Skyrexians!
I want to make an update on BINANCE:STRKUSDT because price dropped that much recently and now everyone is telling that this coin is total scam. To be honest I have some doubts that this crypto can bring significant gains in this cycle, but solid bounce can be seen.
Here we hav
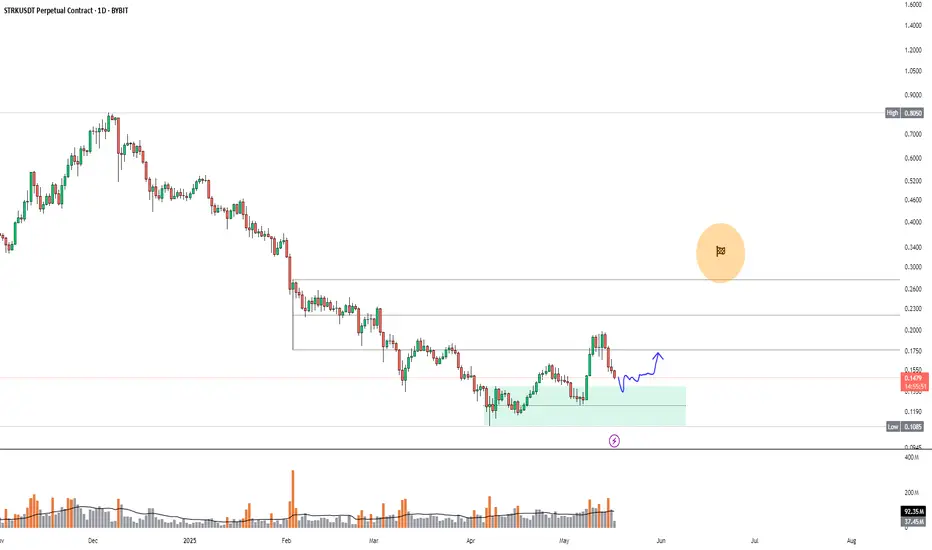
STRK Eyes $0.27 as $0.14 Support HoldsIf BYBIT:STRKUSDT.P can stay above $0.14 and gain strength, I expect the price action to initially move towards the $0.27 level and potentially higher, forming higher highs.
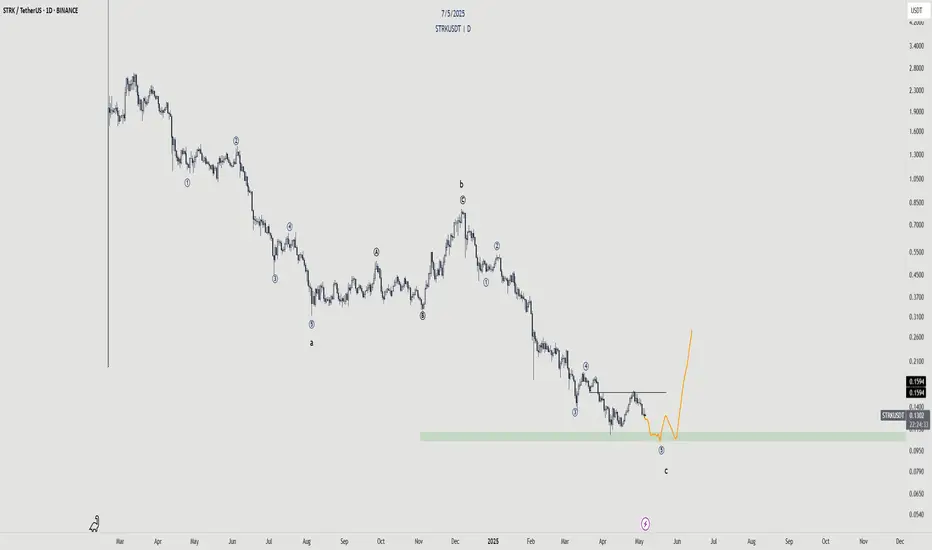
Starknet - Incoming Reversal?Starknet has been on a consistent downtrend. Its about time we finish this wave structure where we will see an impulse finish of Wave c.
Looking for the 5th wave to finish to sweep the low. However, the pullback seems very deep in that micro structure so its also likely we don't get that sweep. As
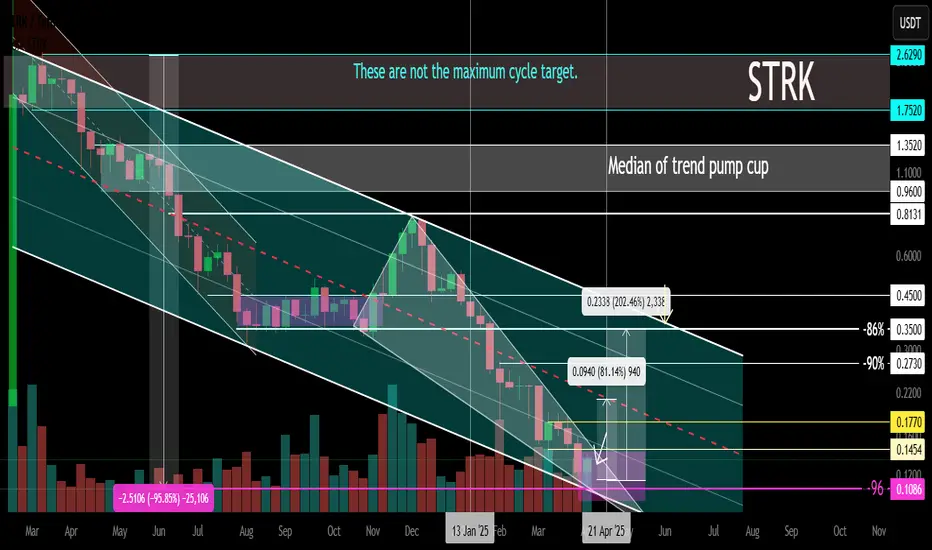
STRK Main Trend 12 04 2025Time frame 1 week for clarity.
Descending channel is the main trend.
Descending wedge is a secondary trend.
Showed the mid-term percentage for targeting potential profit within the channel after breaking through the wedge.
The price reached the lower zone of the descending channel of the main tr
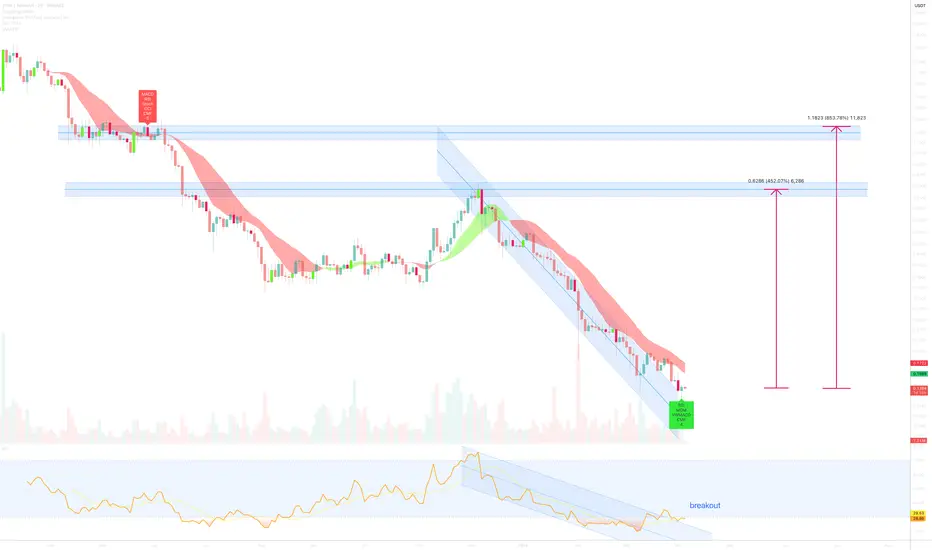
Starknet (STRK) 800% move to print? April 5th, 2025** for the months ahead **
On the above 2 day chart price action has corrected 80% since late 2024. A number of reasons now exist to consider a long position. They include:
1. Price action and RSI resistance breakouts.
2. RSI trend reversal.
3. Regular bullish divergence.
4. There are two resistan
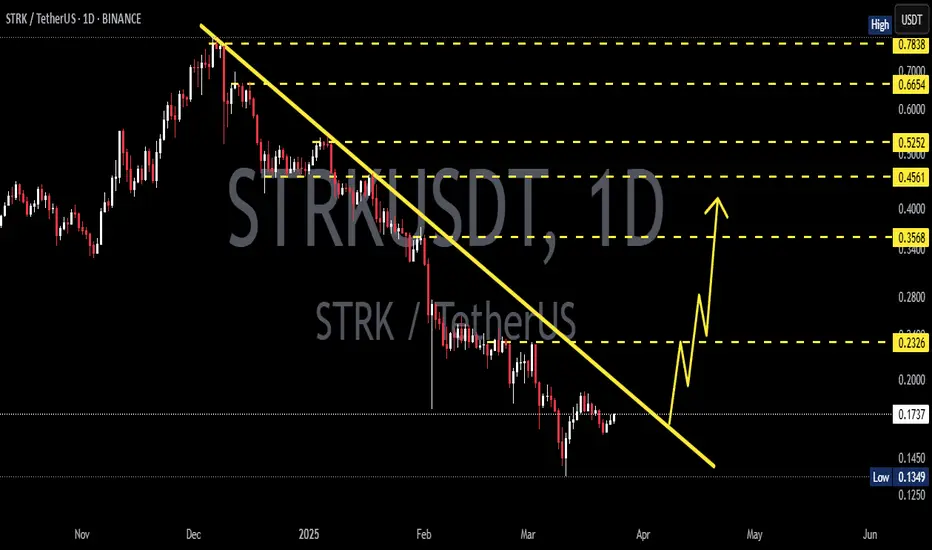
STRKUSDT 1DSTRK ~ 1D Analysis
#STRK High risk trading. Buy gradually after successfully penetrating this resistant line with a short -term target of at least 10%+.
See all ideas
Summarizing what the indicators are suggesting.
Oscillators
Neutral
SellBuy
Strong sellStrong buy
Strong sellSellNeutralBuyStrong buy
Oscillators
Neutral
SellBuy
Strong sellStrong buy
Strong sellSellNeutralBuyStrong buy
Summary
Neutral
SellBuy
Strong sellStrong buy
Strong sellSellNeutralBuyStrong buy
Summary
Neutral
SellBuy
Strong sellStrong buy
Strong sellSellNeutralBuyStrong buy
Summary
Neutral
SellBuy
Strong sellStrong buy
Strong sellSellNeutralBuyStrong buy
Moving Averages
Neutral
SellBuy
Strong sellStrong buy
Strong sellSellNeutralBuyStrong buy
Moving Averages
Neutral
SellBuy
Strong sellStrong buy
Strong sellSellNeutralBuyStrong buy
Displays a symbol's price movements over previous years to identify recurring trends.