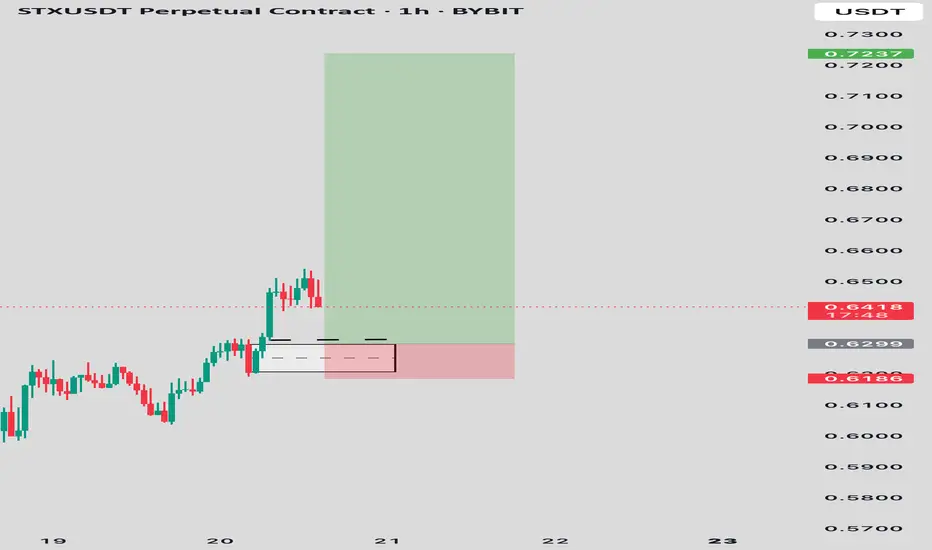
STXUSDT LONGPrice has broken out of a consolidation range and retested previous structure support at 0.6299. Bullish momentum followed with a clean engulfing candle on the 1H timeframe, confirming potential continuation.
Entry: $0.6299 (demand zone retest)
Stop Loss: $0.6186 (below demand)
Target: $0.6900 zone
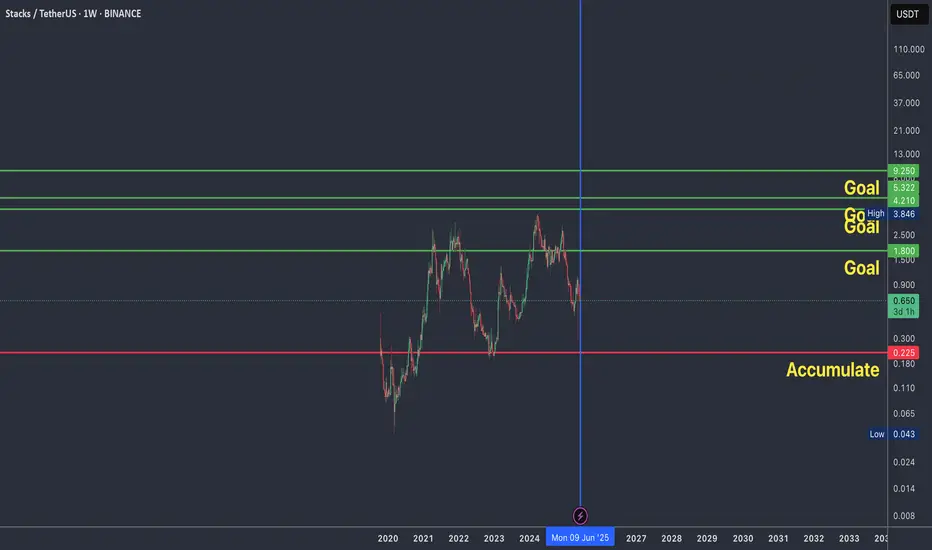
Potential 40x, if...if it reaches to my accumulation level, I believe STX has a 40x potential.
from $0.225 all the way to $9.25
The risk is yours to take.
Do not invest more than you can afford to lose.
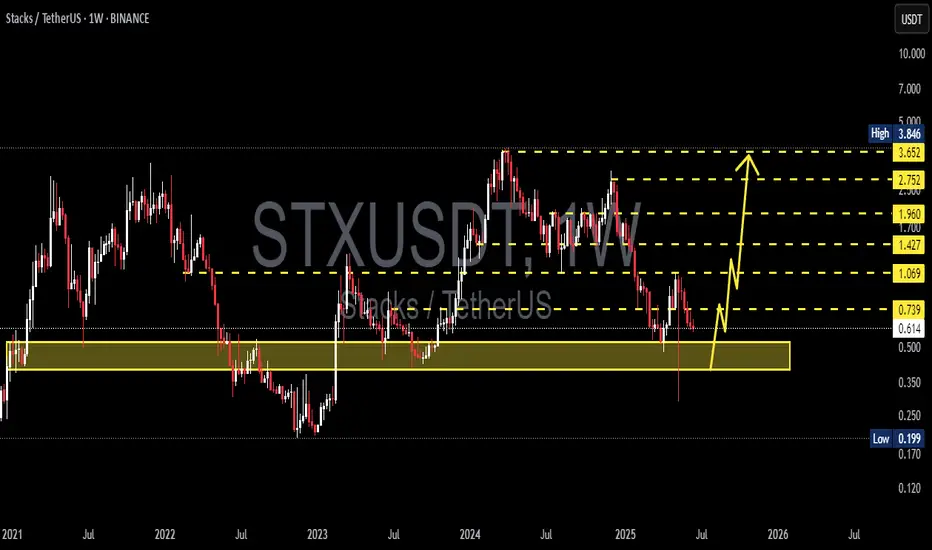
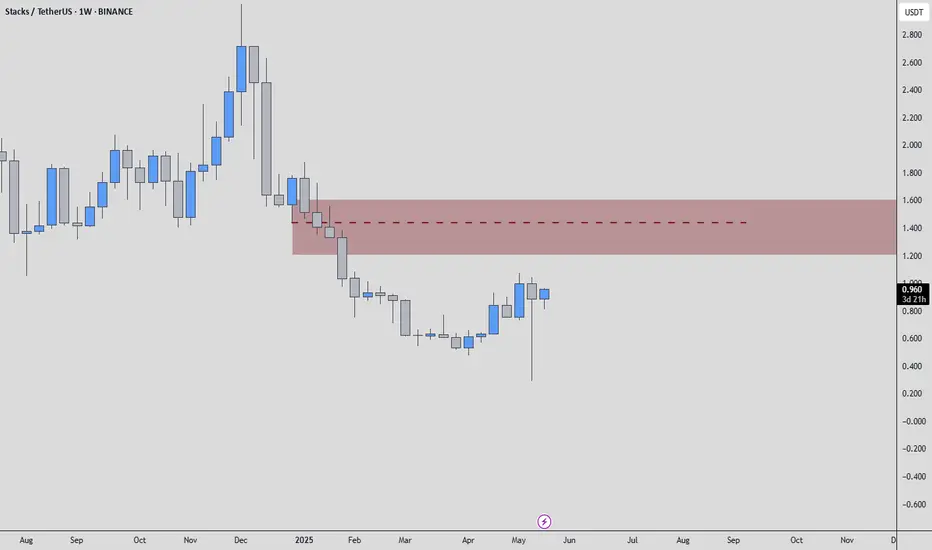
STXUSDT 1W Analysis STX ~ 1W Analysis
#STX Buy back gradually from here with a short-term target of at least 20%++.
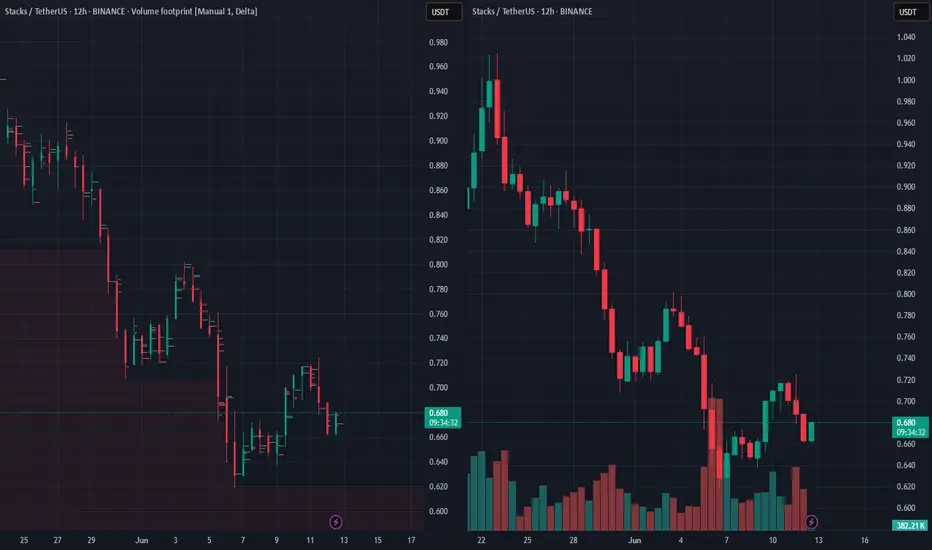
SPOT STX LONG 12.06.2025Pinning after abnormal activity.
💰I enter at the market price.
I'll let you know when I record it manually.
‼️Risk per trade: 2% of the allocated funds for spot trading.
Thank you!
$STX / USDT (4H) – Golden pocket re-entryCOINBASE:STXUSD is testing the 0.618 Fib retracement ($0.65)
A zone where smart money often re-enters after corrections.
Confluence:
🔹 TD9 buy
🔹 RSI divergence
🔹 Fading momentum
🔹 Volume pickup near support = early demand?
Reclaim $0.72 could trigger a relief rally to $0.78–$0.80
Break $0.65 open

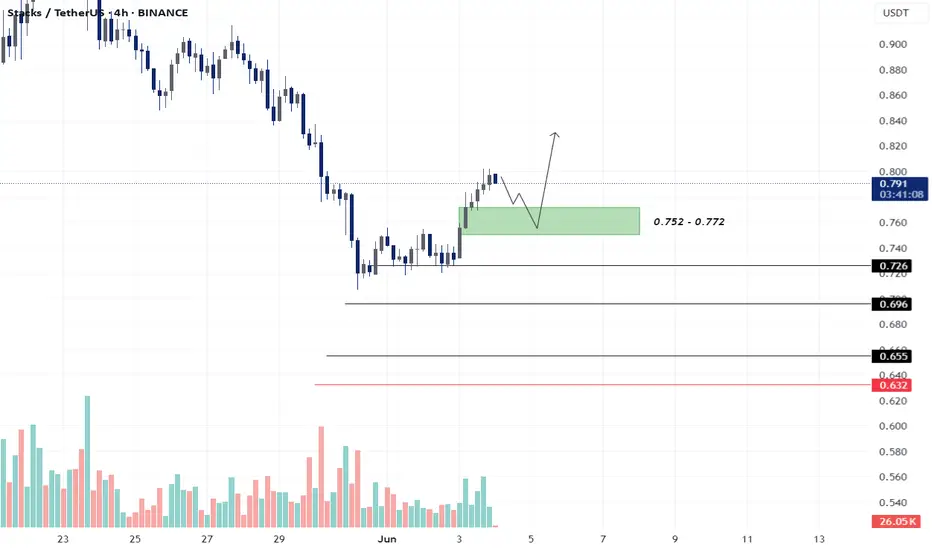
STX - LONG SET-UPBINANCE:STXUSDT
Green Zone (Demand Zone): 0.752 – 0.772
This is a bullish demand zone or entry zone where buyers previously stepped in.
Price may retest this zone before moving higher (as shown by the curved arrow).
Ideal area to deploy entries (25–50%) for a long position.
Acts as a support z
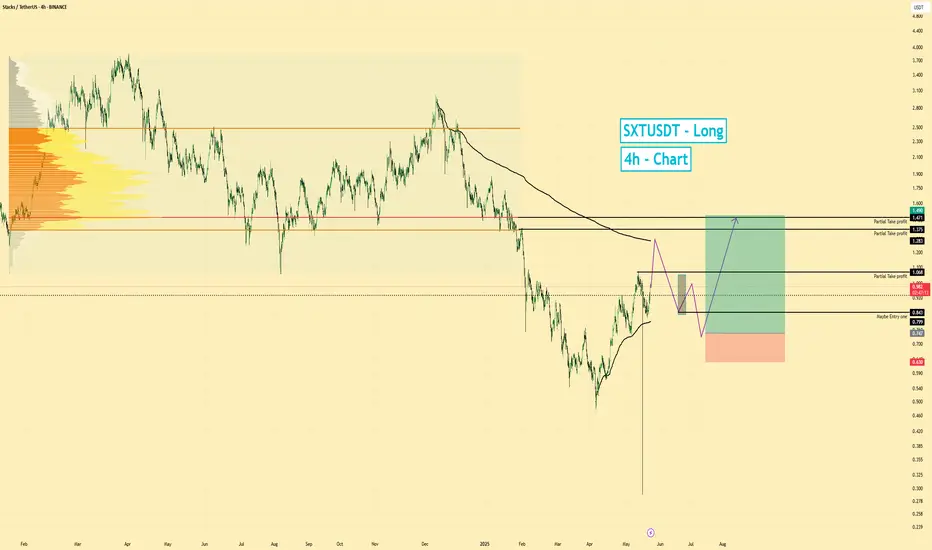
SXT | Long | At Reclaim VWAP | (May 22, 2025)SXT | Long | Reclaiming VWAP & Eyeing Resistance Zone | (May 22, 2025)
1️⃣ Quick Take: SXT is showing strength, climbing toward a key resistance area while holding bullish structure on higher timeframes. Liquidity remains on the bulls' side despite a brief corrective signal on the 30-min chart.
2️
STXUSDT | Heavy Resistance AheadSTXUSDT is now approaching a critical resistance zone . This red box isn’t just any level — it’s where price has previously stalled or reversed .
I’m watching closely, but I won’t chase into strength blindly. Only if this level breaks with volume and flips to support will I consider a long setup
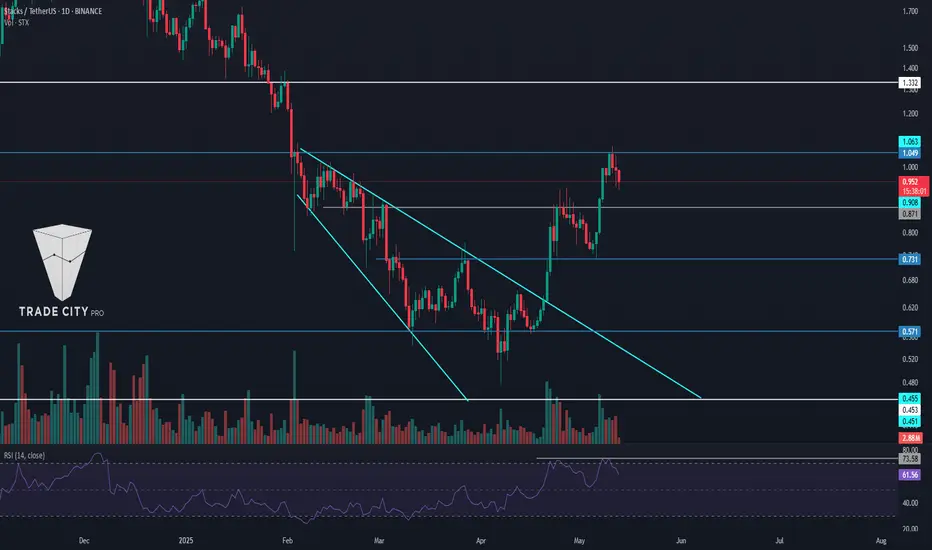
TradeCityPro | STX: Watching Triangle Breakout and RSI Reaction👋 Welcome to TradeCity Pro!
In this analysis, I’m going to review the STX coin, which belongs to the Stacks project—a Layer 2 solution for Bitcoin.
🔍 STX, with a market cap of $1.45 billion, is currently ranked 59 on CoinMarketCap.
🔄 In the previous analysis, I drew an expanding triangle and menti
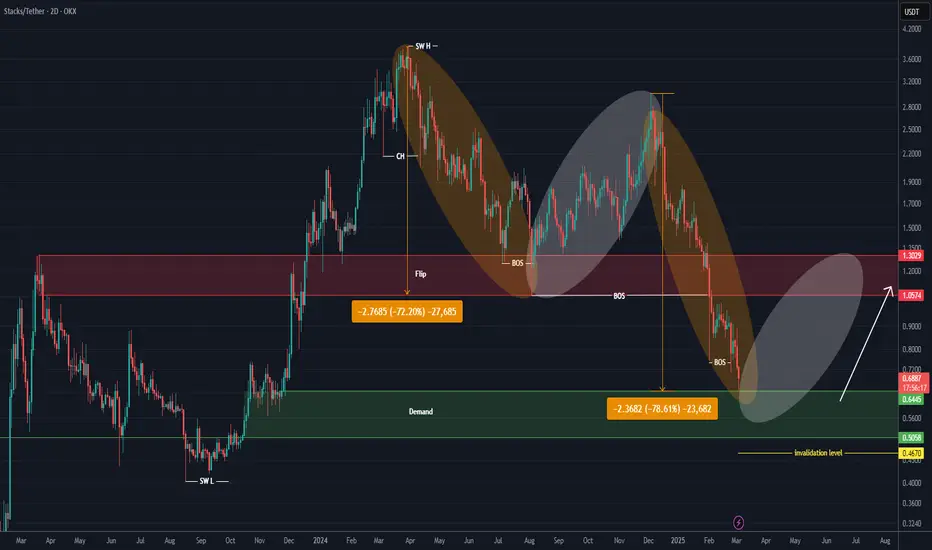
STX ANALYSIS (2D)The STX pair has reached a demand zone.
A price movement fractal seems to be repeating (highlighted by the orange and white boxes).
In the orange boxes, every time STX has dropped more than 72%, it has made a rebound move to the upside.
We are looking for buy/long positions around the demand zone
See all ideas
Summarizing what the indicators are suggesting.
Oscillators
Neutral
SellBuy
Strong sellStrong buy
Strong sellSellNeutralBuyStrong buy
Oscillators
Neutral
SellBuy
Strong sellStrong buy
Strong sellSellNeutralBuyStrong buy
Summary
Neutral
SellBuy
Strong sellStrong buy
Strong sellSellNeutralBuyStrong buy
Summary
Neutral
SellBuy
Strong sellStrong buy
Strong sellSellNeutralBuyStrong buy
Summary
Neutral
SellBuy
Strong sellStrong buy
Strong sellSellNeutralBuyStrong buy
Moving Averages
Neutral
SellBuy
Strong sellStrong buy
Strong sellSellNeutralBuyStrong buy
Moving Averages
Neutral
SellBuy
Strong sellStrong buy
Strong sellSellNeutralBuyStrong buy
Displays a symbol's price movements over previous years to identify recurring trends.
Curated watchlists where STXUSDT.P is featured.

Smart contracts: Make the smart decision
36 No. of Symbols
See all sparks