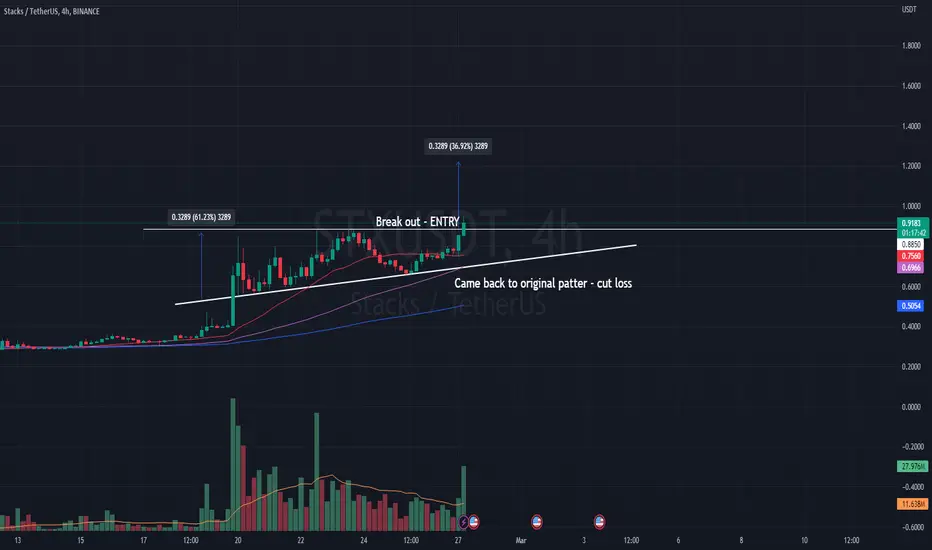
$STX - Bullish Pennant Breakout Entry$STX is in news after publication by LunarCrush. On Daily and Weekly it's showing a heavily bullish sign, this is 4h timeframe and it did a breakout from pennant which is ascending means forming HL but also LH.
I have kept two targets, first target is a resistance on Daily and second target is a Weekly resistance.
You can either enter if price comes back for a retest at breakout level or you can take entry at any level in between, but I technically believe that bullish momentum is strong and price might not come back for a retest.
Plan your trade and DYOR.
STXUSDT.P trade ideas

$STXUSDT PAIR, DEMAND ZONE BREAK DOWN, POTENTIAL SHORTING 10%SHORT AT LEAST 7-10% , broke down support with high volume, set cut loss above demand zone.

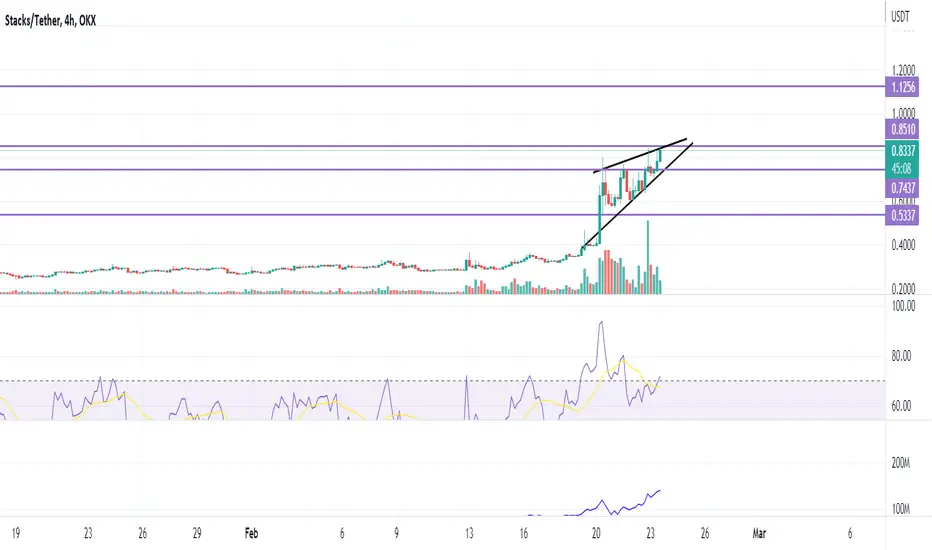
$STXUSDT, Ascending Triangle, bullish continuation patternAscending Triangle Break Out from pattern, expecting at least 15% gain.
STXIdea: The price is trying to break through a strong resistance level. The price is in the zone of the strongest overbought RSI on almost all timeframes. The price will fall to the nearest support of $0.5 in case of a correction. be careful

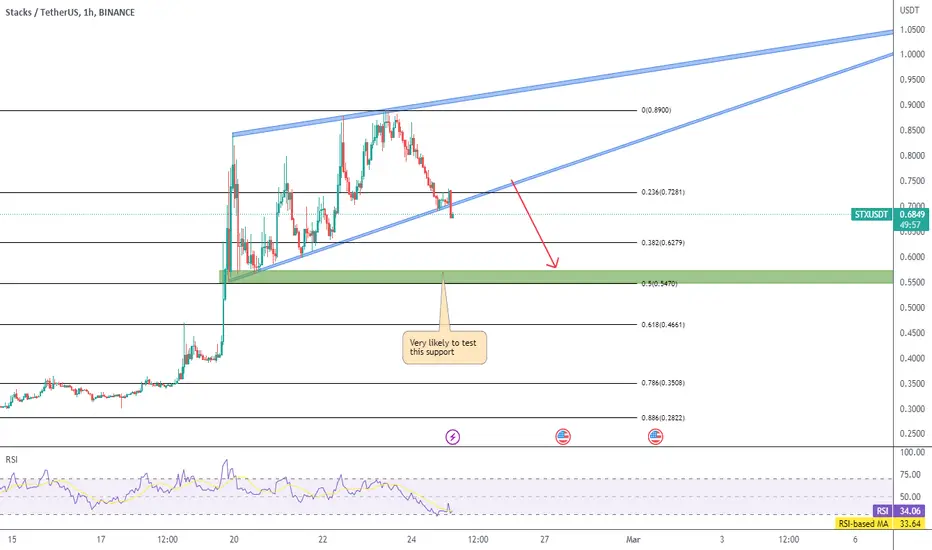
STX - Breaking down from wedgeSTX is breaking out to the downside from the rising wedge, which gives us a high probability that 0.55 support will be tested.
Note that we are also oversold on the H1 timeframe, so we could see some sideways consolidation before stronger moves down.
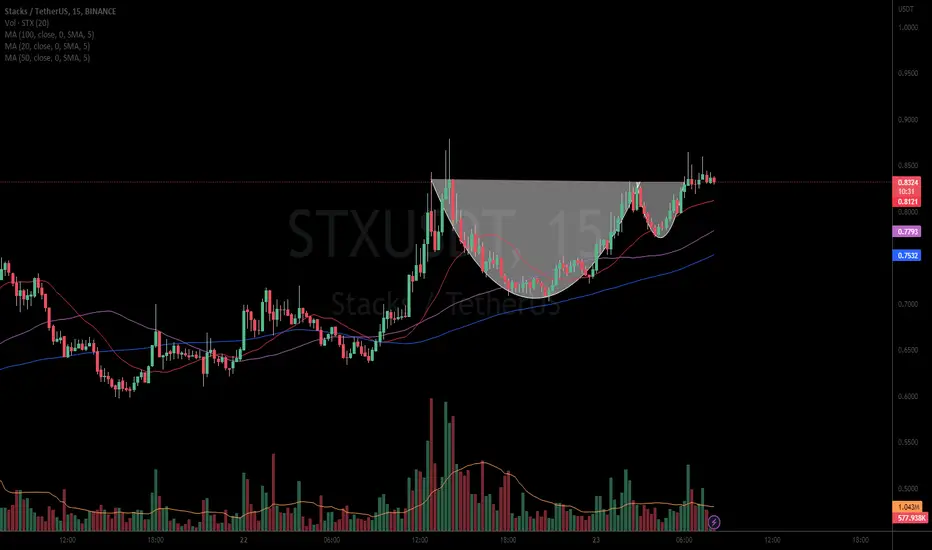
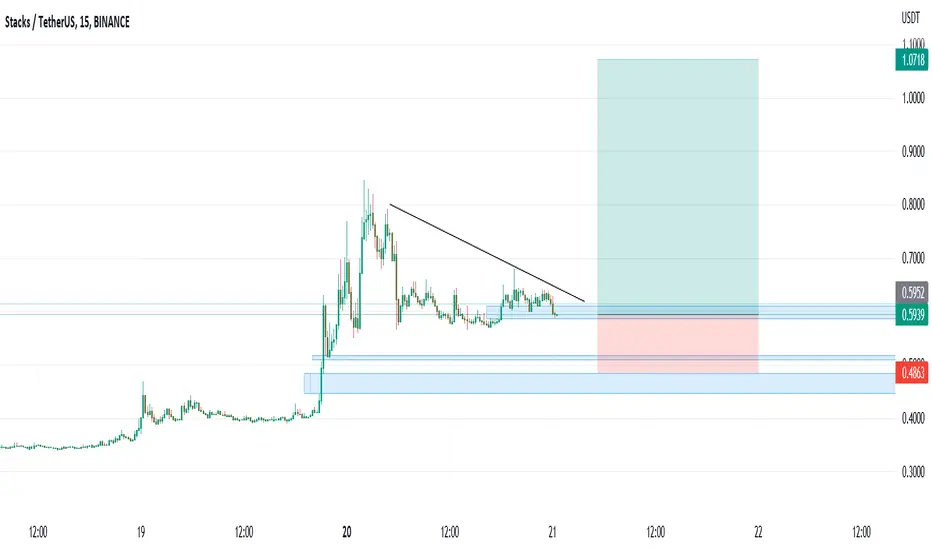
Cup and Handle on 15 and 30 minutes time frame of $STXBINANCE:STXUSDT Continuation up trend pattern, waiting for breaking out to confirm the continuation, can expect price up to or at least 0.87 to 0.99
STX/USDT headed to $1.00+ STX/USDT is headed to a psychological $1 (I think).
Note the Purple Candles by Sam indicator (purple candles). The indicator is here on TradingView.
Have a trailing take profit just before $1 - as it might run past that.
Squeeze indicator looking strong and DI/ADX is turning up.
STX LONG & HOLDSTX insight.
Stacks has shown a formidable growth in the last few weeks and the best approach at the moment would be to buy some of this coin at the pullback to the highlighted zone.
The possible targets of this move are highlighted by lines for you.
Just hold and rebuy.
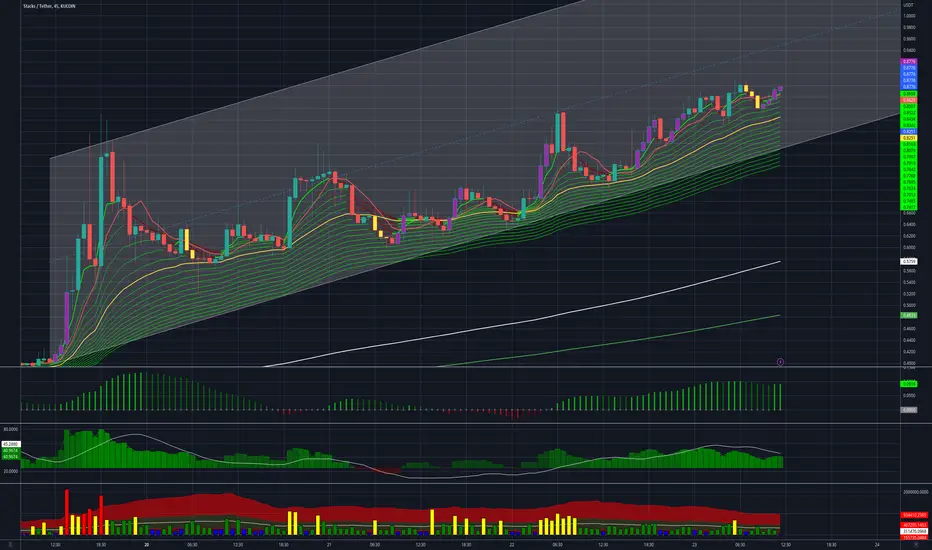
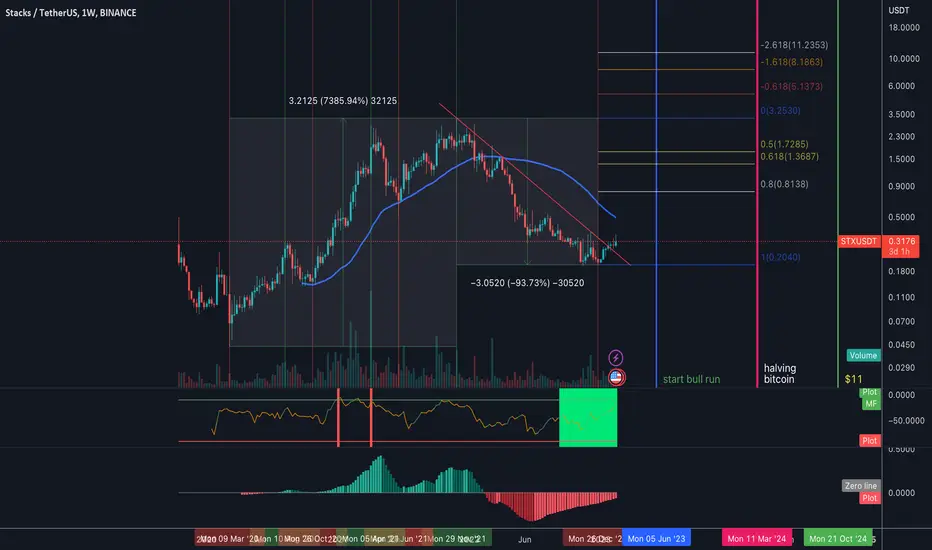
STXUSDT(Stacks) Daily tf Range Updated till 23-02-23STXUSDT(Stacks) Daily timeframe range. from its local low it retraced back to 320%+ thats actually quite insane. it needs little bit more volume to push toward 1.0276#. after that it got midrange which is 1.300#.but that depends how retail interest keeps up.

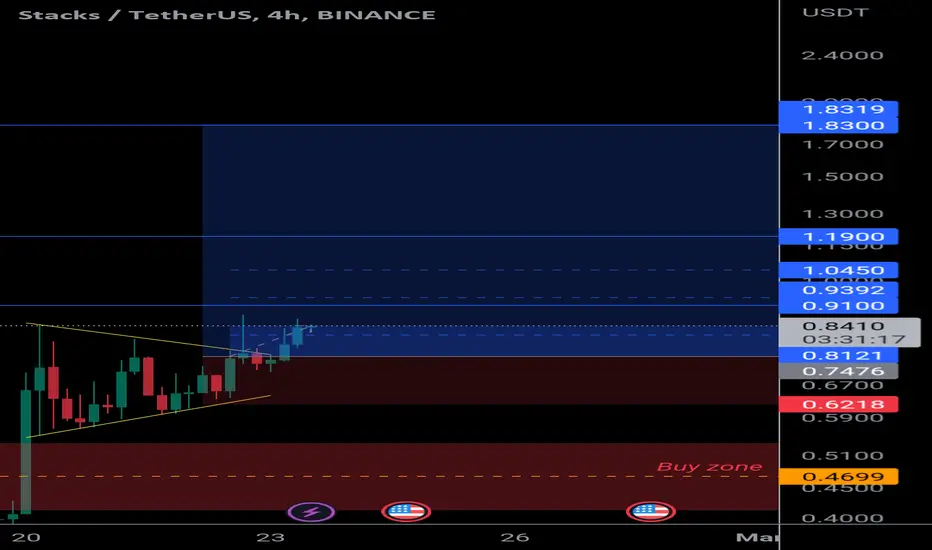
STXUSDT CHART- 23/2/23 WHERE TO TAKE PROFITWhere to enter and exit on stx trade
enter 0.835
stop loss 0.74
take profit 1.12
STX is at resistance again.Blockstack PBC, a software business that seeks to establish a decentralized internet, developed the cryptocurrency STX. The native coin of the Blockstack network, which employs a particular blockchain created to support safe, decentralized apps, is called STX.
The Blockstack ecosystem, which includes the Stacks blockchain and the decentralized apps developed on top of it, is powered by STX. STX is a key component of Blockstack's vision of a user-centric internet where people control their data and identities.
Within the Blockstack ecosystem, STX may be utilized for several things, including:
Using the Stacks blockchain and paying transaction costs
Participating in the Blockstack consensus method through stake
By rewarding users for contributing to the network and participating in governance procedures, the network can encourage developers to create new decentralized apps.
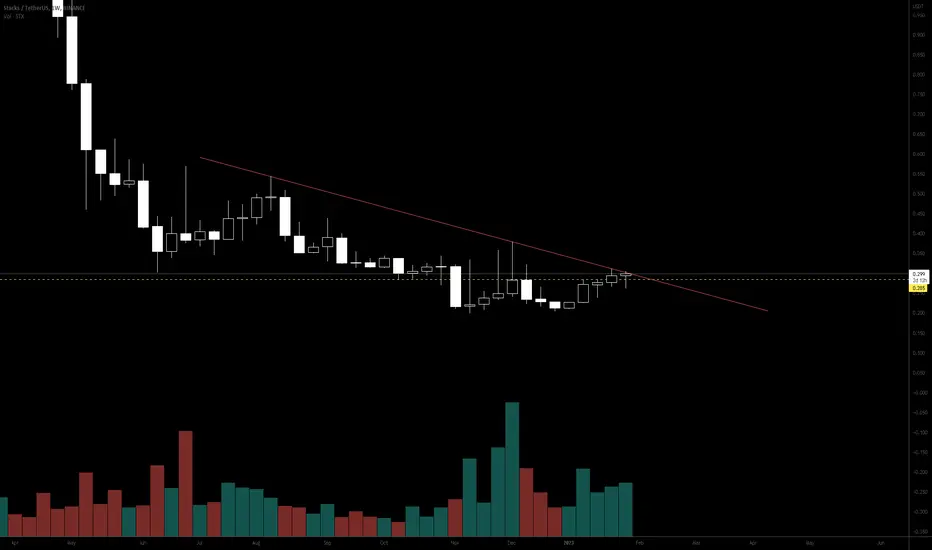
There are two support levels on the way down, and two resistance zones on the way up. One of the resistance levels is very strong and can push the price down for now.
Let me know if you guys have any questions;
I will be more than happy to help.
Good luck, and thank you.

STX looks bullishSTX looks to head higher as there was a lot of volume recently and the demand zones seems to hold and we can expect a reversal upwards.
20th Feb 2023 - Trade idea #4Daily trading ideas especially for altcoins. You can use your own trading analysis/strategy to see if one of the daily ideas suits you.

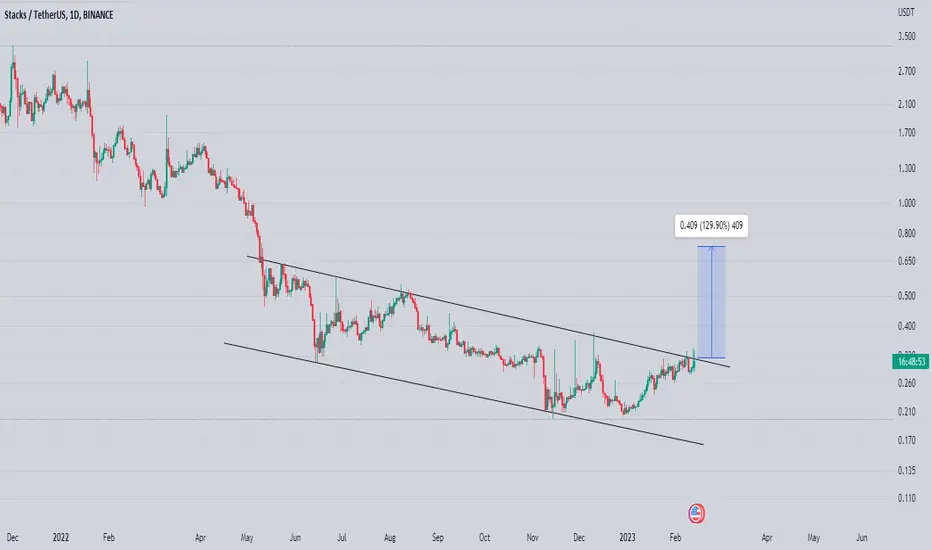
STX - weekly charthi.... Now trying to break the downtrend. Worth following. The weekly closing above the trend after the breakout makes it a good opportunity to enter.
Stx Trying Clear Another Resistance Stx Looking Good For Midterm & formed Descending Channel In daily Timeframe
Incase Of breakout Expecting 110 To 130% bulish Move Keep Your On stx for breakout
STXUSDT is preparing for an impulsive wave 3 It appears that STXUSDT is preparing for an impulsive wave 3. Support has been found at the 0.618 Fibonacci level, and by using Fibonacci extension, the following resistance points have been identified. Although it's just a possibility at this point, $STXUSDT could be quite intriguing.

STXUSDT Resistance Line Breakout!STXUSDT Technical analysis update
Buy zone: Below $0.330
Stop loss: $0.290
Take Profit 1 : $0.360
Take Profit 2 : $0.410
Take Profit 3 : $0.520
spot trade
Always keep stop loss
Thanks
Hexa
$STX/#USDT [#Stacks]: Resistance_Breakout_ConfirmationWe've detected a Resistance Breakout and Confirmation on the $STX / $USDT chart. The price has broken above a key resistance level and has been confirmed by a strong candle, indicating a potential bullish trend. The next resistance key levels are at 0.331 | 0.366 | 0.428 and the major support zones are respectively at 0.269 | 0.242 | 0.18. We may consider entering a trade at the current price zone at 0.3222 and targetting higher levels.
Technical Metrics :
Current price: 0.3222
24H Volume: 7,358,644.3417 ₮
24H Price change: 10.912%
- Pivot Points - Levels :
Resistance: 0.331 | 0.366 | 0.428
Support: 0.269 | 0.242 | 0.18
Indicators recommandation :
Oscillators: BUY
Moving Averages: STRONG_BUY
Technical Indicators Summary : STRONG_BUY
- In-depth STXUSDT technical analysis on > Tradingview TA page
What do you think of this analysis? Share your insights and let's discuss in the comments below. Your like, follow and support would be greatly appreciated!
Welcome to the home of charting big: TradingView
Benefit from a ton of financial analysis features, instruments and data. Have a look around, and if you do choose to go with an upgraded plan, you'll get up to $30.
Discover it here

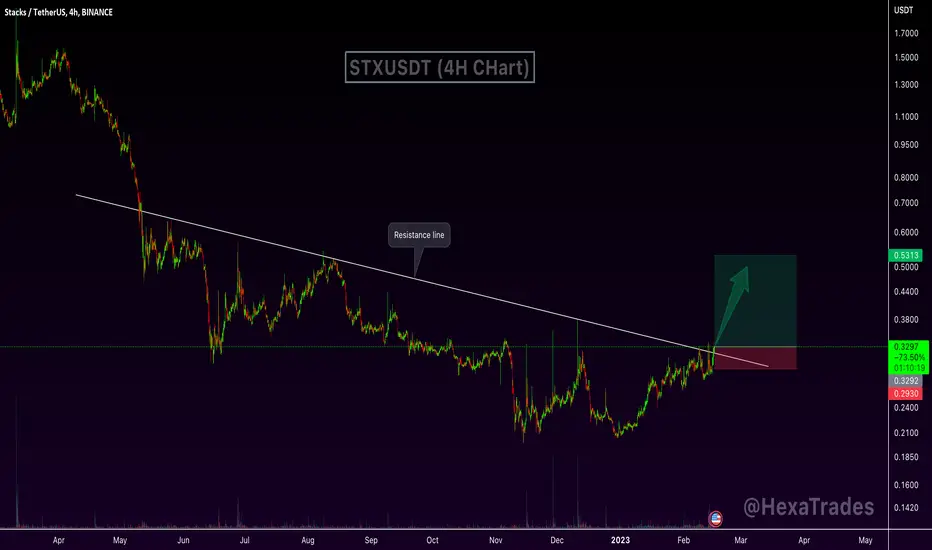
STXUSDT| BREAKOUT..STX trading in a bearish trend .
The price has been trading under the falling resistance since a long time.
Now the price has broken above the falling resistance.
We have an excellent upside targets as price has printed bullish candles.
Manage your levels accordingly. e.


STX/USDT | Pretty Solid Breakout..!!
#STX Falling Wedge Breakout has Confirmed in the Daily TF Chart..!!
Looks Promising for the Midterm Hold..
Expecting +200-250% Bullish Wave in the Midterm So Keep it under the Radar.
Please like the idea for Support & Subscribe for More ideas like this and share your ideas and charts in Comments Section..!!
Thanks for Your Love & Support..!!
