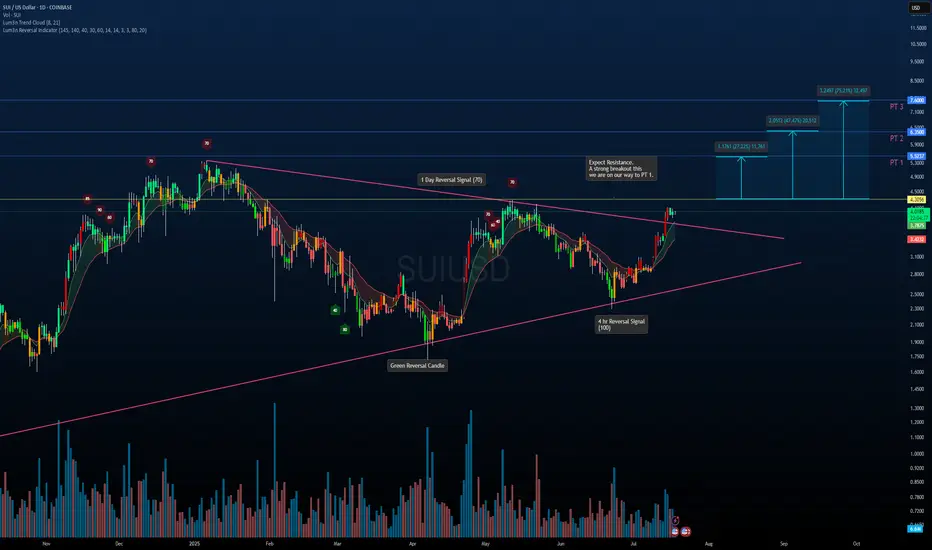
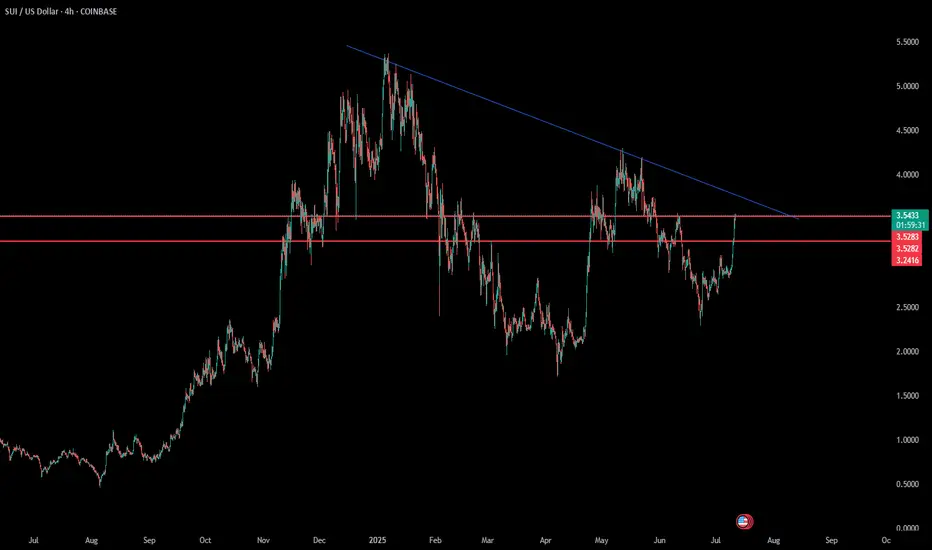
SUI/USDT – Symmetrical Triangle Breakout in PlaySUI has officially broken out of a multi-month symmetrical triangle on strong momentum. This structure has been building since early 2024 and now looks ready for continuation.
Key Notes:
Breakout confirmed above trendline resistance with strong volume.
Reversal signals on the 1D and 4H timeframes a
Trading activity
Transactions 12.29 K
BuysSells
6.28 K6.01 K
Volume 4.42 MUSD
Buys volumeSells volume
2.16 M2.26 M
Traders 1.6 K
BuyersSellers
808796
About SUIAUSD_B30DF4.USD
Related DEX pairs
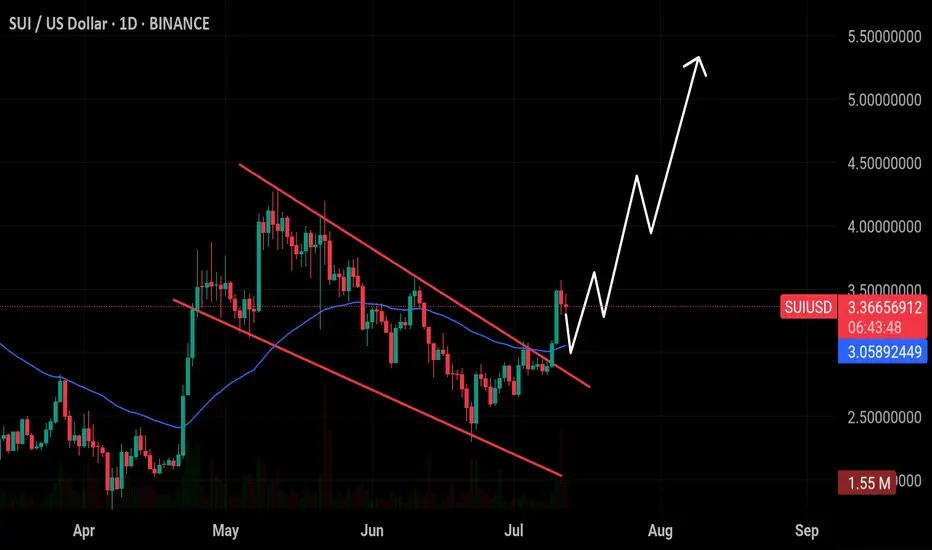
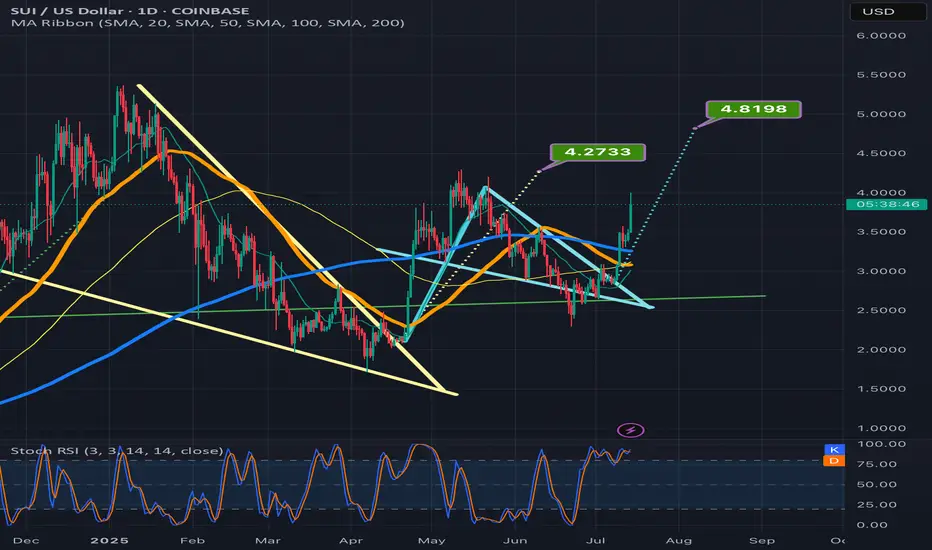
$SUI/USDT Breakout Analysis 1D Chart: SUI has broken out$SUI/USDT Breakout Analysis 1D Chart:
SUI has broken out of a clear falling wedge pattern on the daily timeframe — a bullish reversal structure. This breakout is significant, especially with strong volume confirmation and price now trading above both the wedge and the 50 EMA.
🔸 Support $3.05:
The
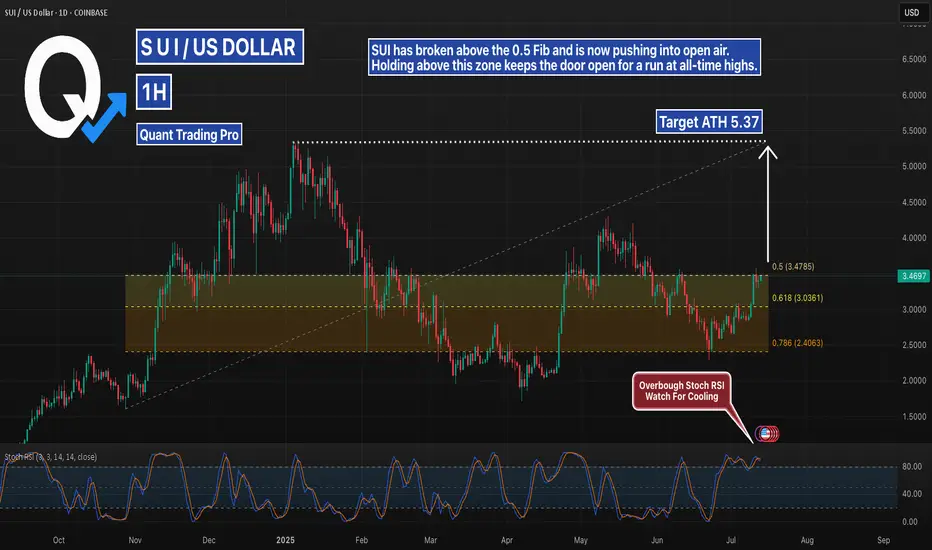
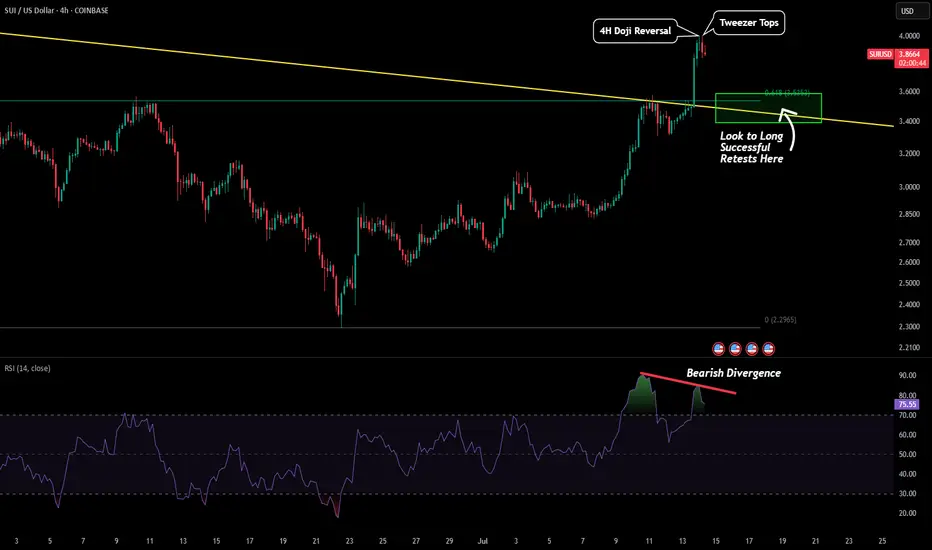
SUI Holding Breakout – Is the ATH Next?SUI is breaking above the 0.5 retracement level after a strong reversal from the golden pocket. With price now in a clean range toward all-time highs, continuation depends on whether bulls can defend the $3.45+ area.
Momentum is high, but Stoch RSI is overbought — stay alert for either a breakout p
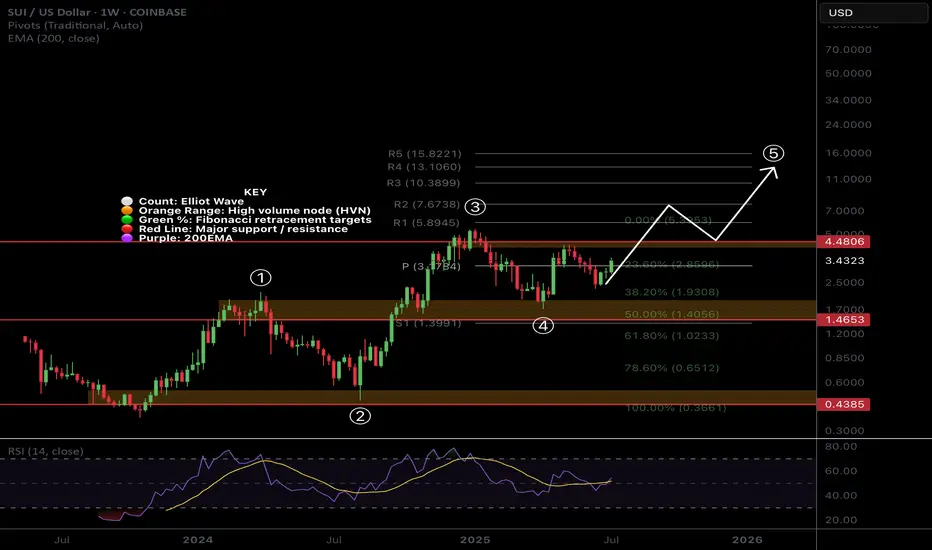
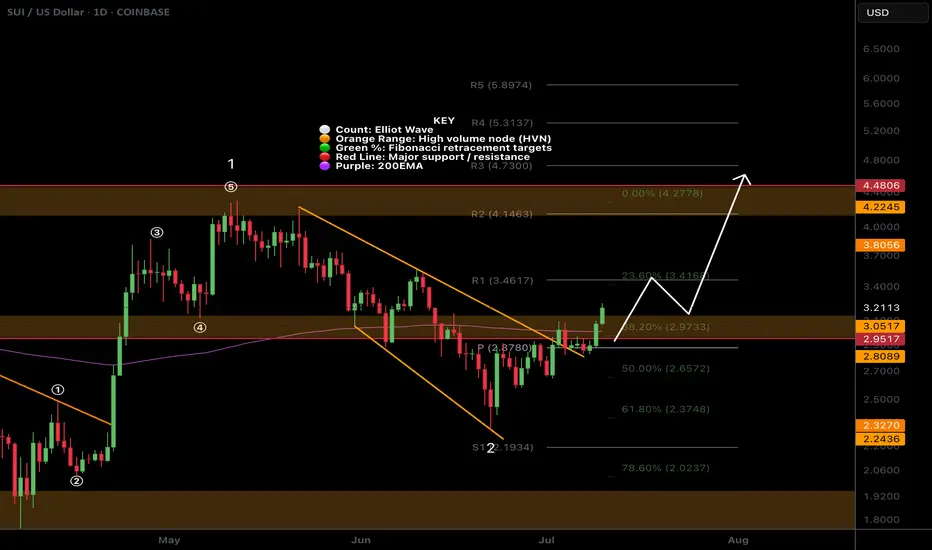
$SUI Wave 3 to Continue with a Strong Weekly CloseCRYPTOCAP:SUI printed a great weekly candle that will be closing today above the weekly pivot point with RSI trying to flip bullishly.
Price found support at 0.5 Fibonacci retracement and High Volume Node.
Wave 4 penetrated wave 1 which we potentially have a ending or leading diagonal Elliot Wave
SUI - 4H Potential ReversalRight now the market is extremely hot as BTC is skyrocketing to the upside. However we are beginning to reach levels where a short term pullback could be on the table to flush out overleverage. Therefore, if a pullback does occur then these are the levels to watch.
For SUI we are seeing very early
SUIUSD – Calm Before ContinuationSUI made an explosive move from $3.25 to $4.20+ in two days. After peaking, it's consolidating in a tight bull flag around $4.00–$4.07. Momentum is cooling slightly, but the uptrend remains intact. Clear breakout trigger sits at $4.10+ for new highs.
The new solana, monster pump comingThe new solana imo, red lines are my buy zones and it will skyrocket once this trendline breaks to the upside. Only about 12B market cap now!
SUI on its way to the teal pennants breakout targetSui has joined the bullishness here as it has brown up from the pennant and well on its way to the target. *not financial advice*
SUI long 34% short 88%I think we need to see these moves first before we will have the extreme big wave to the upside. Just opened a long position. Then looking to short

$SUI Big Breakout Happening?CRYPTOCAP:SUI is smashing above triple resistance: a major High Volume Node , daily 200EMA and the daily pivot. The signal I posted in my trading signals Substack is now live, and the HBAR one is about to hit take profit 1.
Target for this rally remains $4.2 High Volume Node near the swing high.
See all ideas
Summarizing what the indicators are suggesting.
Oscillators
Neutral
SellBuy
Strong sellStrong buy
Strong sellSellNeutralBuyStrong buy
Oscillators
Neutral
SellBuy
Strong sellStrong buy
Strong sellSellNeutralBuyStrong buy
Summary
Neutral
SellBuy
Strong sellStrong buy
Strong sellSellNeutralBuyStrong buy
Summary
Neutral
SellBuy
Strong sellStrong buy
Strong sellSellNeutralBuyStrong buy
Summary
Neutral
SellBuy
Strong sellStrong buy
Strong sellSellNeutralBuyStrong buy
Moving Averages
Neutral
SellBuy
Strong sellStrong buy
Strong sellSellNeutralBuyStrong buy
Moving Averages
Neutral
SellBuy
Strong sellStrong buy
Strong sellSellNeutralBuyStrong buy