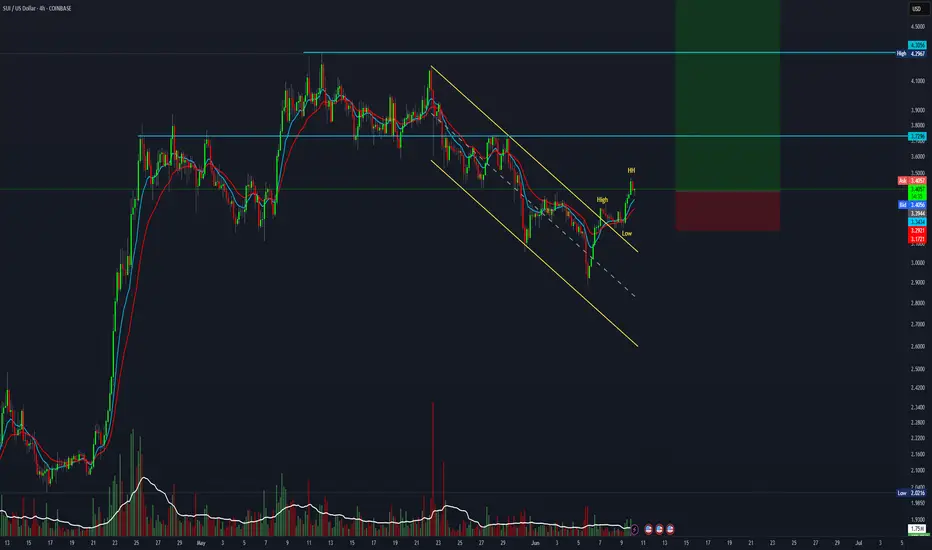
SUI long 34% short 88%I think we need to see these moves first before we will have the extreme big wave to the upside. Just opened a long position. Then looking to short
SUIUSDC_15DBCA.USD trade ideas

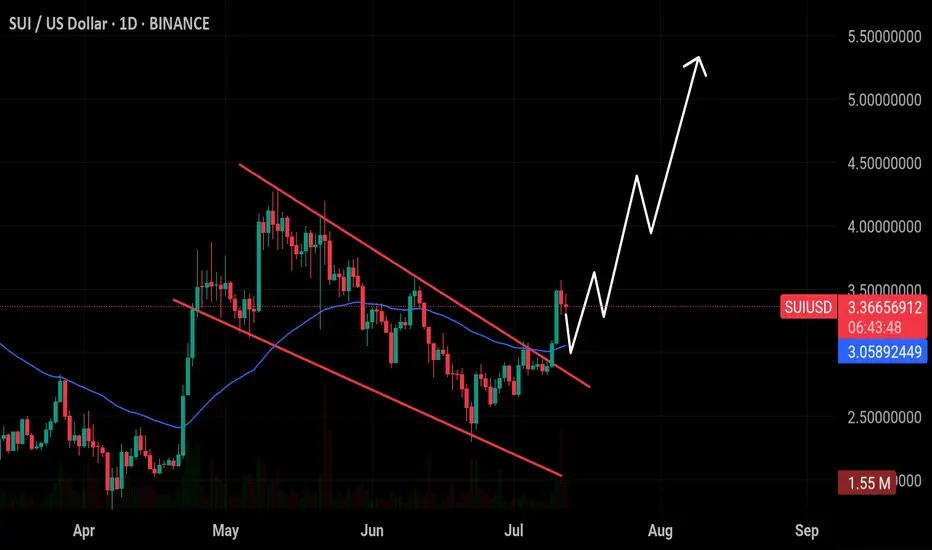
$SUI/USDT Breakout Analysis 1D Chart: SUI has broken out$SUI/USDT Breakout Analysis 1D Chart:
SUI has broken out of a clear falling wedge pattern on the daily timeframe — a bullish reversal structure. This breakout is significant, especially with strong volume confirmation and price now trading above both the wedge and the 50 EMA.
🔸 Support $3.05:
The 50 EMA aligns closely with the $3.05 level, now acting as a solid support. Retesting this area successfully would validate the breakout further.
🔸 Upside Target: $5.5
The projected move based on the wedge's height suggests a run toward the $5.0–$5.5 zone, especially if bulls maintain control.
🔸 Risk Level at $2.80:
A daily close back below the wedge and 50 EMA would invalidate the bullish breakout and suggest caution
🔸 Watch for a potential retest of $3.05–$3.20. If this zone holds, it could be a strong entry area with upside potential toward $4.0, $4.7, and $5.5 in the coming weeks.
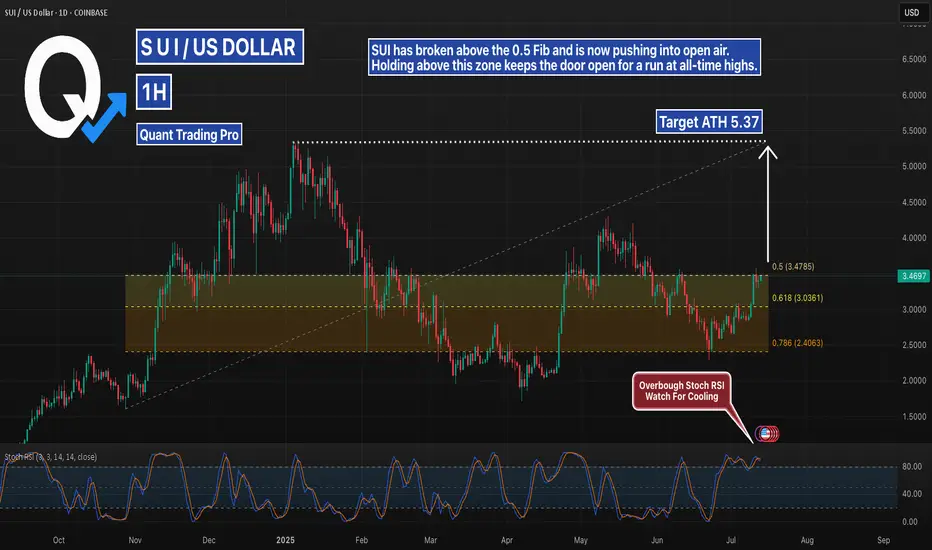
SUI Holding Breakout – Is the ATH Next?SUI is breaking above the 0.5 retracement level after a strong reversal from the golden pocket. With price now in a clean range toward all-time highs, continuation depends on whether bulls can defend the $3.45+ area.
Momentum is high, but Stoch RSI is overbought — stay alert for either a breakout push or short-term cooldown.
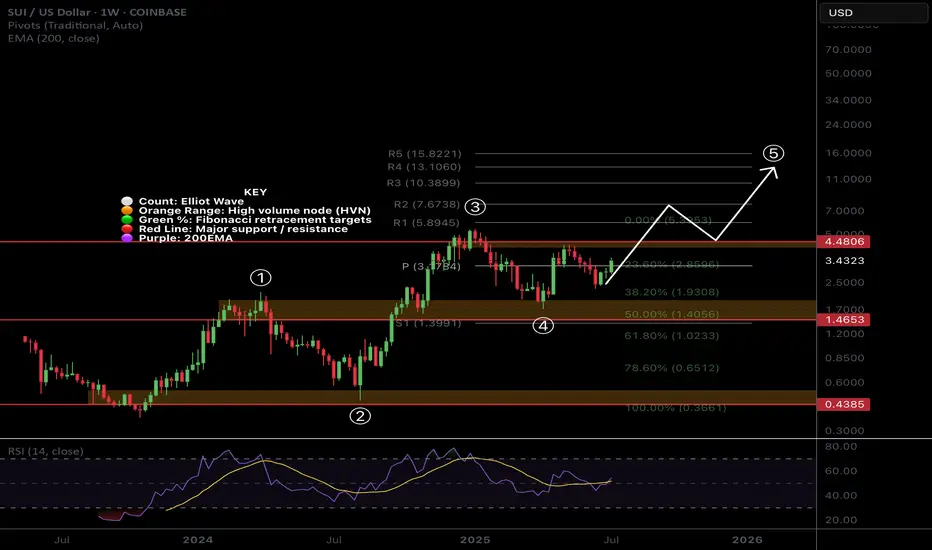
$SUI Wave 3 to Continue with a Strong Weekly CloseCRYPTOCAP:SUI printed a great weekly candle that will be closing today above the weekly pivot point with RSI trying to flip bullishly.
Price found support at 0.5 Fibonacci retracement and High Volume Node.
Wave 4 penetrated wave 1 which we potentially have a ending or leading diagonal Elliot Wave count limiting the potential upside with my current terminal target being around $10-13. Wave 4 could also actually be another wave 2 which would give us ridiculous targets but this is my preferred count for now.
Safe trading
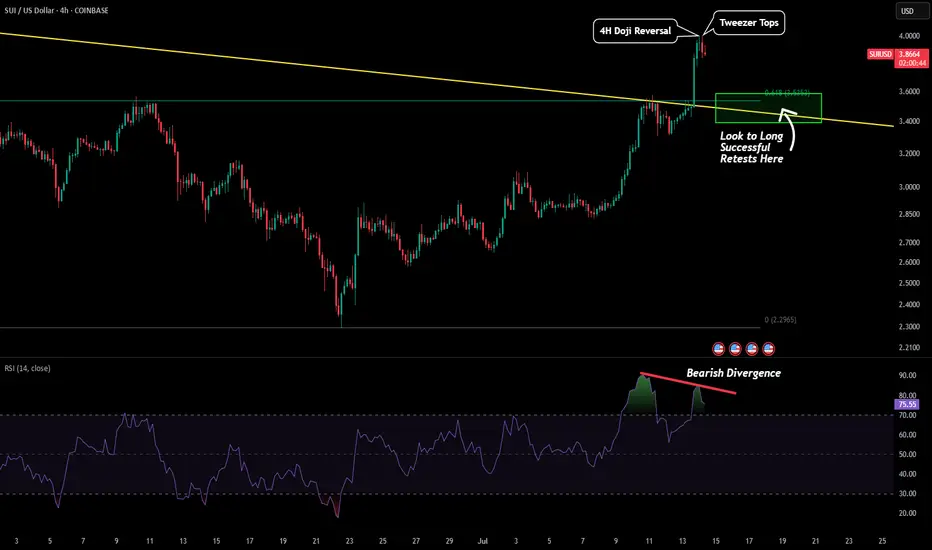
SUI - 4H Potential ReversalRight now the market is extremely hot as BTC is skyrocketing to the upside. However we are beginning to reach levels where a short term pullback could be on the table to flush out overleverage. Therefore, if a pullback does occur then these are the levels to watch.
For SUI we are seeing very early signs of a short term reversal occurring.
The first bearish signal was a 4H reversal doji followed by tweezer tops right at the psychological $4 level.
In addition to this we are seeing early signs of a bearish divergence forming. Higher high in price, lower low on our RSI. Showing that some strength of this rally might be fading.
If this reversal does occur then the $3.40-$3.60 level would be the first level to watch for bulls to hold. This could be a great level to long from in accordance to BTC maintain strength. Will also post the SUI daily chart that has confluence with this prediction as well.
However if BTC continue to reach for high and SUI reverses this bearish signal then $4.60 would be the next level followed by a test of its previous ATH.
The new solana, monster pump comingThe new solana imo, red lines are my buy zones and it will skyrocket once this trendline breaks to the upside. Only about 12B market cap now!
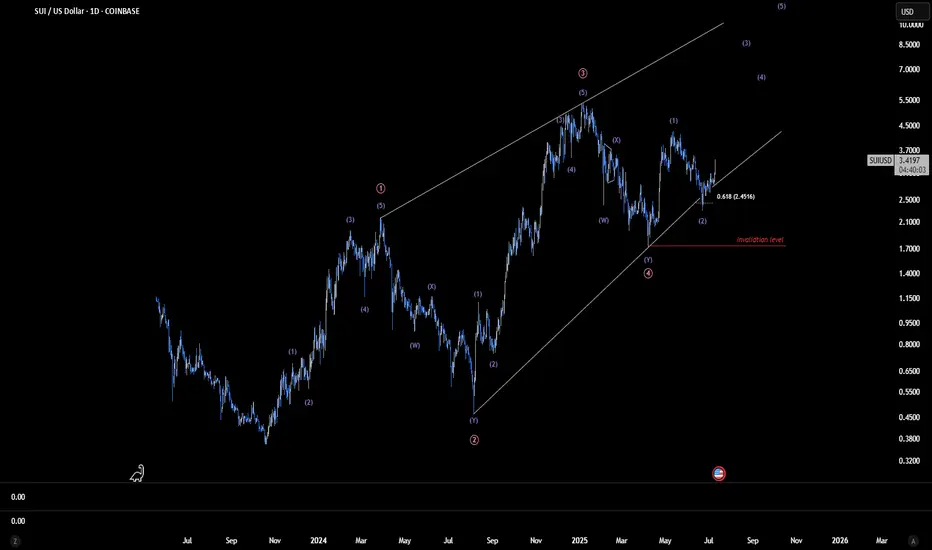
SUI - Leading Diagonal Macro Count Analysis
From an Elliott Wave standpoint, the structure appears highly promising. The current formation allows for two plausible interpretations: either the early stages of a strong impulsive wave, or a more measured diagonal unfolding at the cycle degree. A break below the red level would decisively invalidate this count
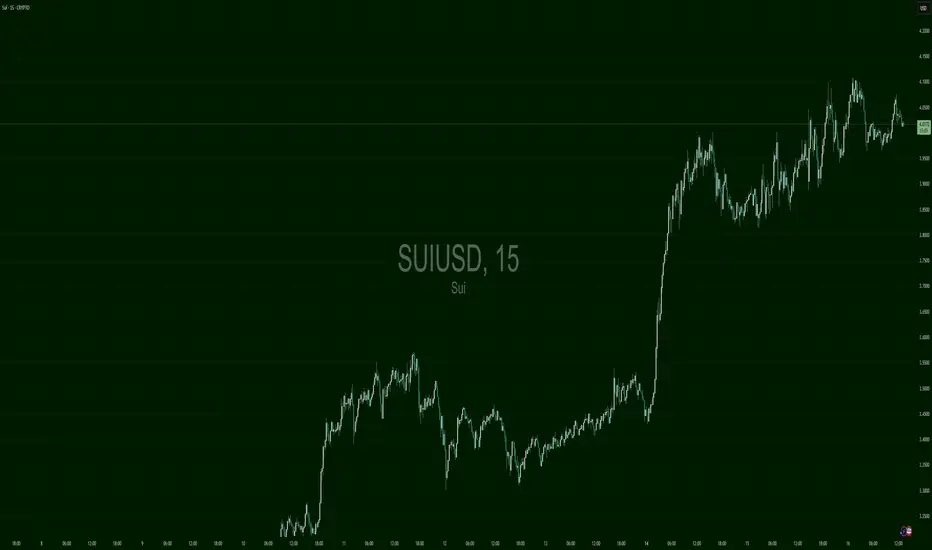
SUIUSD – Calm Before ContinuationSUI made an explosive move from $3.25 to $4.20+ in two days. After peaking, it's consolidating in a tight bull flag around $4.00–$4.07. Momentum is cooling slightly, but the uptrend remains intact. Clear breakout trigger sits at $4.10+ for new highs.
SUI on its way to the teal pennants breakout targetSui has joined the bullishness here as it has brown up from the pennant and well on its way to the target. *not financial advice*
$SUI Big Breakout Happening?CRYPTOCAP:SUI is smashing above triple resistance: a major High Volume Node , daily 200EMA and the daily pivot. The signal I posted in my trading signals Substack is now live, and the HBAR one is about to hit take profit 1.
Target for this rally remains $4.2 High Volume Node near the swing high.
Analysis is invalidated below the daily pivot at $2.8
Safe trading
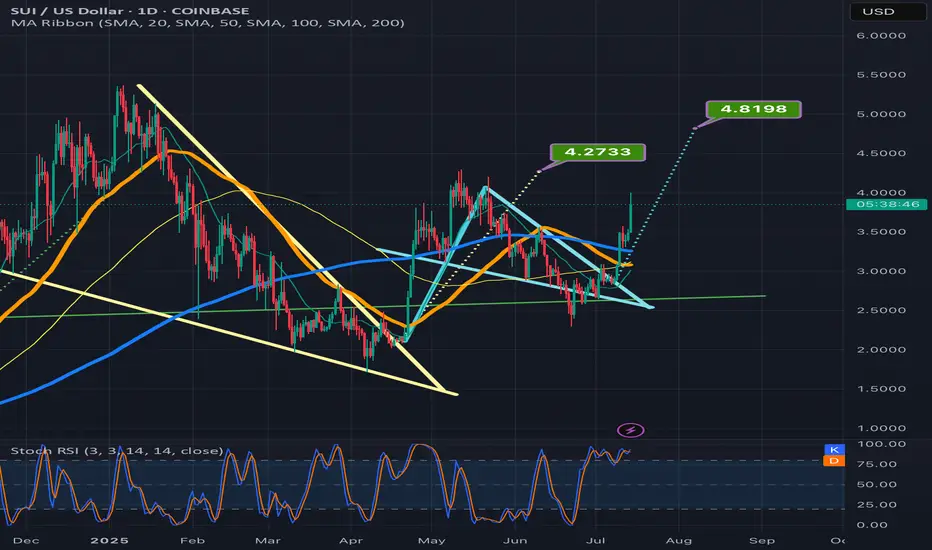
SUI Next Upside Target🚀 After holding above the April low and completing a 3-wave pullback in wave (2), CRYPTO:SUIUSD is now advancing in a potential wave (3).
Momentum is building, and the next upside target lies in the equal legs zone at $4.80 – $5.40, which could eventually lead to a new all-time high.
$SUI Gearing Up to Break Triple Resistance?CRYPTOCAP:SUI is consolidating under resistance which often leads to a breakthrough but can take some time.
Price is sat above the daily pivot after breaking the downward trend resistance, but still under the daily 200 EMA and High Volume Node resistance. A pop above $3.09 swing high would be a bullish signal to long towards a first target of $4.2 High Volume Node.
Analysis is invalidated with a move below $2.7, leaving heavy resistance still ahead.
Safe trading
SUIUSD – Coiling After ChaosSUI broke out impulsively into $3.13 then dumped into $2.72. Since then, price has stabilized and gone flat between $2.90 and $2.94, coiling tightly for two days. Breakouts above $2.95–$2.97 may trigger upside, while $2.88 is now a soft floor. Structure is balanced — breakout pending.
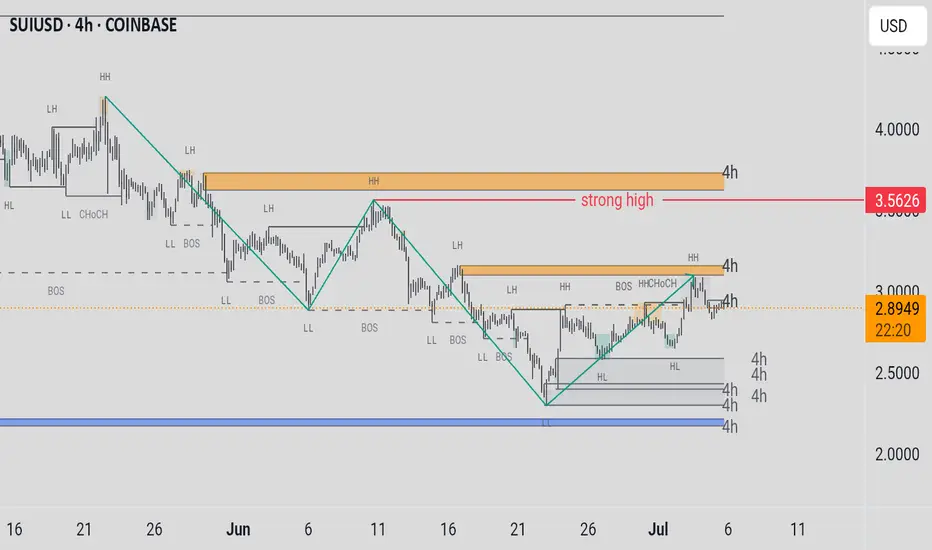
SUIUSDTPrice Levels: The current price is around 2.445 USD. A "strong high" resistance is marked at 3.5626 USD, with a higher high (HH) near 3.8917 USD.Support and Resistance:Support zones include 2.8917 USD, 2.445 USD (HL), and a lower support around 2.500 USD.Resistance is strong near 3.5626 USD, with potential resistance up to 4.000 USD.Trends: The chart shows a downtrend with lower lows (LL) and lower highs (LH) until recently, where a break of structure (BOS) and higher high (HH) suggest a potential reversal or consolidation. The price is currently testing the 2.445 USD support.Patterns: Annotations like "CHOCH" (Change of Character) and "BOS" indicate shifts in market structure, hinting at possible bullish momentum if support holds.
potential to short selling:
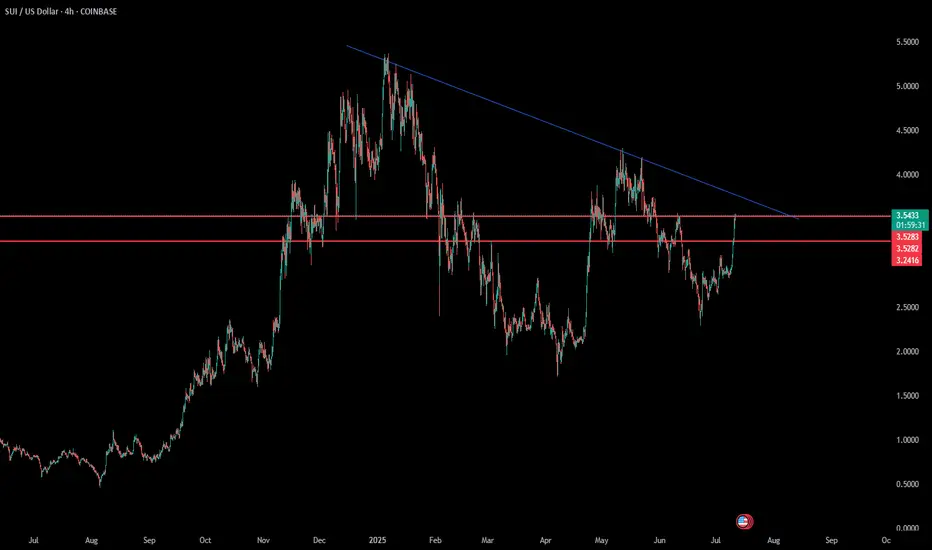
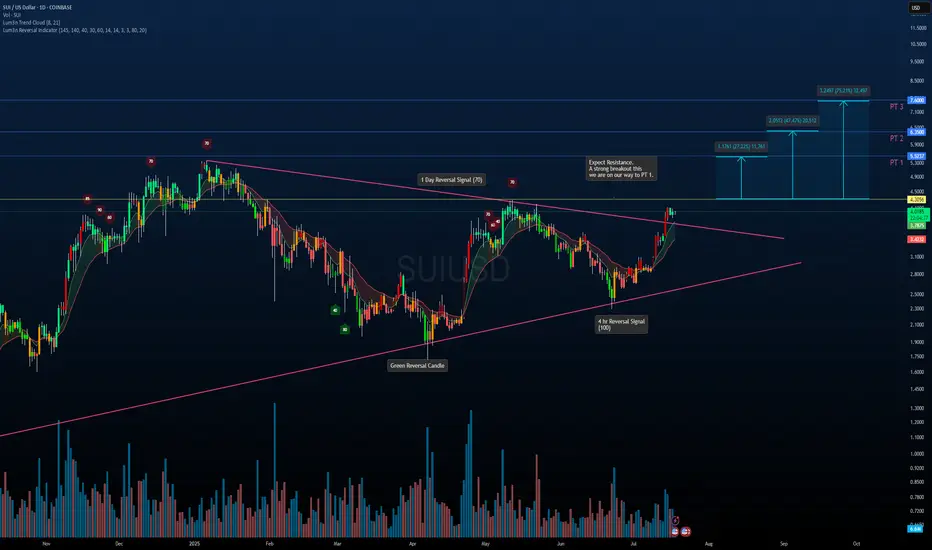
SUI/USDT – Symmetrical Triangle Breakout in PlaySUI has officially broken out of a multi-month symmetrical triangle on strong momentum. This structure has been building since early 2024 and now looks ready for continuation.
Key Notes:
Breakout confirmed above trendline resistance with strong volume.
Reversal signals on the 1D and 4H timeframes aligned before the move.
Pullback toward the breakout zone is possible before continuation.
Upside Fibonacci-Based Targets:
PT1: $5.32 (+27%)
PT2: $6.53 (+47%)
PT3: $7.60 (+75%)
If the breakout holds and momentum continues, these levels offer a solid roadmap for potential long-term gains. Watching how price reacts around the $4.30 resistance will be key.
Not Financial Advice – For educational purposes only.
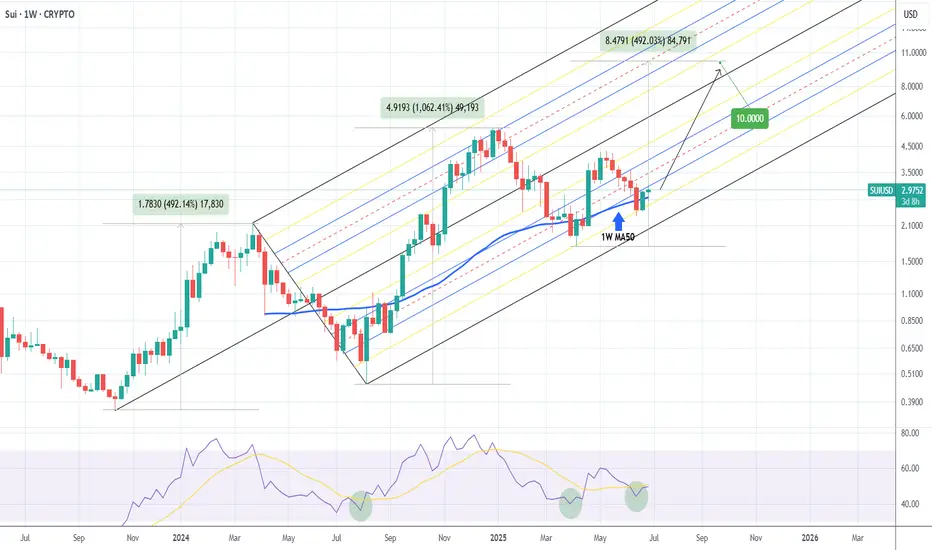
SUI Historic Pitchfork targets $10 at least!Sui (SUIUSD) has been staging a bounce attempt on its 1W MA50 (blue trend-line) since last week and if the current 1W candle closes in green, it will be the first 2-week green streak of Sui since March 24.
There are high probabilities of a sustainable rebound here, that may very well turn into a strong parabolic rally, similar to those of August - December 2024 and October 2023 - March 2024.
The reason is that the price hit and is staging this rebound attempt on the 0.786 level of the Pitchfork, which is where it started the April 07 2025 rally.
If we repeat the 'shortest' of those parabolic rallies (+492.14%), then we should hit $10.00 at least, which will also test the 0.236 level of the Pitchfork.
-------------------------------------------------------------------------------
** Please LIKE 👍, FOLLOW ✅, SHARE 🙌 and COMMENT ✍ if you enjoy this idea! Also share your ideas and charts in the comments section below! This is best way to keep it relevant, support us, keep the content here free and allow the idea to reach as many people as possible. **
-------------------------------------------------------------------------------
💸💸💸💸💸💸
👇 👇 👇 👇 👇 👇
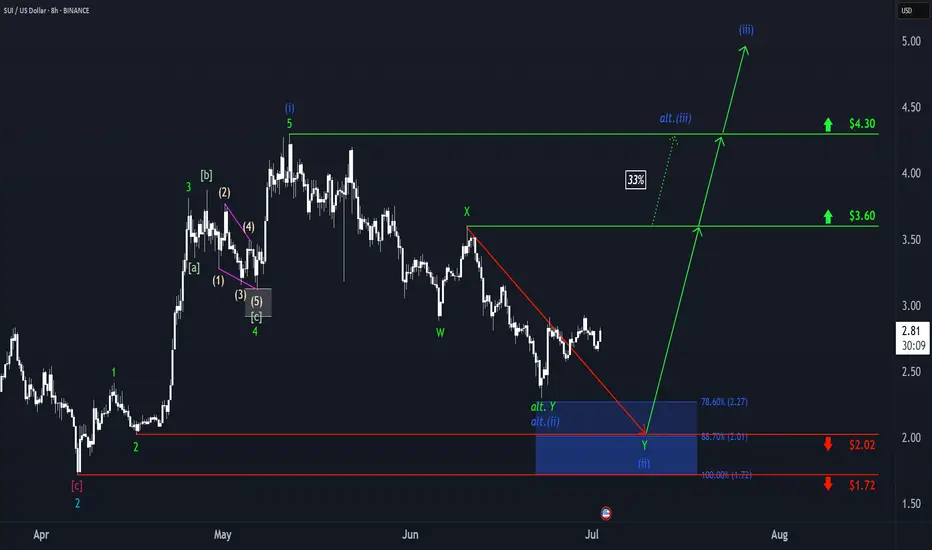
SUI: Closing in on the Target Zone?SUI should continue closing in on our blue Target Zone between $2.27 and $1.72. We expect blue wave (ii) to complete there, ideally above support at $2.02, before the next move higher kicks off in wave (iii). However, because the June 22 low came within just $0.03 of our zone, we must consider the possibility that blue wave alt.(ii) has already concluded. In that case, a direct breakout above resistance at $3.60 could follow (33% probability).
📈 Over 190 precise analyses, clear entry points, and defined Target Zones - that's what we do.
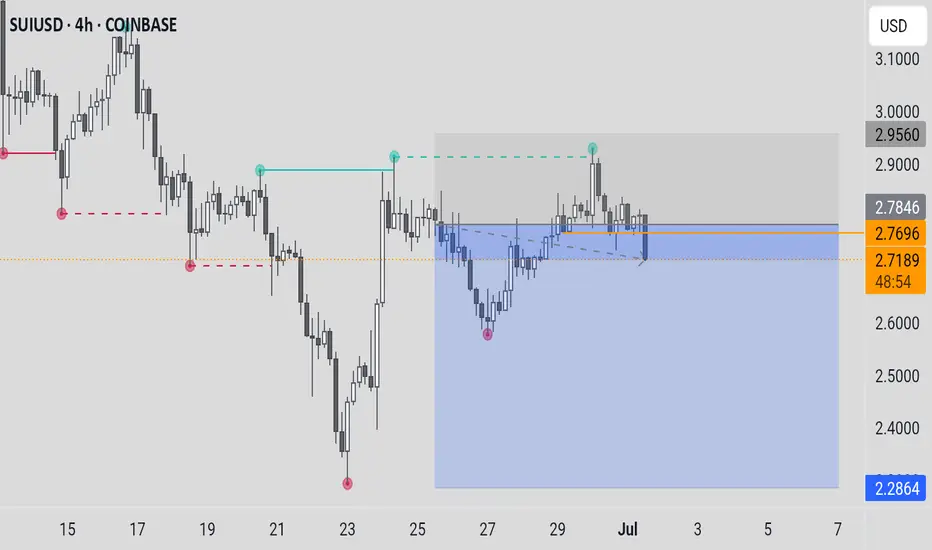
SUIUSD – Broken Wedge, Not Yet Broken OutSUI printed a breakout wick above $2.87, then retraced hard through support and consolidated in a falling wedge near $2.68. A minor breakout from that wedge has begun, with early signs of strength as price climbs into $2.74. Bulls need a break of $2.78–$2.80 to confirm trend reversal. For now, it's a fragile recovery.

SUIUSDTCryptocurrency Futures Market Disclaimer 🚨🚨🚨
Trading cryptocurrency futures involves high risks and is not suitable for all investors.
Cryptocurrency prices are highly volatile, which can lead to significant gains or losses in a short period.
Before engaging in crypto futures trading, consider your risk tolerance, experience, and financial situation.
Risk of Loss: You may lose more than your initial capital due to the leveraged nature of futures. You are fully responsible for any losses incurred.
Market Volatility: Crypto prices can fluctuate significantly due to factors such as market sentiment, regulations, or unforeseen events.
Leverage Risk: The use of leverage can amplify profits but also increases the risk of total loss.
Regulatory Uncertainty: Regulations related to cryptocurrencies vary by jurisdiction and may change, affecting the value or legality of trading.
Technical Risks: Platform disruptions, hacking, or technical issues may result in losses.
This information is not financial, investment, or trading advice. Consult a professional financial advisor before making decisions. We are not liable for any losses or damages arising from cryptocurrency futures trading.
Note: Ensure compliance with local regulations regarding cryptocurrency trading in your region.
thanks for like and follow @ydnldn
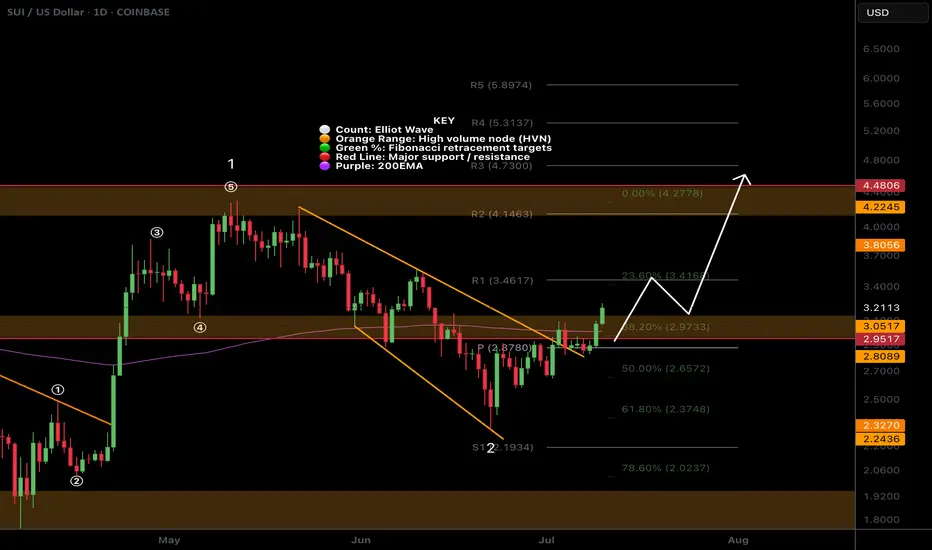
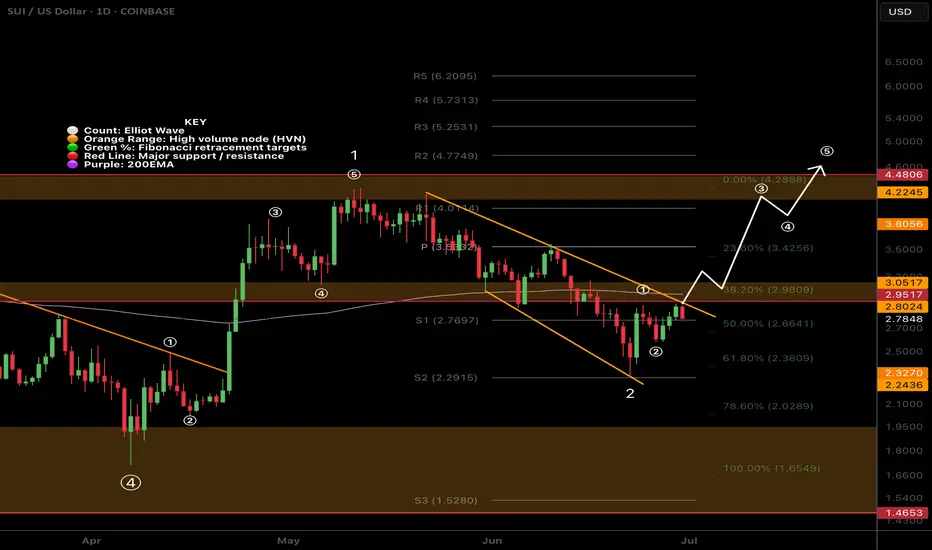
SUI Wave 3 of 3 Started?SUI appears to have completed a local wave (2) at the .618 Fibonacci retracement and a larger degree wave 2 at the alt-coin golden pocket between .618-.782
Triple resistance looms ahead of the daily 200EMA, major resistance High Volume Node and descending resistance trend line.
A breakthrough and close above will be a bullish sign with an initial target of the December swing high range $4.48
Analysis is invalidated below the $2.5 swing low, locking in ABC correction instead.
The bullish case is in jeopardy below $2.29 swing low.
Safe trading
SUI Swing Trade Setup Targeting 2R Risk-RewardSUI Likely to Close Daily Above $4.12 — Setting Up for Next Leg Toward All-Time High of $5.40
SUI is showing strong momentum and is likely to close the daily candle above $4.12, potentially setting up for the next leg up toward its all-time high at $5.40.
This swing trade setup offers a 2:1 risk-to-reward ratio:
Entry: $4.15
Stop Loss: $3.56
Target: $5.40
This analysis is for educational purposes only. Always manage risk appropriately — consider risking no more than 1% of your portfolio.

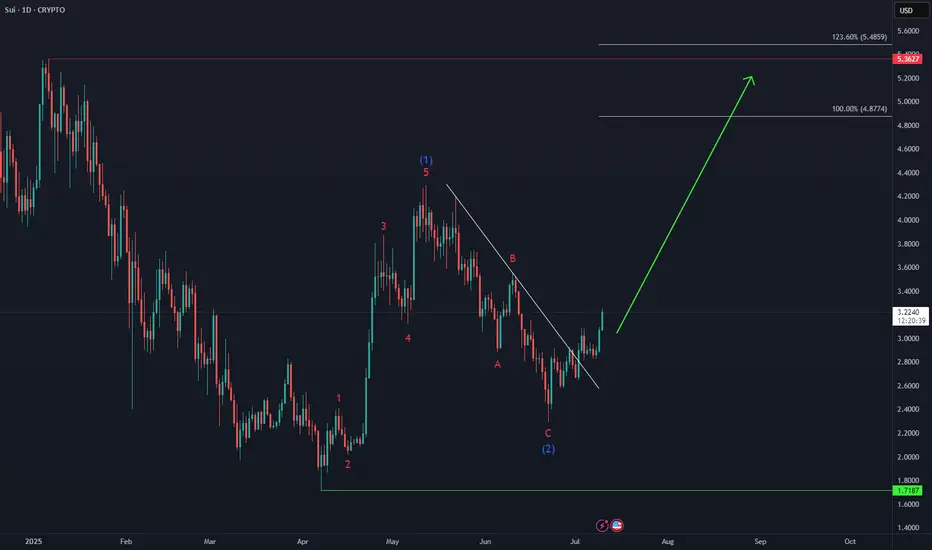
Trade setup for SUI 20 R:R. Now or never!!!BTC and ETH are already showing signs of reversal. Do you believe a bull run is coming? This might be a good setup before the market takes off. Risk-to-reward ratio of 20:1 — extremely risky but potentially very rewarding. Only two resistance levels left before reaching the all-time high (ATH).
Entry: 3.3944
Stop-loss: 3.1721
Target: 8.0000
This is for educational purposes only
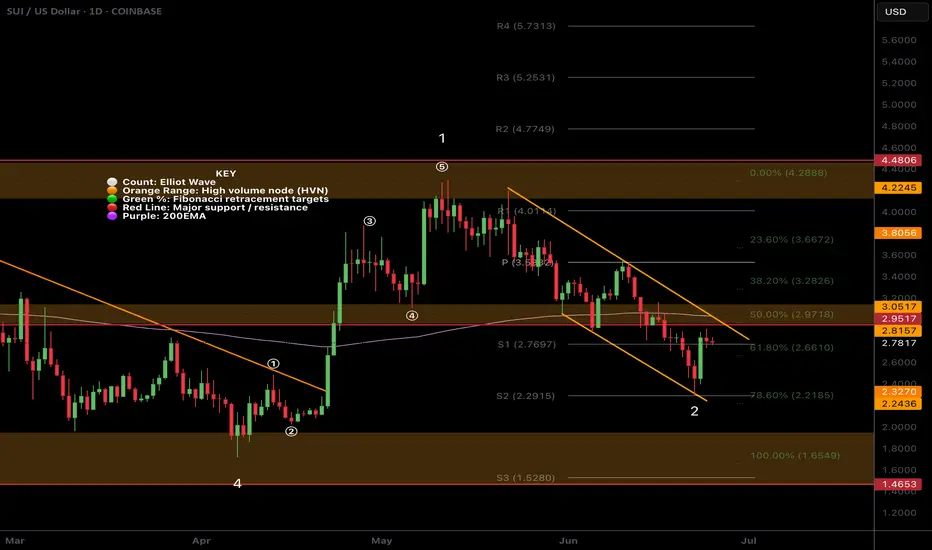
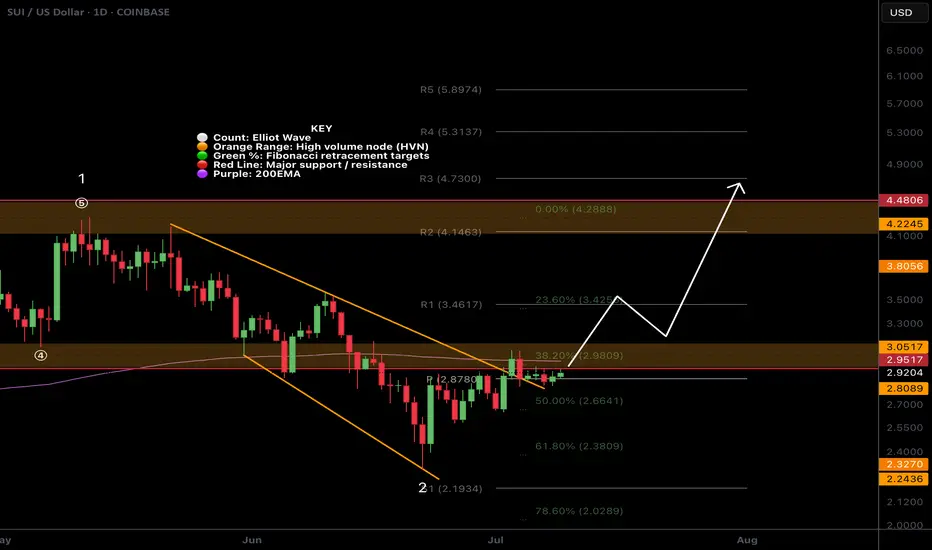
SUI Wave 2 Complete?CRYPTOCAP:SUI appears to have completed a wave 2 pullback at the 'alt-coin' golden pocket Fibonacci retracement 0.786.
Price tested the S2 daily pivot as support, which adds confluence to the .786 Fib. A bullish engulfing candle followed, negating the previous 3 days price action but price still has to overcome resistance.
A sustained breakout above the descending orange trend line and major resistance will be a queue to go long.
Analysis is invalidated below $2.28.
Safe trading