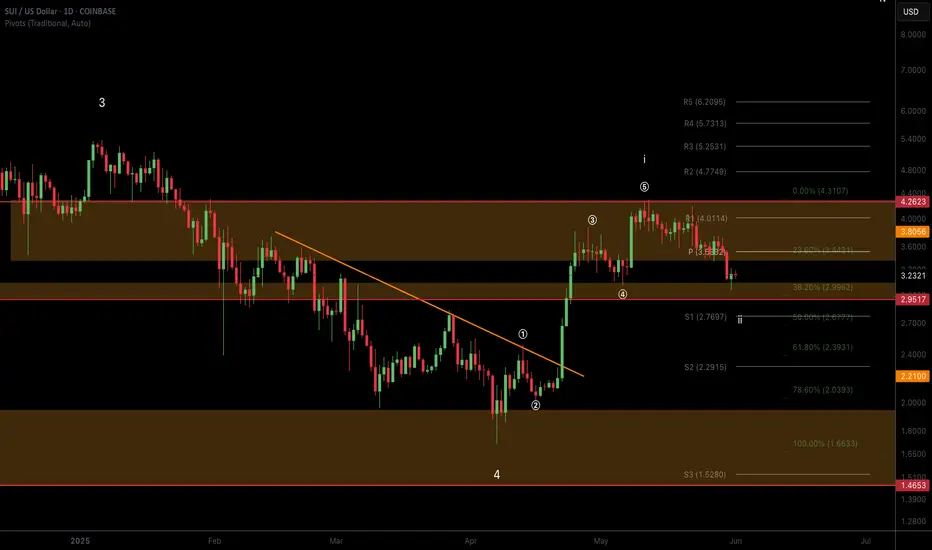
Trade setup for SUI 20 R:R. Now or never!!!BTC and ETH are already showing signs of reversal. Do you believe a bull run is coming? This might be a good setup before the market takes off. Risk-to-reward ratio of 20:1 — extremely risky but potentially very rewarding. Only two resistance levels left before reaching the all-time high (ATH).
Entry: 3.3944
Stop-loss: 3.1721
Target: 8.0000
This is for educational purposes only
SUIUSDC_77F786.USD trade ideas
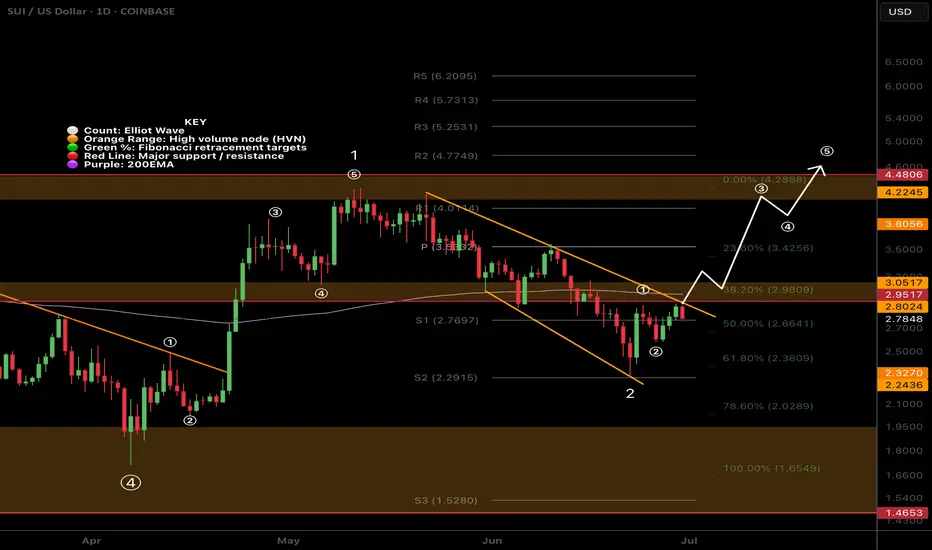
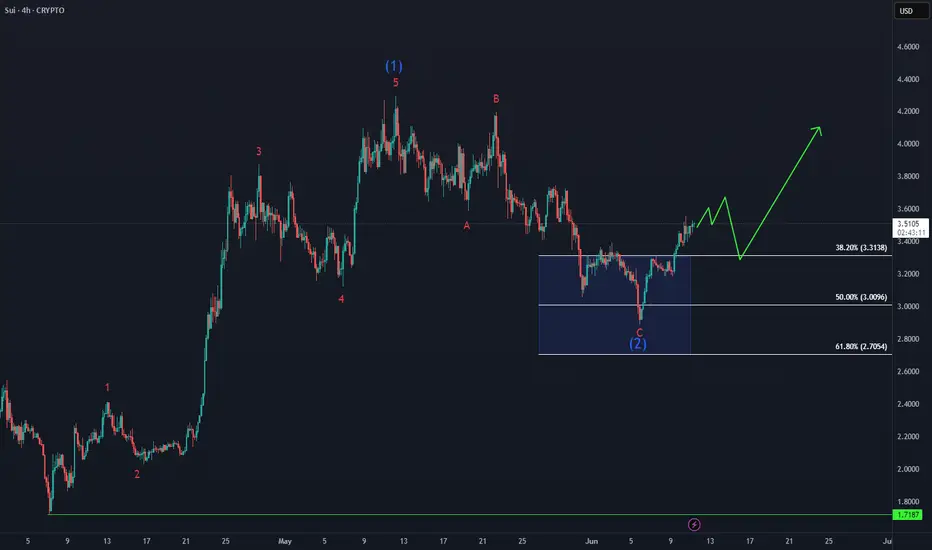
SUI Wave 3 of 3 Started?SUI appears to have completed a local wave (2) at the .618 Fibonacci retracement and a larger degree wave 2 at the alt-coin golden pocket between .618-.782
Triple resistance looms ahead of the daily 200EMA, major resistance High Volume Node and descending resistance trend line.
A breakthrough and close above will be a bullish sign with an initial target of the December swing high range $4.48
Analysis is invalidated below the $2.5 swing low, locking in ABC correction instead.
The bullish case is in jeopardy below $2.29 swing low.
Safe trading
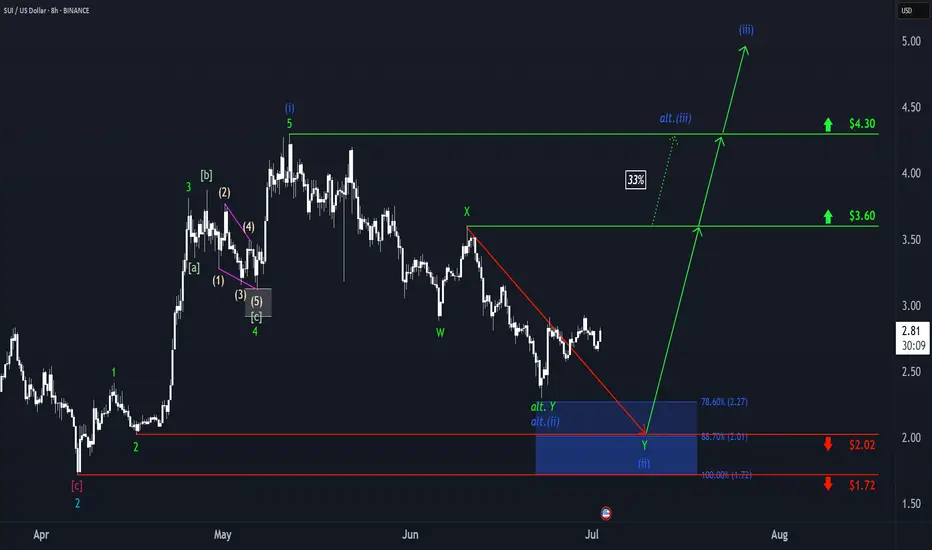
SUI: Closing in on the Target Zone?SUI should continue closing in on our blue Target Zone between $2.27 and $1.72. We expect blue wave (ii) to complete there, ideally above support at $2.02, before the next move higher kicks off in wave (iii). However, because the June 22 low came within just $0.03 of our zone, we must consider the possibility that blue wave alt.(ii) has already concluded. In that case, a direct breakout above resistance at $3.60 could follow (33% probability).
📈 Over 190 precise analyses, clear entry points, and defined Target Zones - that's what we do.
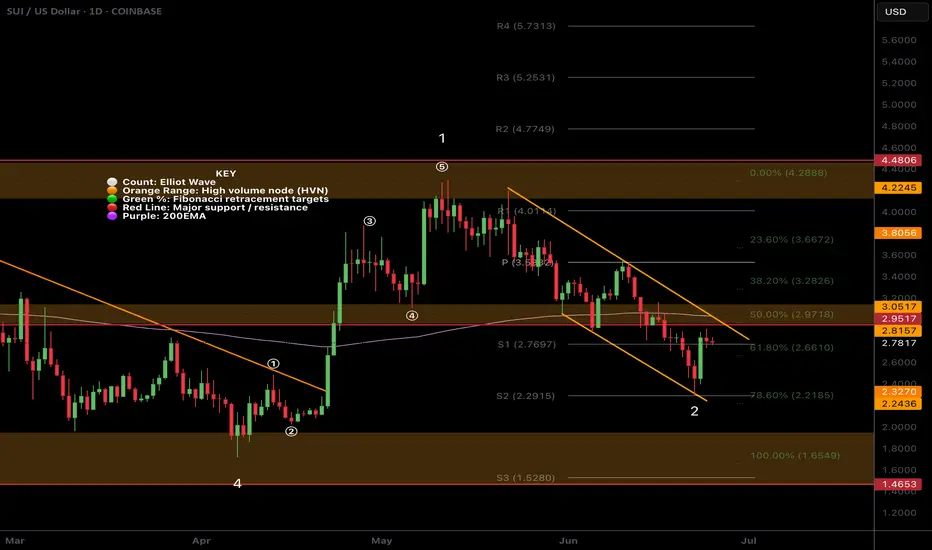
SUI Wave 2 Complete?CRYPTOCAP:SUI appears to have completed a wave 2 pullback at the 'alt-coin' golden pocket Fibonacci retracement 0.786.
Price tested the S2 daily pivot as support, which adds confluence to the .786 Fib. A bullish engulfing candle followed, negating the previous 3 days price action but price still has to overcome resistance.
A sustained breakout above the descending orange trend line and major resistance will be a queue to go long.
Analysis is invalidated below $2.28.
Safe trading
SUI Swing Trade Setup Targeting 2R Risk-RewardSUI Likely to Close Daily Above $4.12 — Setting Up for Next Leg Toward All-Time High of $5.40
SUI is showing strong momentum and is likely to close the daily candle above $4.12, potentially setting up for the next leg up toward its all-time high at $5.40.
This swing trade setup offers a 2:1 risk-to-reward ratio:
Entry: $4.15
Stop Loss: $3.56
Target: $5.40
This analysis is for educational purposes only. Always manage risk appropriately — consider risking no more than 1% of your portfolio.

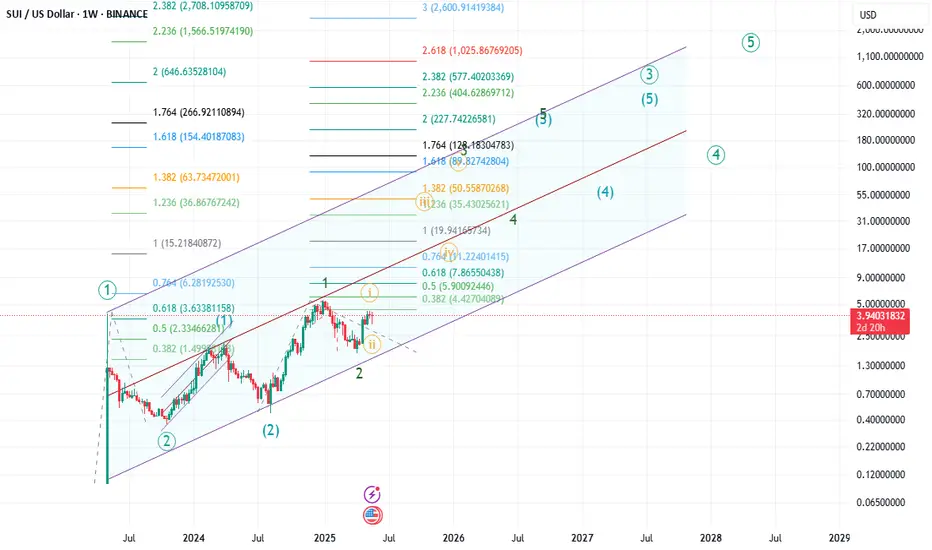
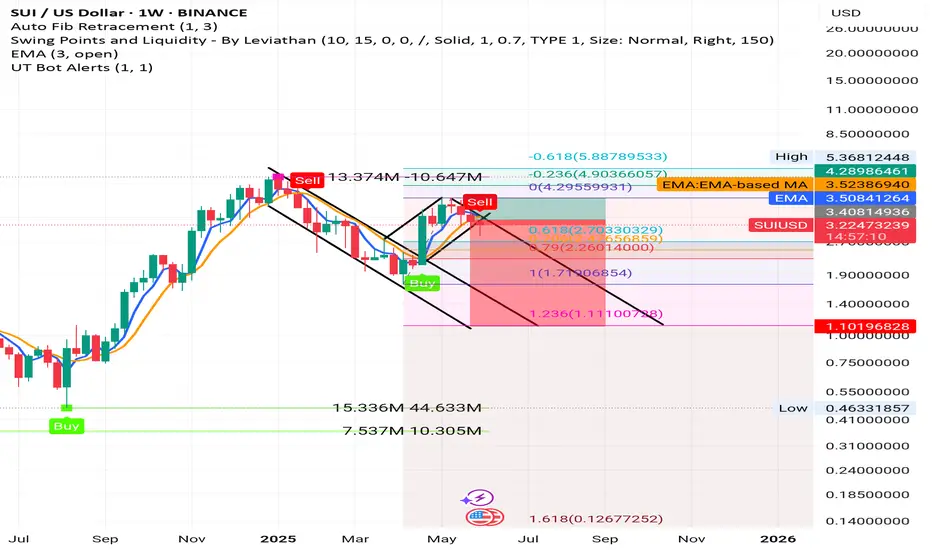
SUI/USD Weekly Analysis: Price Trend Through TrendlineSUI/USD Weekly Analysis: Price Trend Through Trendline, Fibonacci, and Market Behavior
This article analyzes the price behavior of the SUI token against the US Dollar (USD) on a weekly chart using key technical tools such as trendlines, Fibonacci retracement/extension, moving averages (EMA), and momentum indicators like Stochastic RSI and traditional RSI. These tools help interpret the market structure, identify key support/resistance levels, and assess potential price direction in the medium to long term.
1. Overall Chart Structure and Initial Outlook
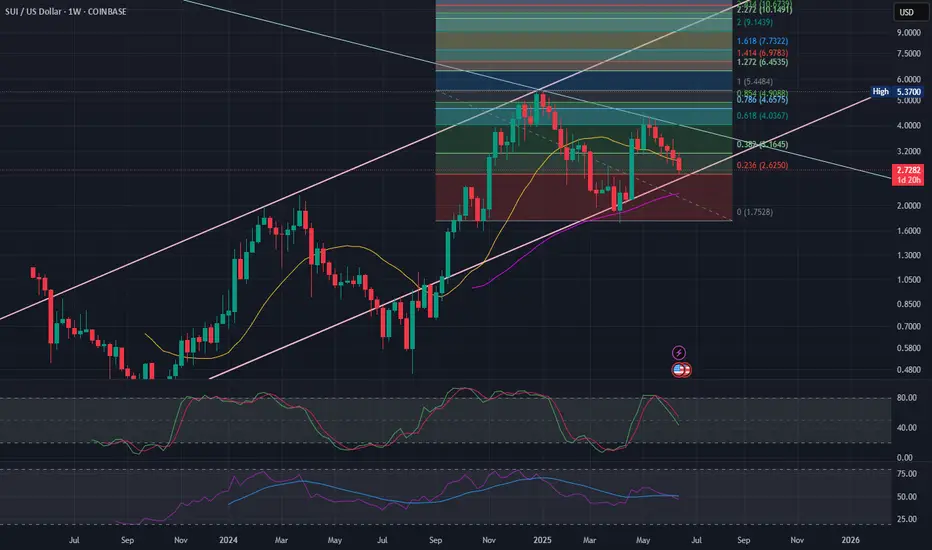
SUI has shown a clear uptrend pattern since late 2023 after reaching a low around $0.58–$0.60. It then rebounded and entered an ascending channel that significantly influenced the 2024 bullish trend. However, by mid-2025, price action reveals that SUI is encountering resistance at key Fibonacci levels and has started pulling back.
Key technical elements in the chart include:
Ascending channel (pink lines)
Descending trendline (white/gray), representing medium-term resistance
Fibonacci levels measured from the $1.75 low to the $5.37 high
EMA indicators
Momentum indicators such as Stochastic RSI and RSI
2. Interpretation of Trendlines
Ascending Channel (Pink):
This channel began in Q4 2023 and reflects a pattern of higher highs and higher lows. The lower boundary has acted as dynamic support multiple times, especially between late 2023 and early 2024.
Recently, the price has fallen from the upper half of the channel and is now moving near its midline. If the lower boundary holds, the uptrend could continue. However, a breakdown below this level may indicate the start of a structural weakening.
Descending Trendline (White):
This line connects lower highs, reflecting continued selling pressure. It intersects with horizontal resistance at approximately $3.64 (Fib 0.382), forming a strong confluence zone. For a bullish reversal, price must break above this level decisively.
3. Fibonacci Analysis
The Fibonacci retracement is drawn from the $1.75 low to the $5.37 high to determine major support and resistance levels.
Fibonacci Level
Price
Interpretation
0.236
≈ $2.62
Current support, some buying interest present
0.382
≈ $3.64
Strong resistance, overlapping descending trendline
0.618
≈ $4.03
Major resistance from the prior rally
0.786–0.854
≈ $4.63–$4.98
Last resistance band before retesting previous high
1.0
≈ $5.37
Peak of this cycle
1.272 / 1.618 / 2.0
$6.45 / $7.73 / $9.14
Long-term targets if price breaks the high
2.272
≈ $10.14
Ultimate extension target in strong uptrend
Currently, the price is near the 0.236 level, a preliminary support zone. A drop below $2.62 may prompt a test of $2.00–$2.20 or even $1.75. Conversely, a decisive breakout above $3.64 may restore upward momentum.
4. Moving Averages and Dynamic Support
Key EMA lines in the chart:
10-week EMA (Yellow): Starting to slope downward, signaling weakening short-term momentum and acting as resistance.
50-week EMA (Purple): Still trending upward, providing strong medium-term support. Staying above this level keeps the long-term structure intact.
5. Momentum Indicator Analysis
Stochastic RSI:
Declining from the overbought zone → Indicates a short-term consolidation or pullback.
Traditional RSI:
Still above 50 but flattening → Suggests fading momentum and reduced buying strength compared to previous phases.
Overall, these signals point to a likely short-term pause or sideways movement before the next major move.
6. Possible Trend Scenarios and Strategies
Bullish Case:
Condition: Price holds above $2.62 and breaks above $3.64.
Targets: $4.03 → $4.63–$4.98 → $5.37, with long-term potential to $6.45–$7.73
Strategy: Enter long upon breakout at $3.64 with increased volume, and add above $4.00
Sideways Case:
Condition: Price moves within the $2.62–$3.64 range
Strategy: Buy near $2.60–$2.70, take profit near $3.60–$3.70
Bearish Case:
Condition: Price drops below $2.62 and the 50-week EMA
Targets: $2.00 → $1.75
Strategy: Avoid longs, wait for a bottoming signal before re-entry
7. Conclusion and Investor Caution
Currently, SUI/USD is at a critical turning point both technically and structurally. The price is testing the lower boundary of its ascending channel and hovering near the 0.236 Fibonacci level, while momentum indicators are weakening.
If the price maintains support at $2.62 and stays above the 50-week EMA, the broader uptrend remains intact. A break below these levels, however, may indicate a shift toward a prolonged correction or medium-term downtrend.
Investors should closely watch resistance near $3.64 and volume behavior during breakout attempts. Risk management—such as using stop-loss orders and scaling into positions after confirmed signals—is essential.
In summary, while there is still potential for an upward move, confirmation through key resistance levels is necessary before a strong continuation can be expected.
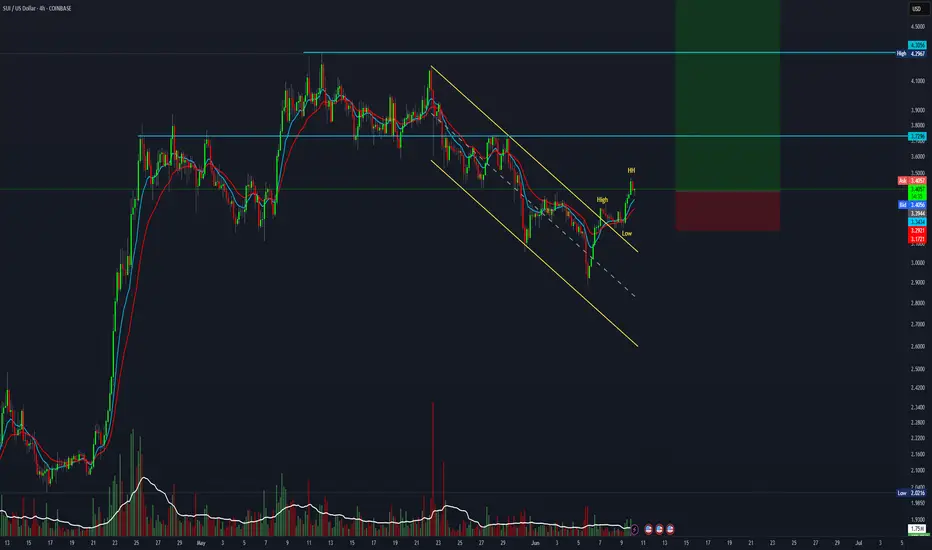
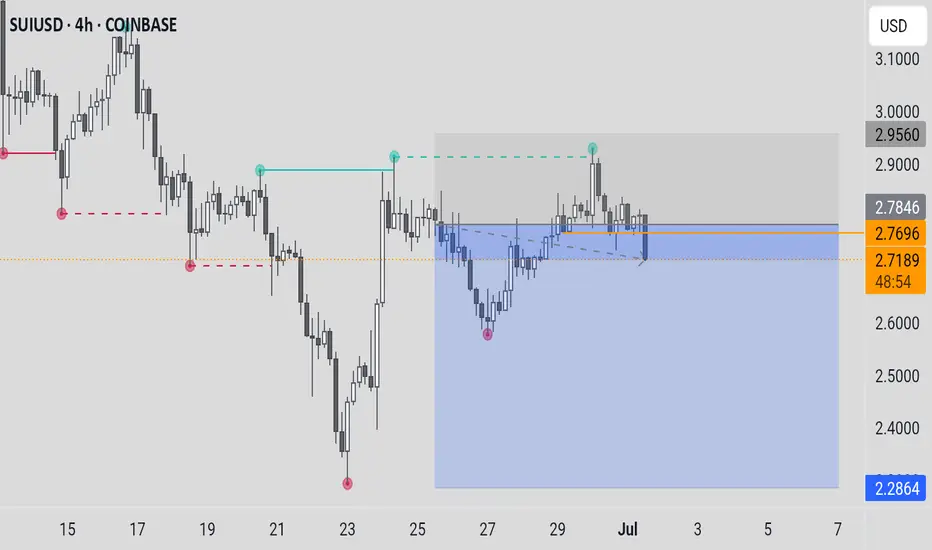
SUIUSD – Broken Wedge, Not Yet Broken OutSUI printed a breakout wick above $2.87, then retraced hard through support and consolidated in a falling wedge near $2.68. A minor breakout from that wedge has begun, with early signs of strength as price climbs into $2.74. Bulls need a break of $2.78–$2.80 to confirm trend reversal. For now, it's a fragile recovery.

SUIUSDTCryptocurrency Futures Market Disclaimer 🚨🚨🚨
Trading cryptocurrency futures involves high risks and is not suitable for all investors.
Cryptocurrency prices are highly volatile, which can lead to significant gains or losses in a short period.
Before engaging in crypto futures trading, consider your risk tolerance, experience, and financial situation.
Risk of Loss: You may lose more than your initial capital due to the leveraged nature of futures. You are fully responsible for any losses incurred.
Market Volatility: Crypto prices can fluctuate significantly due to factors such as market sentiment, regulations, or unforeseen events.
Leverage Risk: The use of leverage can amplify profits but also increases the risk of total loss.
Regulatory Uncertainty: Regulations related to cryptocurrencies vary by jurisdiction and may change, affecting the value or legality of trading.
Technical Risks: Platform disruptions, hacking, or technical issues may result in losses.
This information is not financial, investment, or trading advice. Consult a professional financial advisor before making decisions. We are not liable for any losses or damages arising from cryptocurrency futures trading.
Note: Ensure compliance with local regulations regarding cryptocurrency trading in your region.
thanks for like and follow @ydnldn
SUI long 34% short 88%I think we need to see these moves first before we will have the extreme big wave to the upside. Just opened a long position. Then looking to short

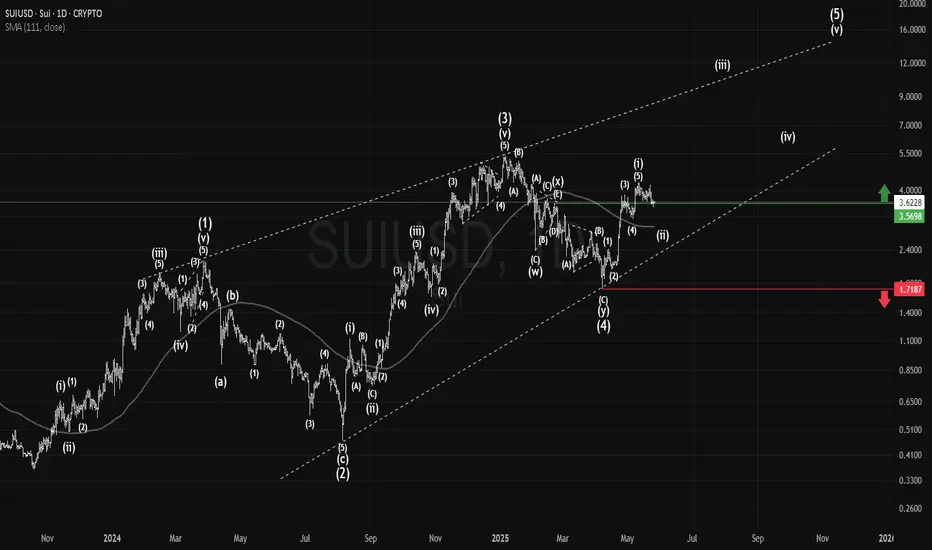
SUI Macro AnalysisCRYPTOCAP:SUI macro analysis update...
📈 𝙇𝙤𝙣𝙜 𝙩𝙚𝙧𝙢 outlook shows price action still outperforming most alts with a great rally recently. Target remains the R5 weekly pivot at $15
📉 𝙎𝙝𝙤𝙧𝙩 𝙩𝙚𝙧𝙢 outlook has price pulling back, looking to find a bottom between $2.3-2.65
War escalation's and retail selling are keeping price suppressed as price changes hands to private companies and large wallets.
The time for patience continues. Money is made in the sitting, weathering volatility, not flipping in and out of trades on every bit of news and price movement
𝙏𝙚𝙘𝙝𝙣𝙞𝙘𝙖𝙡 𝘼𝙣𝙖𝙡𝙮𝙨𝙞𝙨
Price is testing the weekly pivot and daily S1 pivot as support
Elliot Wave (EW) analysis was a strong, textbook motif wave with a wave 2 retracement underway. Wave 2 often extends to the 61.8 Fibonacci retracement of $2.4 but the alt-coin golden pocket is the 78.6 at $2.03. No surprises if we see that area revisited and could be a great buying opportunity.
Price has lost the daily 200EMA and DEMA which is bearish short term.
Safe trading

Momentum vs. ResistanceThe short term momentum is in the bulls favor, but multiple levels of resistance ahead. Hopefully the price will respect my lines. 🙏
It will be interesting to see the effect of this week’s fed meeting and how it relates to the interaction of price with the moving averages. The timing of these relativities will determine the outcome. In the meantime,😴
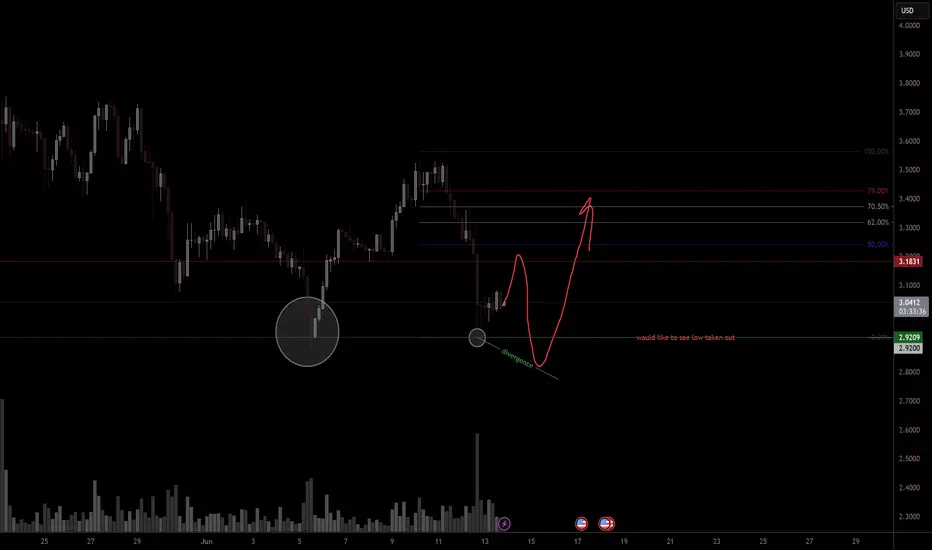
SUI Long UpdateDue to unforseen events, I have updated my chart.
We bounced off an old daily level.
I will be waiting for a sweep of the low because my bias is that this is not a V-Shaped Recovery.
I'll be waiting for divs on the 4hr and volume spike on the 7m.
$SUI heading back to $1.50 or belowAll of crypto is about to fall significantly, most people just don't realize it yet. Many alts will fall 50%+, and coins like SUI and XRP that people feel safe in, won't escape the bearish move.
Just looking at the chart, we can see that SUI broke upwards in August of last year and topped in January, and has since retested resistance at $4.05 and rejected-- forming a large lower high.
It makes the most sense to me that we will now see price retest the lows that price broke out from as they never got tested on the way up.
We should see price fall down to the lower support levels over the coming weeks.

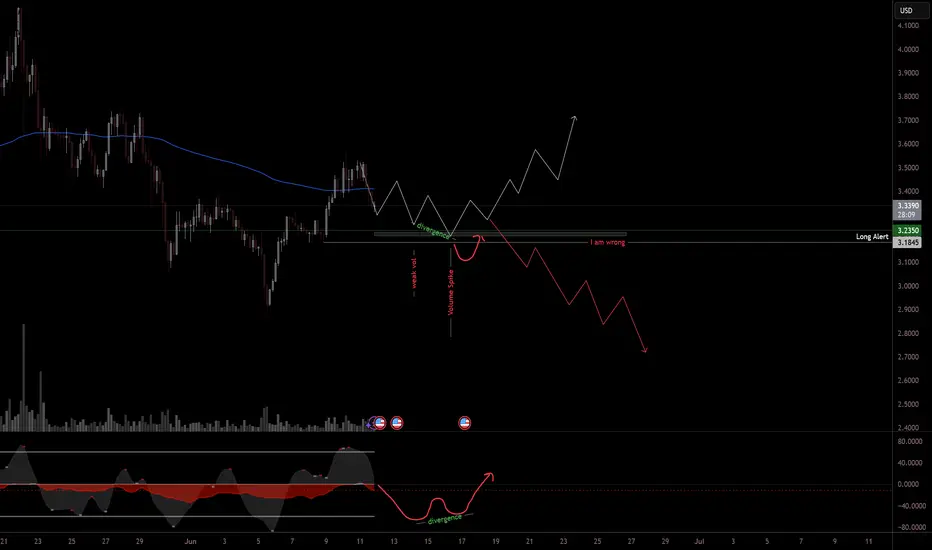
SUI Long IdeaWaiting for divergence confirmation on 4hr and volume spike on 7m or 2m.
Will enter trade if price falls below level and re enters it.
Risk will be managed, will medium position and tight stoploss.
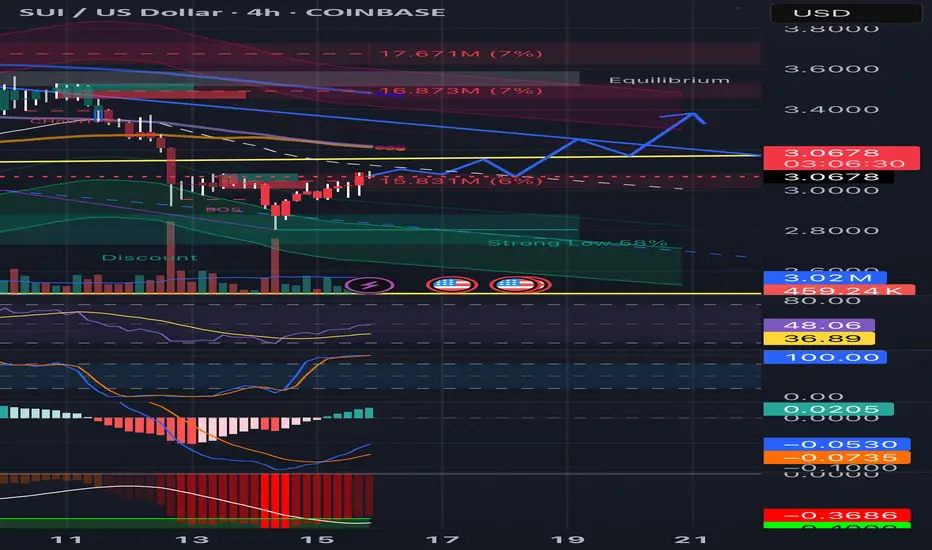
SUI is building momentum!📈 CRYPTO:SUIUSD After a three-swing corrective pullback into the $3.3 - $2.7 buying zone, price is bouncing and setting up for the next upside move.
The structure is in place—let’s see if the breakout confirms!
Bullish on $SUISui is demonstrating strong ecosystem growth, particularly in the DeFi and stablecoin sectors. However, short-term selling pressure and technical resistance may affect price movements in the near future.
Recommendation: For long-term investors, SUI offers significant growth potential, especially if its ecosystem continues to expand. However, it's important to regularly monitor both technical and fundamental developments and to adopt an investment strategy that aligns with your individual risk profile.

SUI (Daily) Elliot wave ii underwaySUI appears to have completed a motif wave (1) with an ending diagonal after finding a bottom at the major support high volume node (HVN) macro wave 4.
Wave 2 has not retraced as deep as other alt coins showing strength in the move up. The downside target is the HVN it has just tested at the 0.382 Fibonacci Retracement $2.95.
Wave 3 should be a powerful move up taking price into all time high.
Failure to hold this support could see price heading back to fresh lows and testing the $1.6 HVN once more.
Safe trading
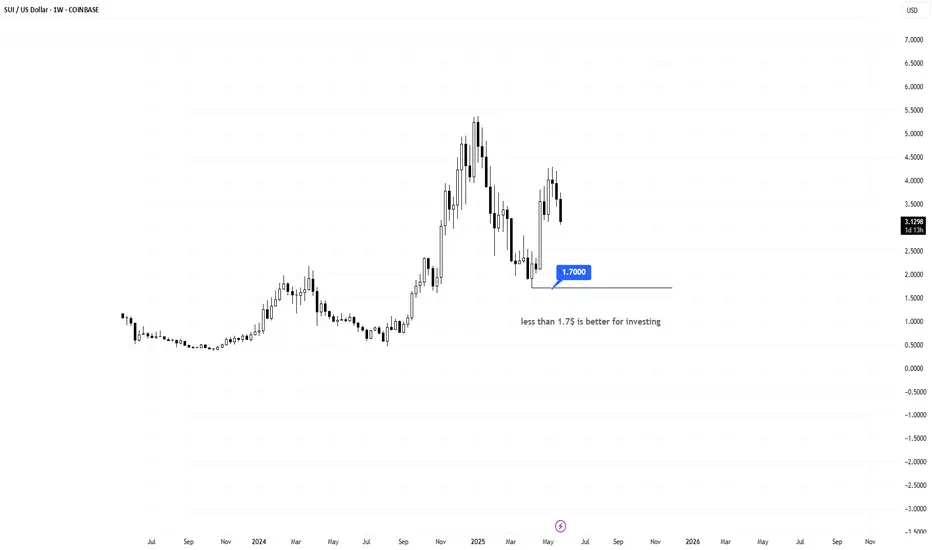
SUIIt is rational to invest at a price lower than 1.7$
SUI project:
Sui is a permissionless Layer 1 blockchain designed for ease of use by both developers and users.
Sui is a decentralized smart contract platform designed for efficient, low-latency management of assets. It utilizes the Move programming language to define assets as objects with ownership tied to specific addresses. Move programs are responsible for defining operations on these typed assets, including custom rules for their creation, transfer to new owners, and mutation.
The maintenance of Sui involves a permissionless group of authorities, which function similarly to validators or miners in other blockchain systems. These authorities employ a Byzantine consistent broadcast protocol to ensure the safety of common asset operations. This approach guarantees lower latency and improved scalability compared to traditional Byzantine agreement methods. Byzantine agreement is solely relied upon for shared object safety, governance operations, and checkpointing, all of which occur off the critical latency path. Smart contract execution is also naturally parallelized whenever possible.
Sui supports both light clients, capable of authenticating reads, and full clients, which can audit all transactions for integrity. These features enable trust-minimized bridges to connect with other blockchains seamlessly.
SUIUSDTset up LONG trade 📈
🚨🚨🚨Disclaimer on Money Management for Trading in the Futures
📝 MarketFutures trading carries high risks and may result in the loss of your entire capital. Only use funds you can afford to lose, set risk limits, and understand the market and leverage. Diversification does not guarantee profits. Consult a financial advisor before trading. All decisions and losses are your sole responsibility.

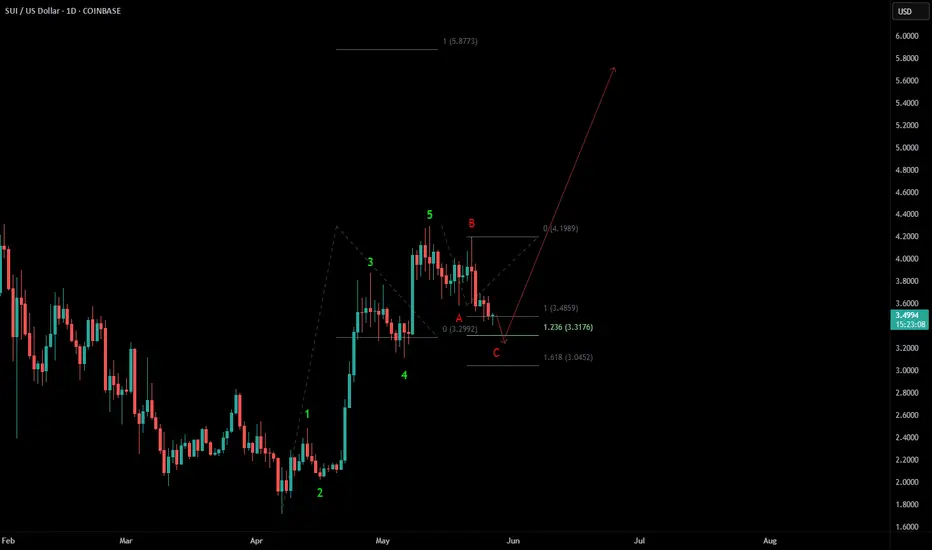
Bullish sequence in SUIUSD Since 4.07.2025 low, SUIUSD is showing the 5 swing bounce, which indicates that it will extend higher, once the pullback ends in 3, 7 or 11 swings pullback. Short term, it favors 3 swing pullback in A-B-C between 3.4859 - 3.0452 area before it resume higher. Further upside above 5.12.2025 will confirm the rally towards 5.85 or higher levels. But it and do double correction, if fail to break above 5.12.2025 high after ending the current pullback.
SUI update: Targeting the ATH#SUI has seen significant growth since its April low, passing the bullish confirmation level and forming a clear motive wave, followed by a correction.
As long as it holds above $1.71, this setup remains valid with potential for a new all-time high soon.
#SuiNetwork
SUI: Buy and hold till 2028?I am planning on buying and holding for now. SUI probably has the best chart among all altcoins at the moment. Beautiful higher highs and higher lows with perfect 45 degree angle and textbook Elliott wave look; it can't get any better. I started to buy last year and loaded up again during the recent correction and will plan on adding on every dip. Stop loss at the last low around $1.7 and it will move up as we see new higher lows. Fundamentally it seems to have everything going for it. It is fast and trying to be decentralized as a core feature. But similar to Solana, it needs to figure out how to minimize outages and exploits and hopefully will make the necessary changes soon to truly compete against ETH, SOL and ADA. As a new generation layer 1, it holds a lot of promise, so I will be in it for a while unless it proves itself otherwise.