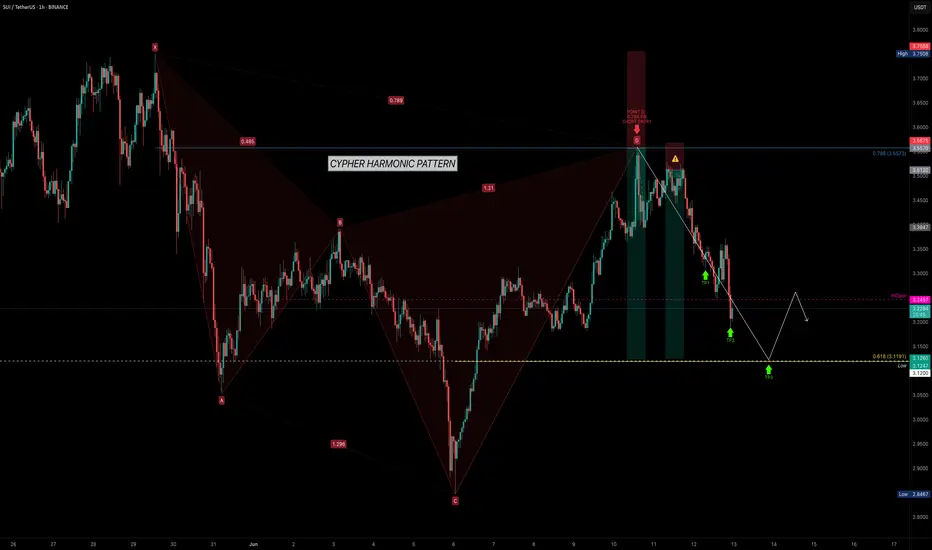
SUI — Trading with Geometry: Why Harmonics Work So WellSUI has been respecting technical levels with remarkable consistency. After bouncing from the $2.8467 low, it surged sharply — completing a clean Cypher Harmonic Pattern. This led to a high-probability short setup at the 0.786 Fibonacci retracement (Point D) around $3.5573.
🎯 Trade Setup Breakdown
Sui Update, Retest of Support; Bullish ConfirmedIt's been 9 days since my last Sui update. The chart looks good.
For context, see the previous analysis:
We started at the C wave of an ABC correction. There was an attempt to push prices higher but resistance was found at MA200. The resistance produced retrace and the same support zone is tested
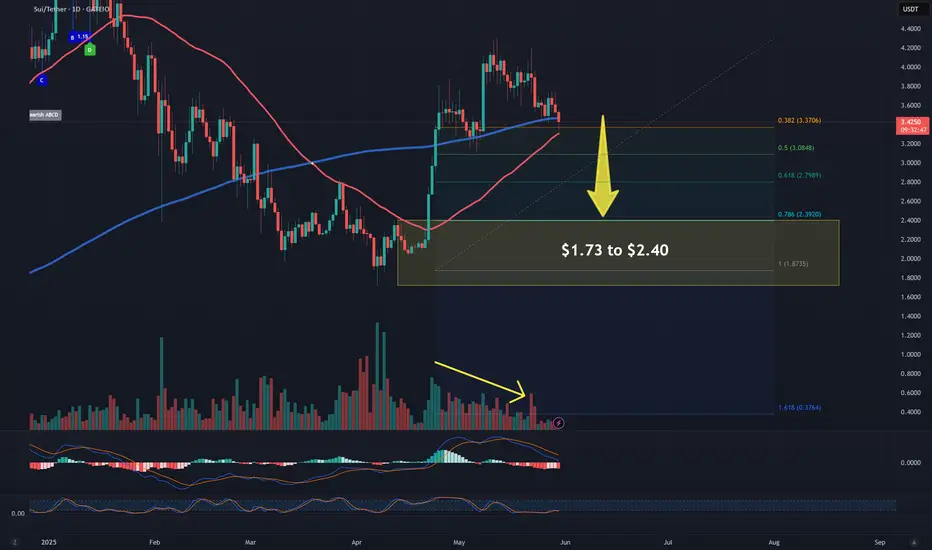
SUI landslide incomingSUI has lost support and has fallen below $3.55, and then failed to regain any ground above it repeatedly. The expectation is that it will hit the March 27 high of $2.82 and then possibly fall further.
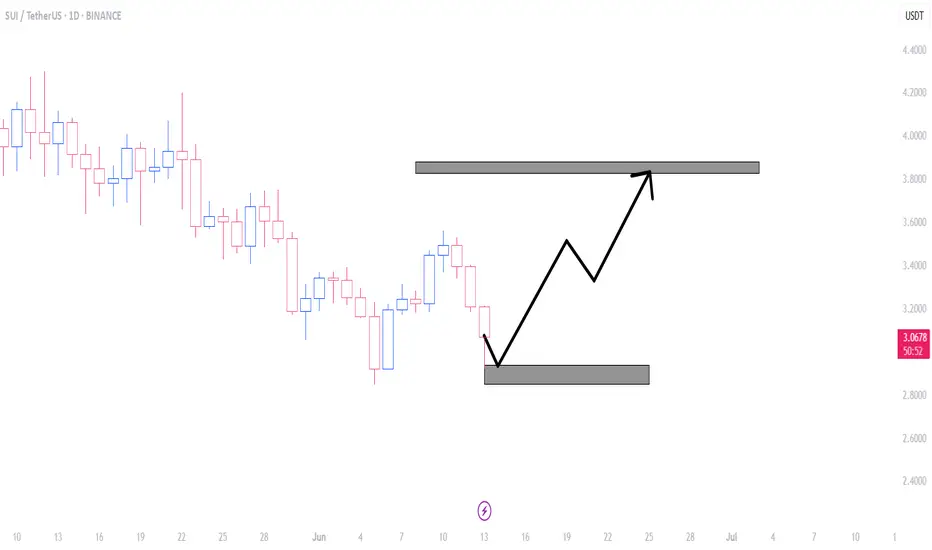
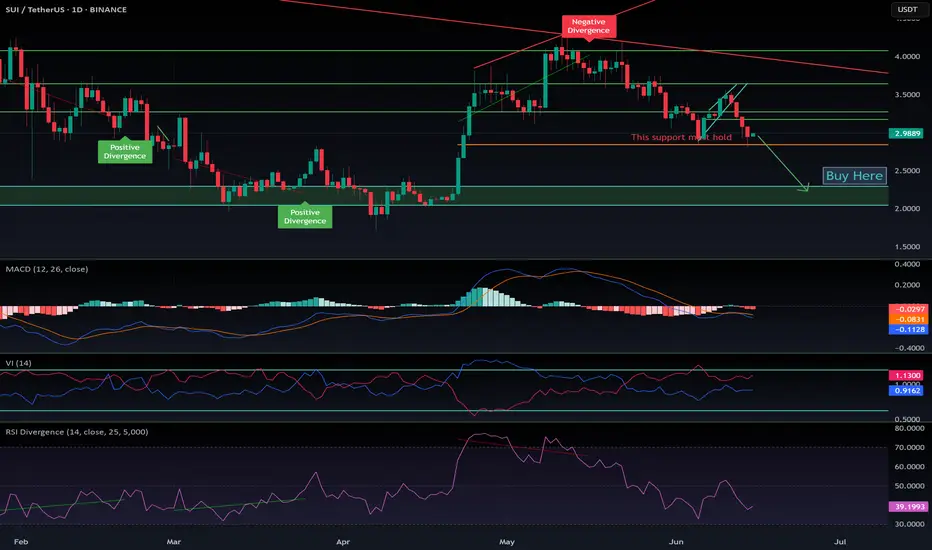
sui roadmapBased on the price movements and patterns created in this currency and the block order created, I predict bullish movements for SUI on the daily time frame.
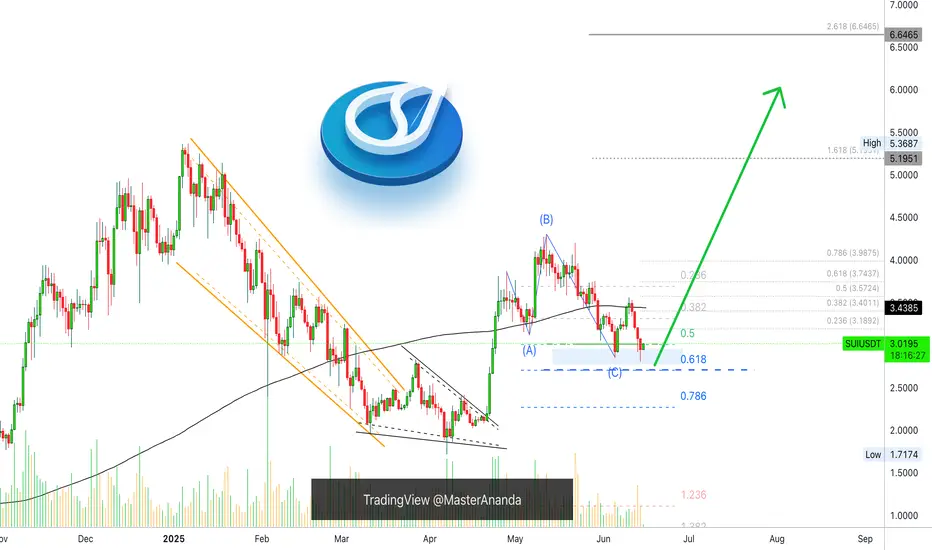
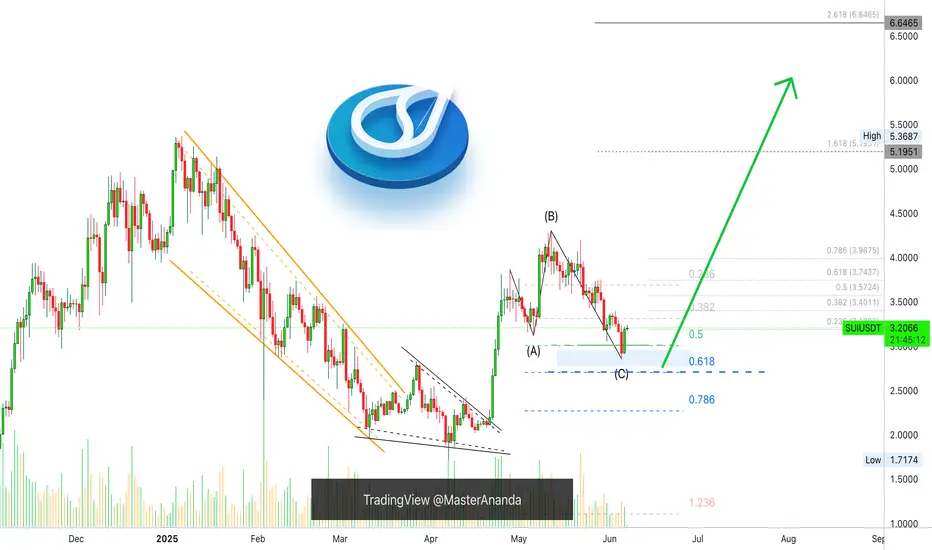
Sui Turning Green ($6.65 Target = 100%+ PP)Just like that Sui was red for 24 days. 24 days might not be that long but when you consider that the rise lasted 35 days, then yes, within this context it is a very long retrace... And look at the levels on the chart.
Support found at 0.5 Fib. retracement. This level was pierced followed by a reco
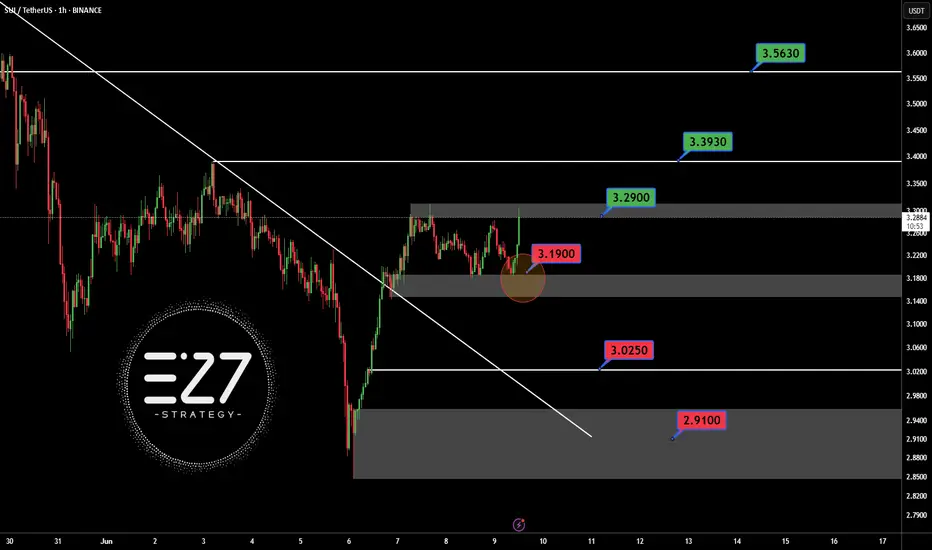
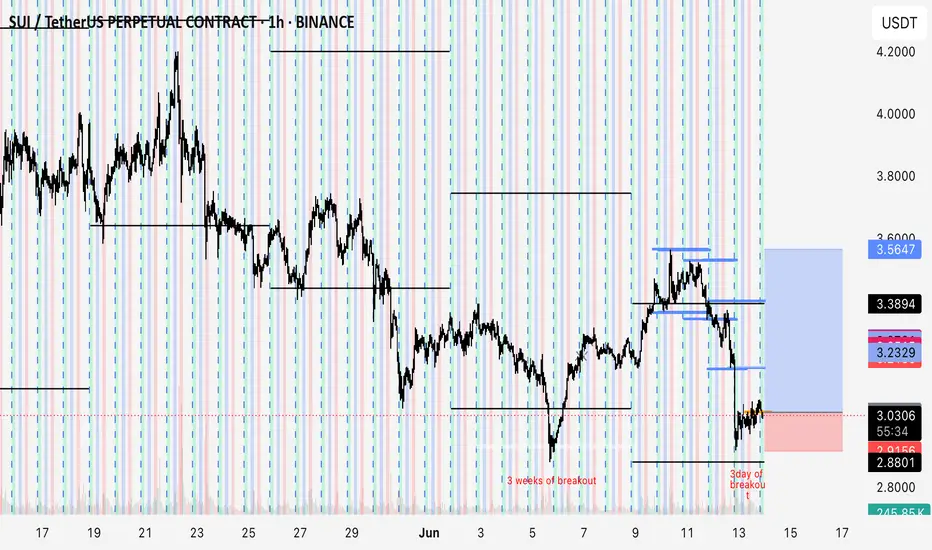
SUIUSDT3.19$ best price for pollback need for pump BINANCE:SUIUSDT . but for trust bullish trend, need for breaked 3.29$.
Best support: 3.025 - 2.91 $
Best resistance: 3.29 - 3.393 - 3.563 $
Contorl Risk management for trades.
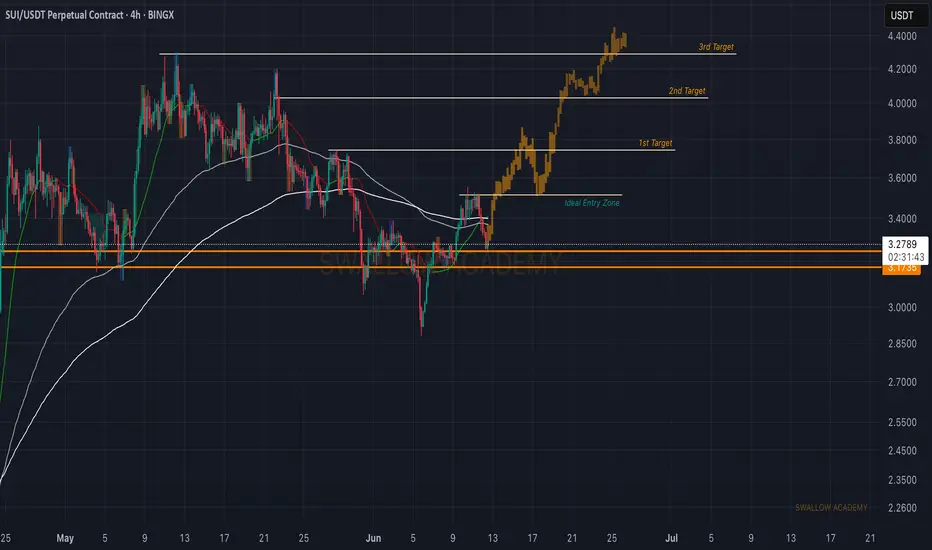
Sui (SUI): Targeting $4.20 | Bullish ScenarioWe are seeing the possibility for upward movement here, which could result in +20% of market price movement from our entry.
As of now it is too early yet to talk about any bullish movement here so we are waiting patiently for a proper breakout from our entry area, which would then give us a proper
$SUI follow up for June 2025CRYPTOCAP:SUI has tapped my support zone around $2.85, which is currently holding well.
That said, the broader trend remains corrective, and it's likely only a matter of time before this support gives way.
If that happens, we could see a drop into my green buy zone — sitting just below a major ord
$SUI: $2.95 must hold!CRYPTOCAP:SUI is following the broader altcoin market and entering a correction phase. As shown in the chart, CRYPTOCAP:SUI has already broken through two key support levels and is now hovering just above a critical support at $2.95.
If this level fails to hold, the next major support lies withi

Last bounce for the weekStill have today and Tomorrow to close out the week so hopefully it will be clean and close in our direction. 3 weeks of breakout, Monday triggered the other direction but Wednesday started to go down and in Friday it became 3 days of breakout to the low . Saturday’s Asia open above yesterday’s ses
See all ideas
Summarizing what the indicators are suggesting.
Oscillators
Neutral
SellBuy
Strong sellStrong buy
Strong sellSellNeutralBuyStrong buy
Oscillators
Neutral
SellBuy
Strong sellStrong buy
Strong sellSellNeutralBuyStrong buy
Summary
Neutral
SellBuy
Strong sellStrong buy
Strong sellSellNeutralBuyStrong buy
Summary
Neutral
SellBuy
Strong sellStrong buy
Strong sellSellNeutralBuyStrong buy
Summary
Neutral
SellBuy
Strong sellStrong buy
Strong sellSellNeutralBuyStrong buy
Moving Averages
Neutral
SellBuy
Strong sellStrong buy
Strong sellSellNeutralBuyStrong buy
Moving Averages
Neutral
SellBuy
Strong sellStrong buy
Strong sellSellNeutralBuyStrong buy
Displays a symbol's price movements over previous years to identify recurring trends.