Sui short to $2.2920Went short on sui a while ago. I think the market is likely to push down a bit more before we have any major corrective move based on my DTT analysis
Stop: $2.46 for better invalidation
Tp $2.2920
potential early close at $2.3248
Time sensitive

SUI Collapse Incoming? Bearish Pattern You Can’t IgnoreYello, Paradisers! Is #SUI about to enter a bearish spell? We’ve seen this setup many times before, and the warning signs are stacking up fast. If you're not already positioned or protecting capital, now’s the time to pay attention.
💎SUIUSDT has started losing momentum just as a classic head and sh
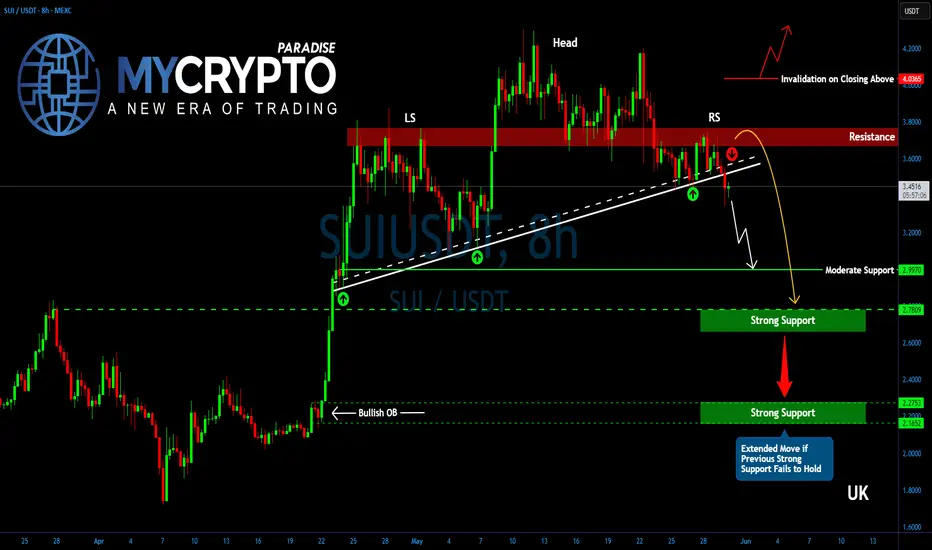
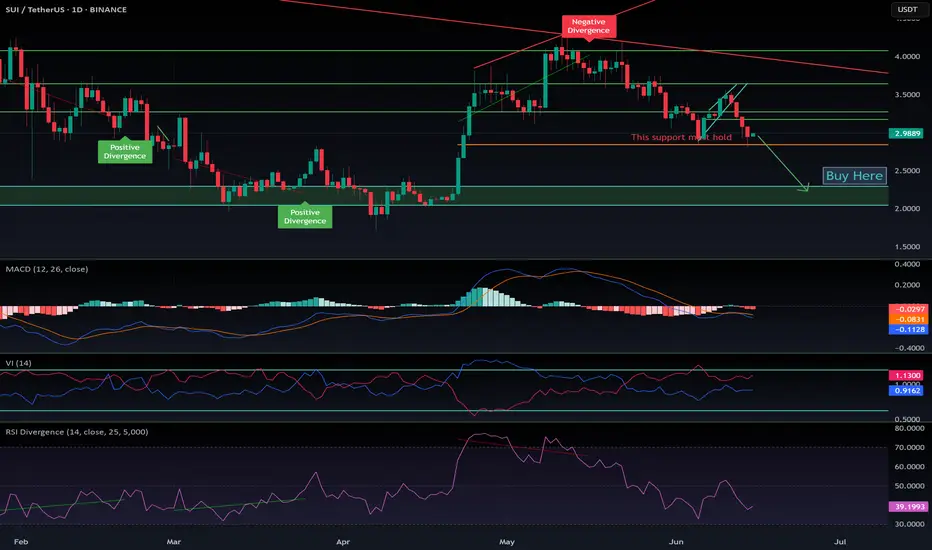
SUI landslide incomingSUI has lost support and has fallen below $3.55, and then failed to regain any ground above it repeatedly. The expectation is that it will hit the March 27 high of $2.82 and then possibly fall further.
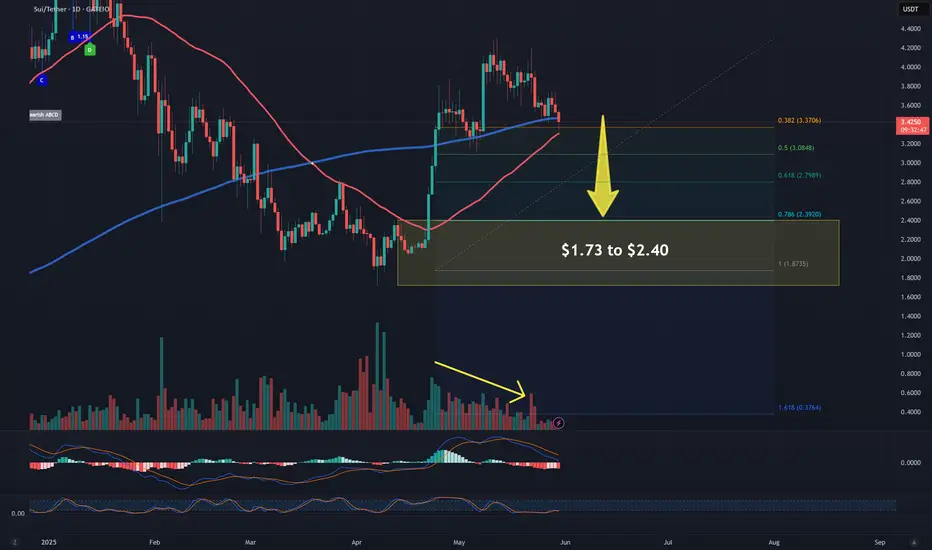
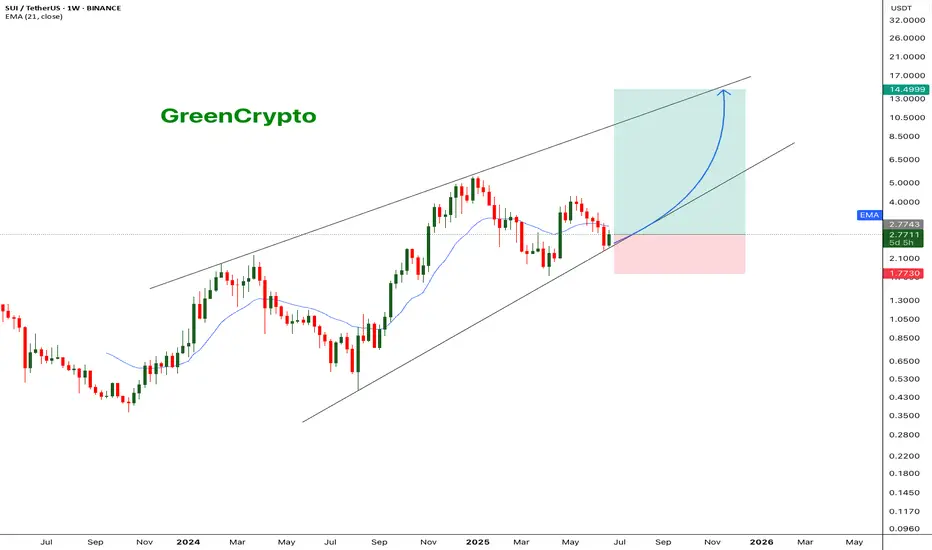
$SUI follow up for June 2025CRYPTOCAP:SUI has tapped my support zone around $2.85, which is currently holding well.
That said, the broader trend remains corrective, and it's likely only a matter of time before this support gives way.
If that happens, we could see a drop into my green buy zone — sitting just below a major ord
SUI - overhyped or does it have a FUTURE?⚡️ Hello everyone! So far, there has been nothing unexpected in Bitcoin for me personally to update the review. Let's take a look at one of the main altcoins of the season - SUI.
The project burst onto the scene very quickly, with some people writing it off when it hit $1. But it successfully rea
SUIUSD, almost near bottom, parabolic move nextSUI currently ay 2.65 is presently positioned near the lower boundary of its trendline. I expect an upward trajectory, potentially leading to a significant parabolic increase. We will monitor its progress.
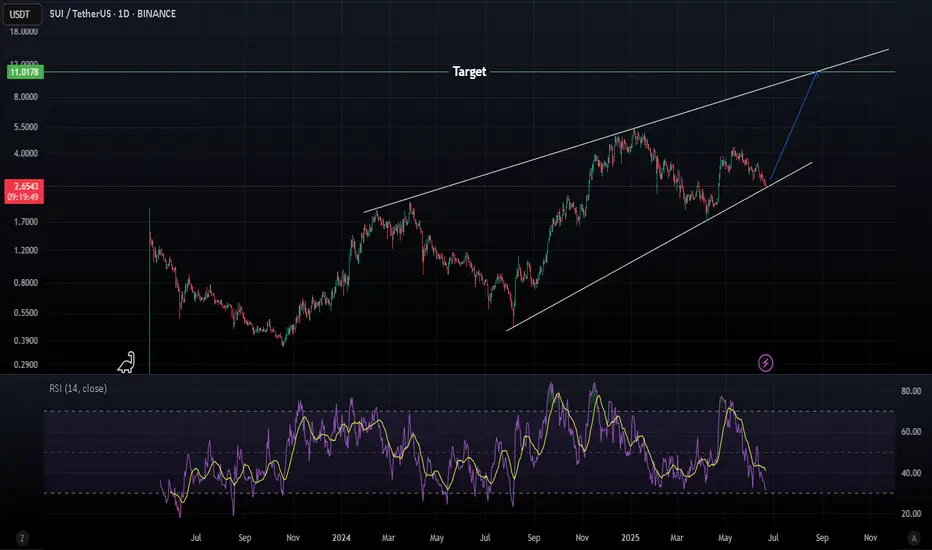
Pre-emptive W patternW pattern forming double bottom here then send to $12 that simple
potentially down to $2.30 - $2.50 max pain then if not here onwards and at 4 we tab off for the W and then boom rocket town.
Buckel up this is what I think, SUI loves W's
DYOR
I spoke to the one of the CO founders in an intervi
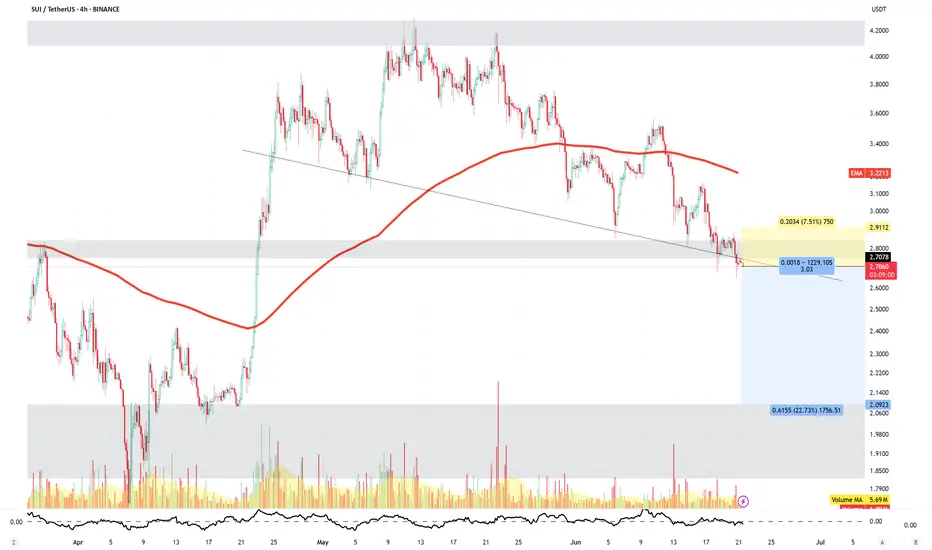
Short SUISUI has broken below both the 4-hour trendline and the daily horizontal support levels. The next key support zone lies around $2.20.
Setup is as in chart.
Disclaimer:
This analysis is based on my personnal views and is not a financial advice. Risk is under your control.
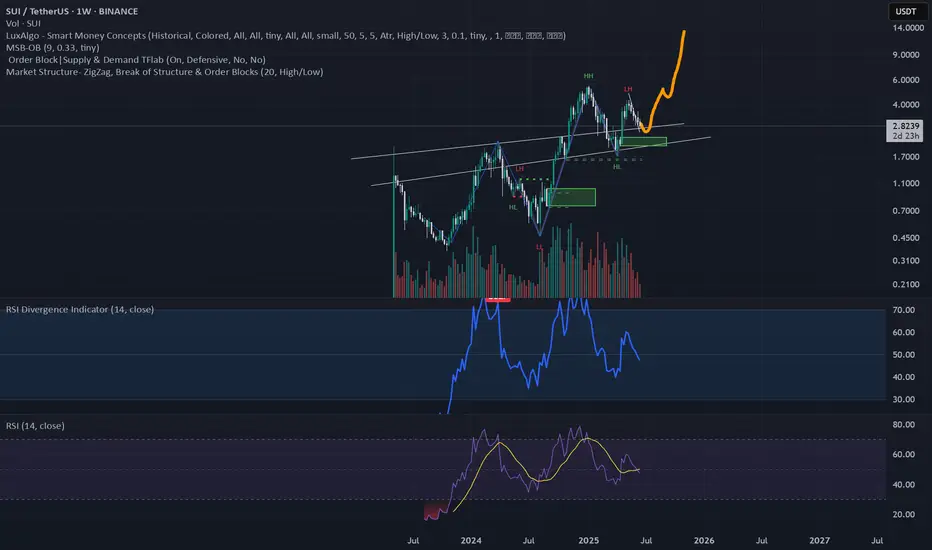
SUI - Only way is up.BINANCE:SUIUSDT (1W CHART) Technical Analysis Update
SUI is currently trading at $2.77and showing overall bullish sentiment
Price has touches the trending support and managed to bounce back from the support, this is a good sign. I see a good opportunity for long trade here with a decent stoploss.
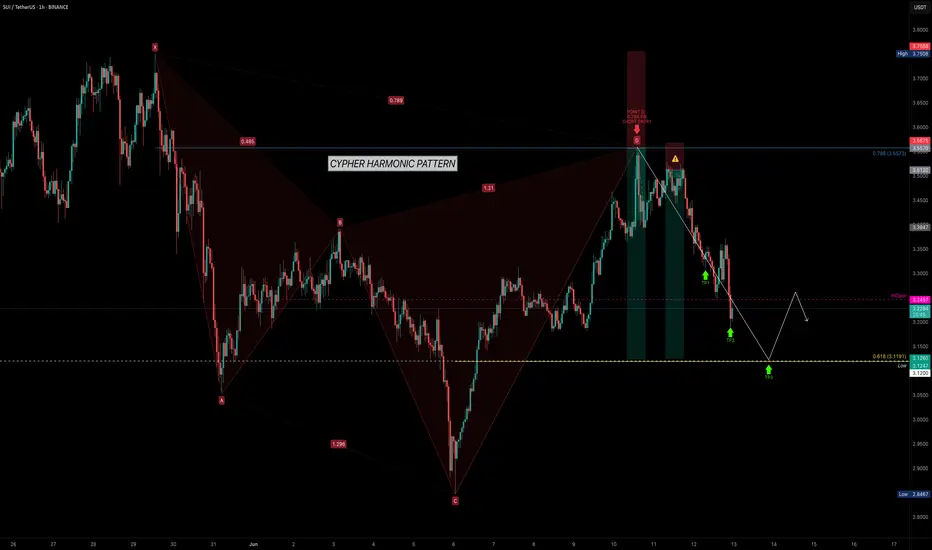
SUI — Trading with Geometry: Why Harmonics Work So WellSUI has been respecting technical levels with remarkable consistency. After bouncing from the $2.8467 low, it surged sharply — completing a clean Cypher Harmonic Pattern. This led to a high-probability short setup at the 0.786 Fibonacci retracement (Point D) around $3.5573.
🎯 Trade Setup Breakdown
See all ideas
Summarizing what the indicators are suggesting.
Oscillators
Neutral
SellBuy
Strong sellStrong buy
Strong sellSellNeutralBuyStrong buy
Oscillators
Neutral
SellBuy
Strong sellStrong buy
Strong sellSellNeutralBuyStrong buy
Summary
Neutral
SellBuy
Strong sellStrong buy
Strong sellSellNeutralBuyStrong buy
Summary
Neutral
SellBuy
Strong sellStrong buy
Strong sellSellNeutralBuyStrong buy
Summary
Neutral
SellBuy
Strong sellStrong buy
Strong sellSellNeutralBuyStrong buy
Moving Averages
Neutral
SellBuy
Strong sellStrong buy
Strong sellSellNeutralBuyStrong buy
Moving Averages
Neutral
SellBuy
Strong sellStrong buy
Strong sellSellNeutralBuyStrong buy
Displays a symbol's price movements over previous years to identify recurring trends.