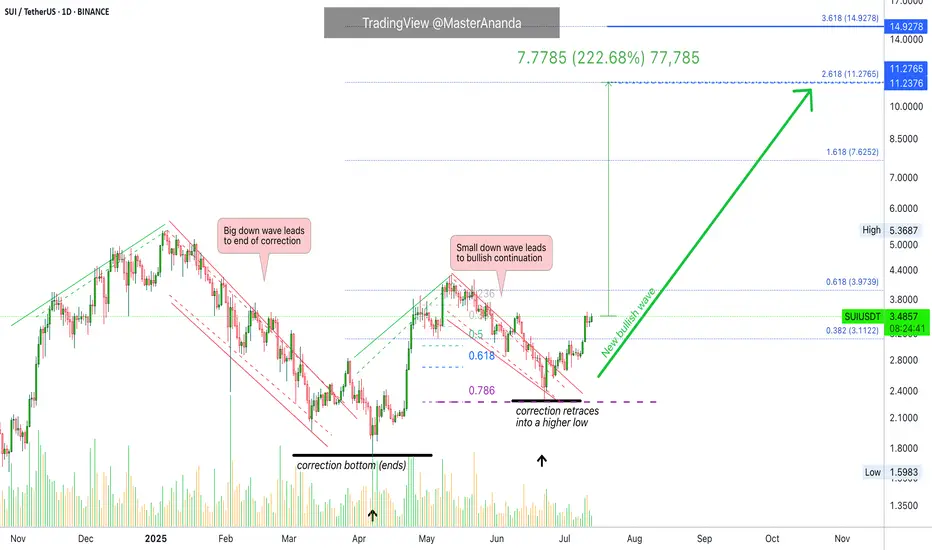
Sui Update · Clearly Moving Towards $7.62, $11.3 & $15The SUIUSDT chart looks great and just today we are witnessing a bullish continuation. Resistance was found 11-July but the market didn't produce any significant retrace. This is obviously because we are ultra-bullish and ultra-bullish can only mean sustained growth.
After the 11-July resistance, one day neutral and now resistance is being challenged again. Based on how Bitcoin is doing, a new all-time high; based on how the market is doing, great; we can expect higher prices in the coming weeks and months.
There will always be swings. Retraces and corrections but the bigger picture is a strong bullish dynamic for months. Think of 4-8 months of prices rising non-stop. That is what you are about to experience. Keeping in mind that the start date is 7-April and not today. So 6-8 months starting early April, growth long-term.
We will have a new all-time high for on this pair. There is huge potential for growth. The target on the chart is an easy one based on the short-term (within 1 month/30 days). After $7.62 we have $11.27 followed by $15. As you can see, it is still early within this bullish wave.
Thanks a lot for your altcoin choice, a great pick.
Your support is appreciated.
Namaste.
SUIUSDT.P trade ideas
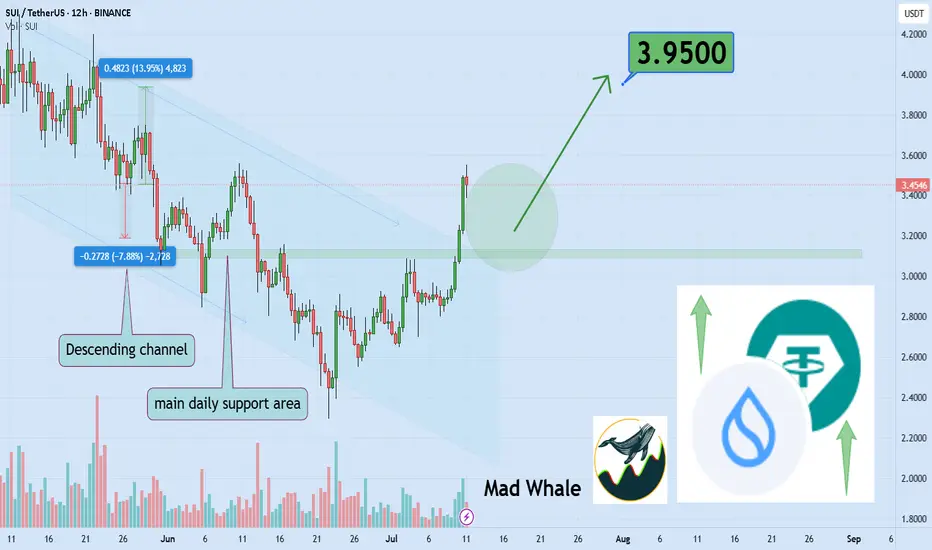
Is SUI ready to surge 13% toward $3.95 target?Hello✌
let’s dive into a full analysis of the upcoming price potential for SUI 📈.
BINANCE:SUIUSDT has broken out of its descending channel with notable volume, indicating a potential shift in momentum. Price action is currently holding near a key support area, which could act as a solid base for further upside. With sustained buying pressure, a move toward the $3.95 target offering at least 13% upside remains on the table. 📈🔥
✨ Need a little love!
We pour love into every post your support keeps us inspired! 💛 Don’t be shy, we’d love to hear from you on comments. Big thanks , Mad Whale 🐋
SUIUSDT Long IdeaDescending trendline of lower highs has been breached
Should expect rejection at $4 area and a slight pullback to 0.382 fib level around $3.35
Resistance at $4 area should be closely monitored and if breached, wait for retest and confirmation in order to set up long position.
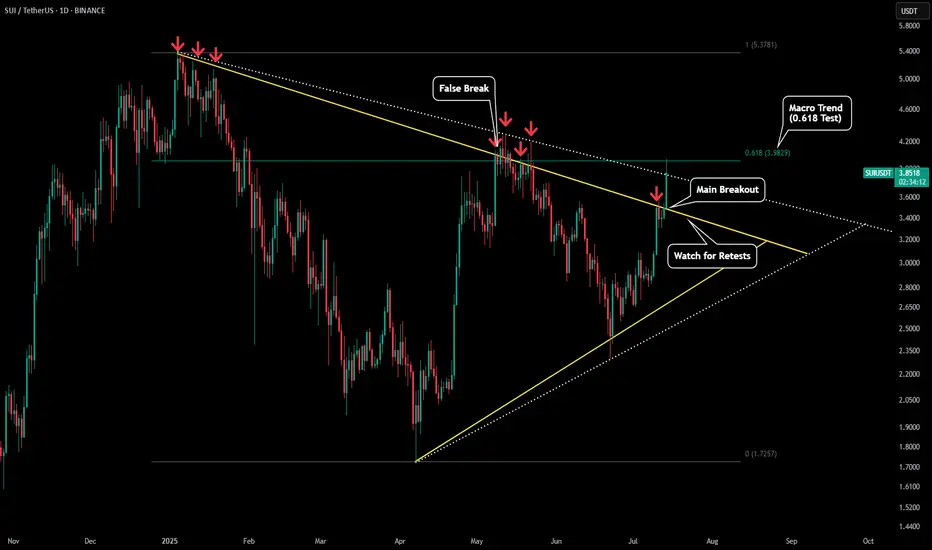
SUI - Daily Chart PerpectiveThis chart is in expansion to our previous post:
What we can see is SUI has clearly broken out of its symmetrical triangle (yellow trendlines). This is the first good sign for potential new highs for SUI.
However since the 4H chart could be spelling out a short term drop lets see where price could go.
Right now it is testing the 0.618 of the macro trend as resistance. It could also be battling with the top range of wick price action (dotted white lines).
If price does fall on the 4H chart it could coincide with a retest of our yellow trendline.
If we get a retest and hold of that yellow trendline that will be the confirmation we need for a full blown breakout for SUI.
If we do not fall on the 4h chart and break back above the $4 level then price will head to the 0.786 ($4.60) followed by a test of the previous high.
SUI SELL SETUP , Sold From $3.95SUI SELL SETUP
Currently $3.95
Sold From $3.95
(Trading plan If SUI go up to $4.10
will add more shorts)
Expecting target $3.85 OR DOWN
In the event of an early exit,
this analysis will be updated.
Its not a Financial advice

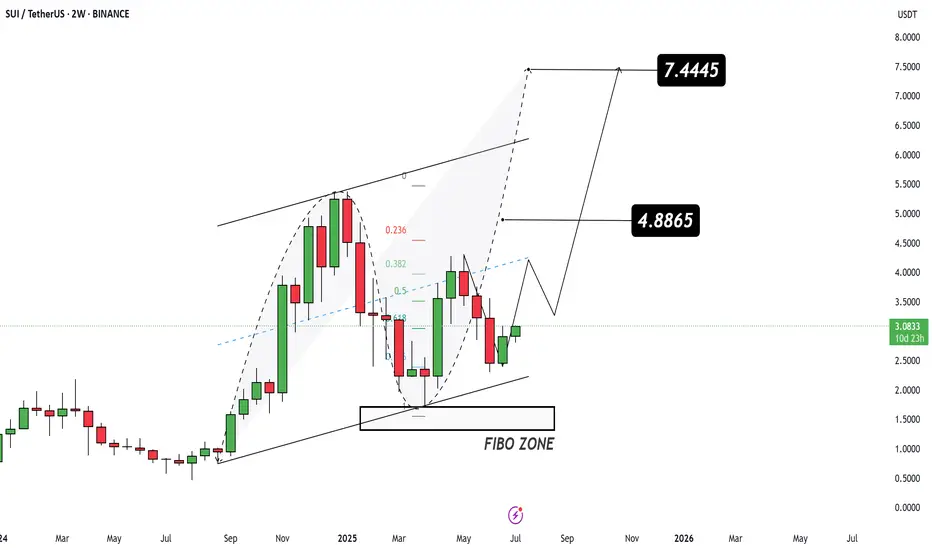
$SUI/USDT Technical Analysis
Major Bounce from FIBO ZONE 📈
SUI has just bounced off the golden Fibonacci retracement zone (0.618–0.786), confirming it as strong dynamic support. This move comes after a healthy correction from previous highs.
📍 Current Price: $3.0816
🎯 Target 1: $4.8865
🎯 Target 2: $7.4445
🛡 Invalidation Level: Weekly close below $2.40 may signal weakness
SUI - SUI SUI in your ears!Hellooo so SUII moves are marked till the blue line - as stated but beyond it if it goes just in case, you know the path
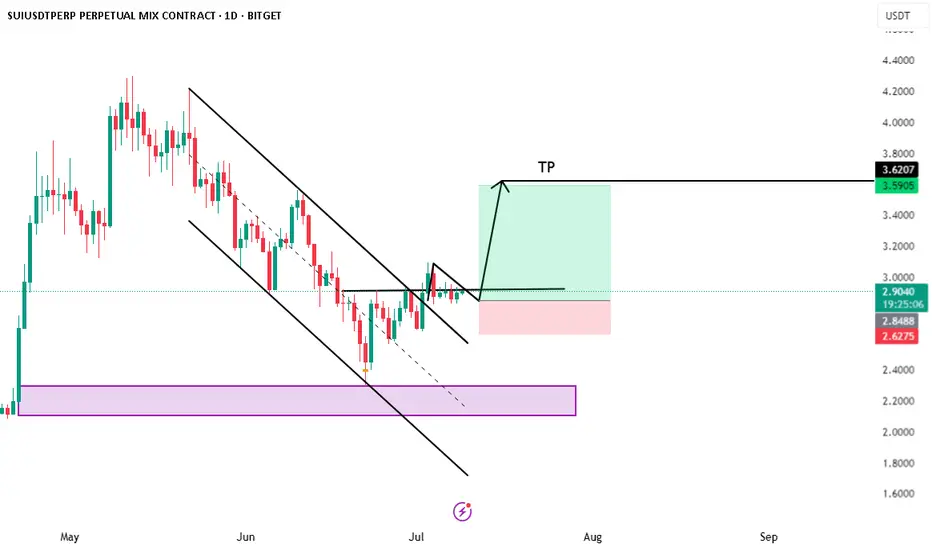
$SUI Swing Trade Setup – Breakout Confirmation & R/R Plan📌 Analysis Summary:
SUI has broken out of a strong falling channel structure that started in late May.
We’re now seeing a bullish breakout + retest, suggesting a potential trend reversal from bearish to bullish.
A small consolidation zone near the breakout confirms strength, supported by buyer presence near previous highs.
🛠️ Trade Plan (Swing Setup):
Entry: $2.89 (current price zone, post-breakout consolidation)
Stop Loss: $2.62 (below consolidation + last support structure)
Take Profit: $3.62 (near previous key resistance level)
Risk/Reward Ratio: ~2.7R
🔎 Key Technicals:
Breakout from downtrend channel
Consolidation above previous structure
Higher low formation visible
Volume remains steady, showing no strong rejection
🧠 Trade Management:
Partial TP can be considered around $3.30
Monitor BTC movement for broader sentiment
Break below $2.62 invalidates this setup
📈 This is a swing position, not a scalp — ideal for 3–10 day holding period if structure holds.
🛑 Always use proper risk management.
🔔 Follow for more clean setups.
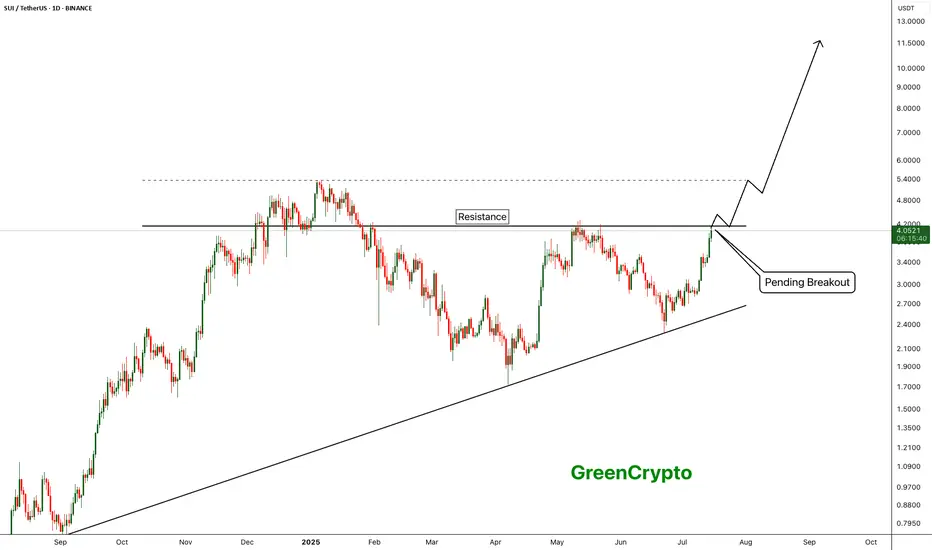
SUI - Breakout of the year- SUI is currently trading near the resistance line. Price was reject around this resistance line in the previous pump.
- Given the current bullish market, price is expected to breakout from this resistance easily
Entry Price: 4.04
StopLoss: 3.2
TP1: 4.5059
TP2: 5.3810
TP3: 6.5106
TP4: 7.8772
TP5: 10+
Don't forget to set stoploss.
Stay tuned for more updates
Cheers
GreenCrypto
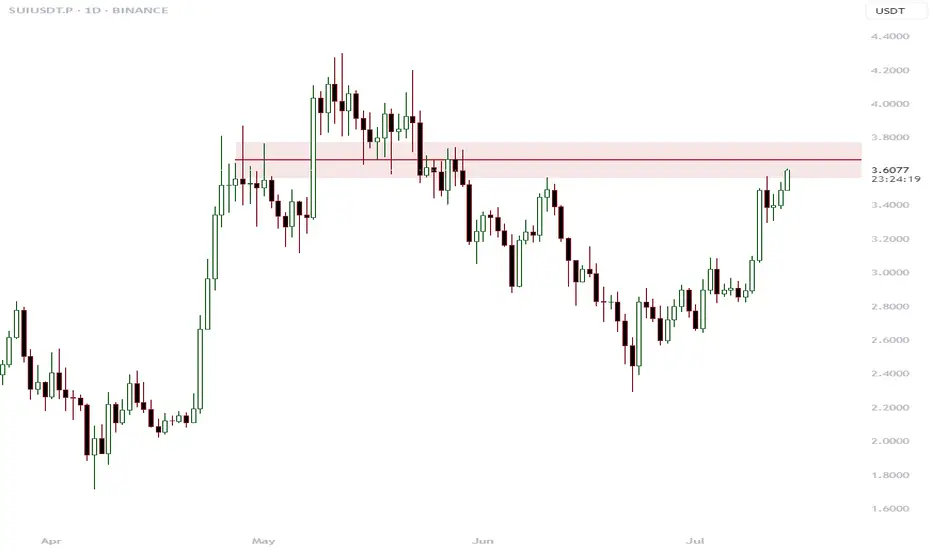
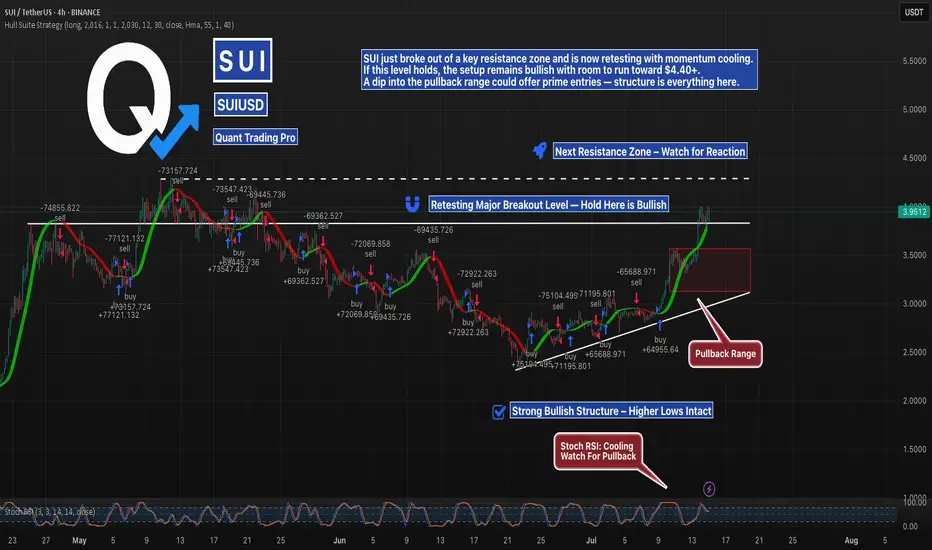
SUI Breakout Retest in Progress — Bulls Have the BallSUI has finally broken above major horizontal resistance and is now retesting that level, backed by a rising trendline of higher lows. With Stoch RSI cooling and the price sitting just above a prior range, this is the key decision zone.
If bulls defend the breakout, continuation toward $4.40+ is likely. If not, the pullback zone between $3.50–$3.00 becomes critical. Structure still favors the bulls — but confirmation is everything.
#SUIUSDT #CryptoBreakout #QuantTradingPro #TradingView #BacktestYourEdge #AltcoinSetup
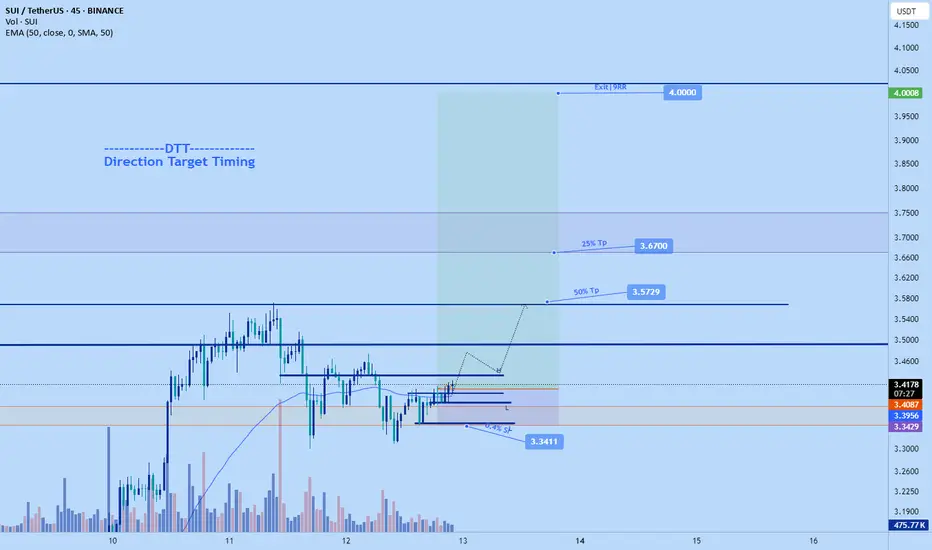
Sui long to $4.00Just opened a long position on sui. Its not the usual time for a long on the weekend but I got a few confirmations so while it feels weird am taking a risk on it.
Btc recently made ATH and it keeps going. So...expect anything.
See tp targets on chart.
stop: $3.3411 - wide and conservative
DTT strategy applied
Direction, Target and Timing
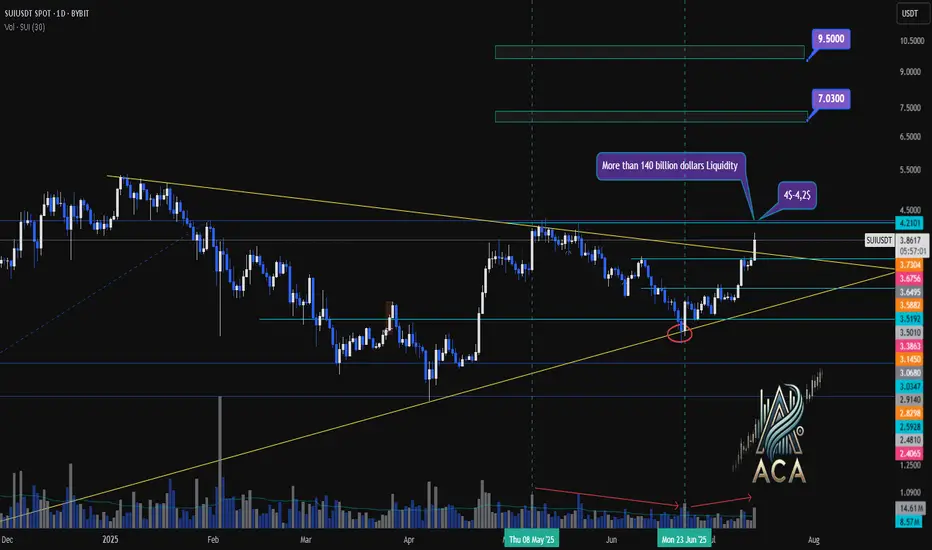
SUIUSDT Weekly Chart Analysis | Breakout Confirmed!SUIUSDT Weekly Chart Analysis | Breakout Confirmed, Massive Liquidity at $4–$4.20
🔍 Let’s dive into the SUI/USDT weekly chart after a decisive breakout from the symmetrical triangle, highlighting the critical liquidity zone and what it means for price action.
⏳ Weekly Overview
SUI has broken out of its multi-month triangle pattern following a textbook fakeout, with volume dynamics confirming renewed bullish momentum. The breakout is now awaiting daily candle confirmation for full validation.
🔺 Bullish Breakout & Key Liquidity Zone
A major liquidity cluster sits between $4.00 and $4.20, with more than $140 billion in liquidity concentrated in this range. This zone is crucial for several reasons:
- It represents a significant area where large buy and sell orders are stacked, likely leading to heightened volatility as price approaches or breaks through.
- Clearing this liquidity could unlock rapid moves toward the next upside targets at $7.03 and $9.50, as shown on the chart.
📊 Key Highlights
- Symmetrical triangle resolved with a bullish breakout, confirmed by increasing volume.
- The $4.00–$4.20 range holds over $140B in liquidity, making it a pivotal battleground for bulls and bears.
- Daily candle confirmation remains essential for trend validation.
- SUI ecosystem has reached a new all-time high in DeFi TVL, adding fundamental strength to the bullish case.
🚨 Conclusion
The breakout above the triangle, combined with surging volume and a record DeFi TVL, sets the stage for a potential rally. Watch the $4.00–$4.20 liquidity zone closely—how price interacts with this level could determine the speed and magnitude of the next move. Stay alert for daily confirmation and be prepared for volatility as SUI tests this high-stakes region.
#SUI #CryptoAnalysis #TradingView #Altcoins #ACA
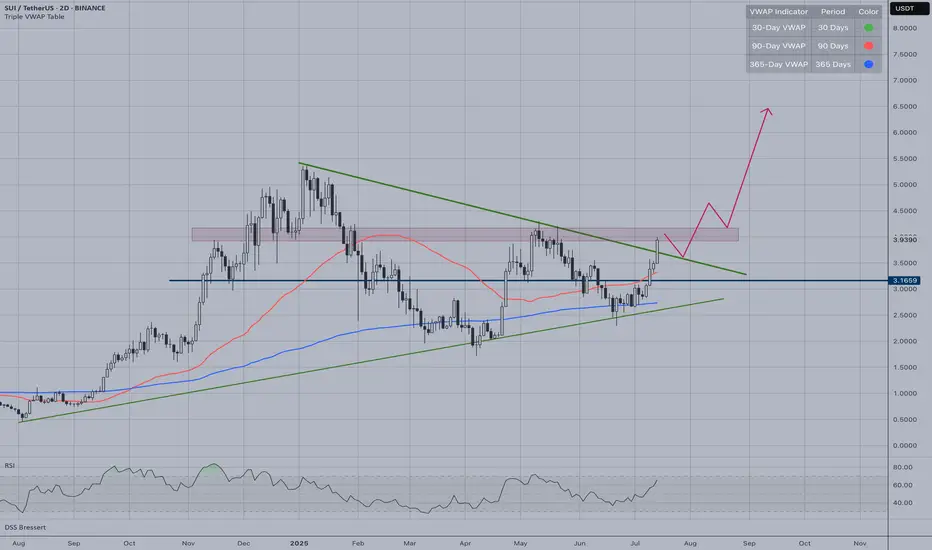
SUI | Triangle BreakoutSUI/USDT has successfully broken out of a major triangle consolidation pattern. The breakout pattern suggests SUI could experience significant upside momentum, especially if it maintains above the triangle's upper boundary. This technical setup aligns well with a medium-term bullish outlook.
Key Technical Points:
Triangle pattern breakout confirmed with strong momentum
Price cleared the upper resistance trendline decisively
RSI showing recovery from oversold conditions
Multiple VWAP levels providing support structure
Price Targets:
First resistance: $4.20 (red shaded zone)
Extended target: $6.50+ following the projected path
Trade Setup:
Entry: Current levels (agressive) or on a pullback to the triangle (conservative)
Stop loss: Below $3.30 VWAP-90 Support
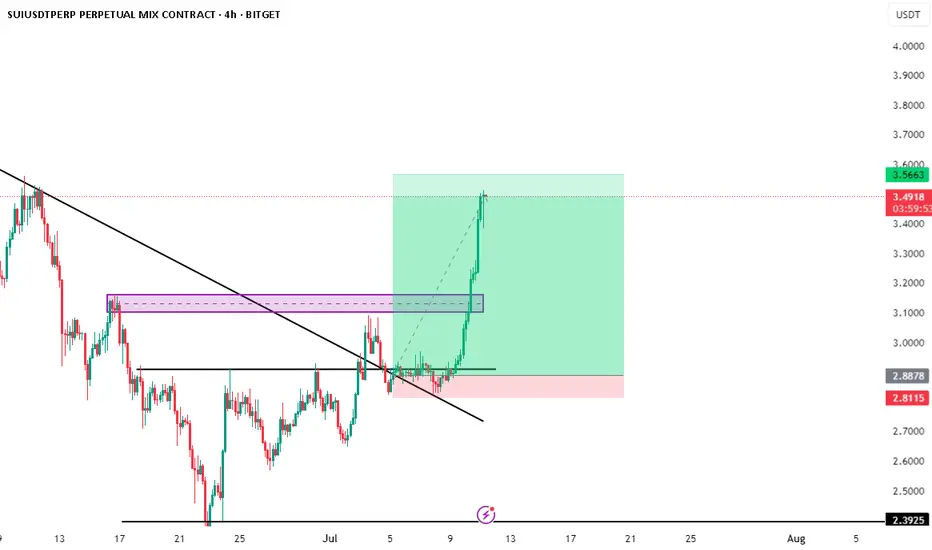
SUI/USDT Trade UpdateShared this setup yesterday — today it smashed right through the resistance zone 🔥
📈 Entry: ~$2.88
🎯 Target: $3.56
✅ Already up over +10% and still running strong!
This breakout was clean after breaking trendline + retest.
Follow if you caught it or want more sniper entries like this! 💥
#Crypto #Altcoins #SUI #TradingSetup #Bitget
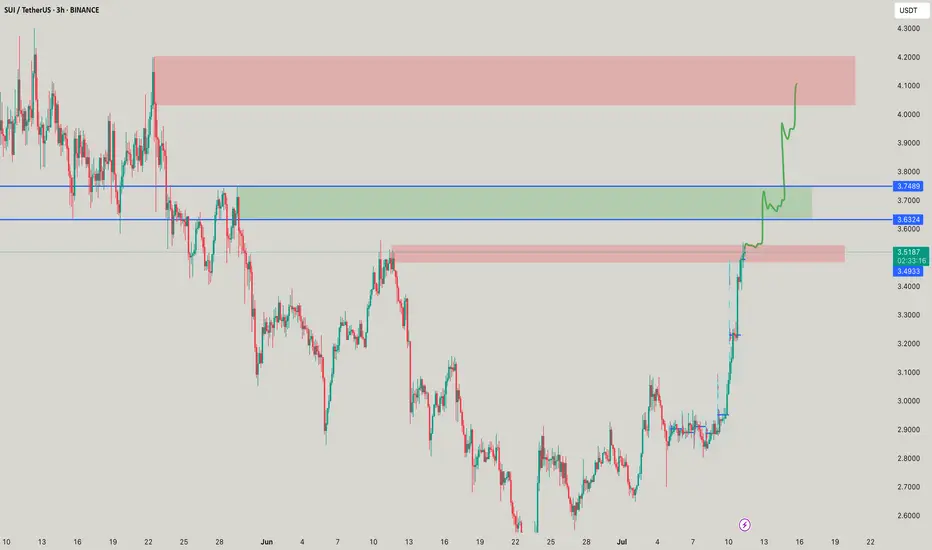
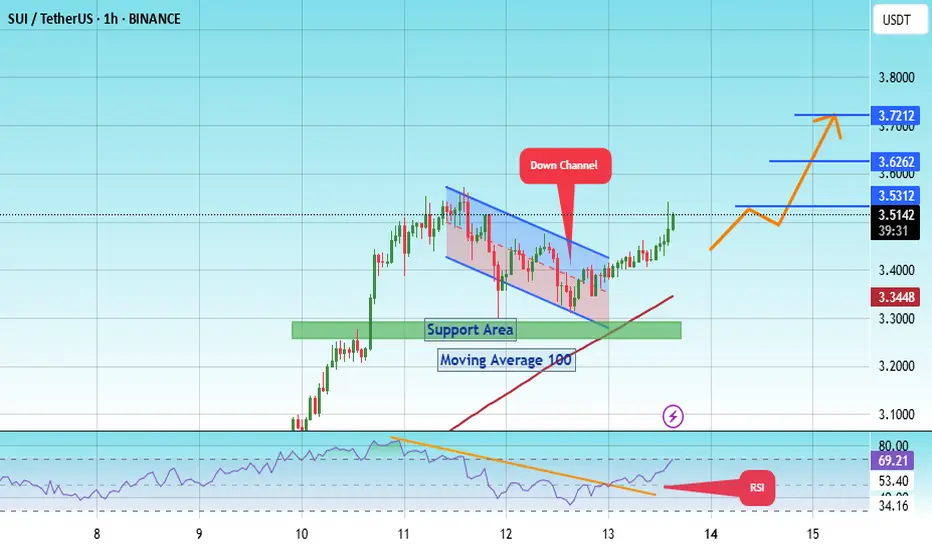
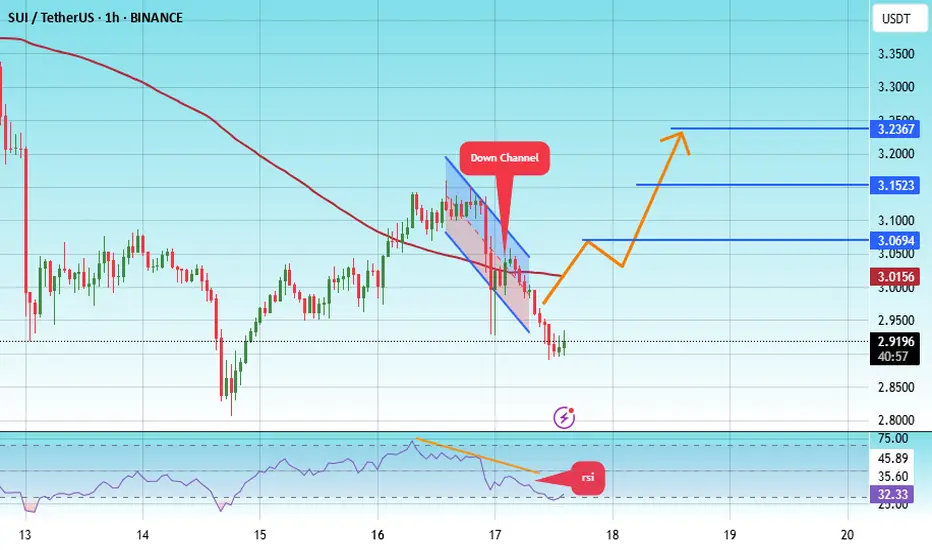
#SUI/USDT ready to surge 13% toward $3.72 target?#SUI
The price is moving within a descending channel on the 1-hour frame, adhering well to it, and is on its way to breaking it strongly upwards and retesting it.
We have a bounce from the lower boundary of the descending channel. This support is at 3.30.
We have a downtrend on the RSI indicator that is about to be broken and retested, supporting the upside.
There is a major support area in green at 3.20, which represents a strong basis for the upside.
Don't forget a simple thing: ease and capital.
When you reach the first target, save some money and then change your stop-loss order to an entry order.
For inquiries, please leave a comment.
We have a trend to hold above the 100 Moving Average.
Entry price: 3.44
First target: 3.53
Second target: 3.62
Third target: 3.72
Don't forget a simple thing: ease and capital.
When you reach the first target, save some money and then change your stop-loss order to an entry order.
For inquiries, please leave a comment.
Thank you.
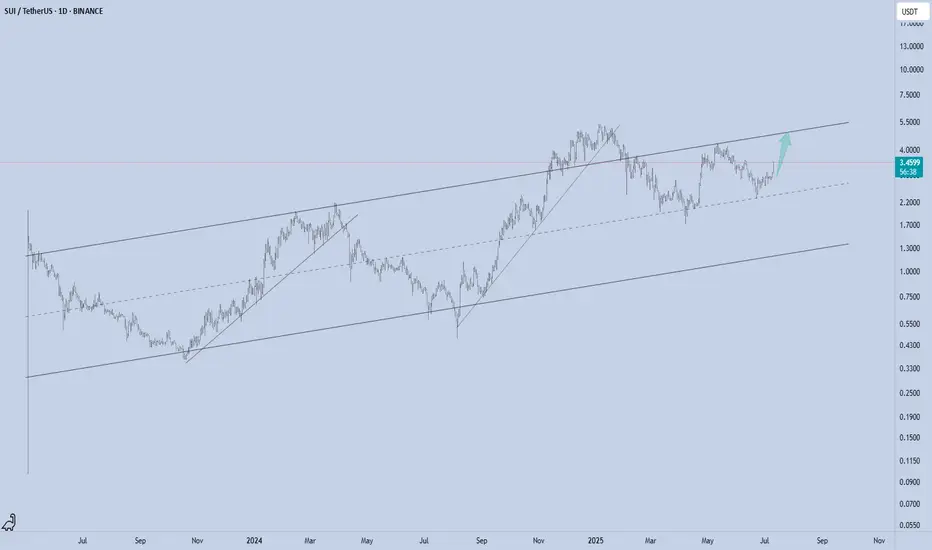
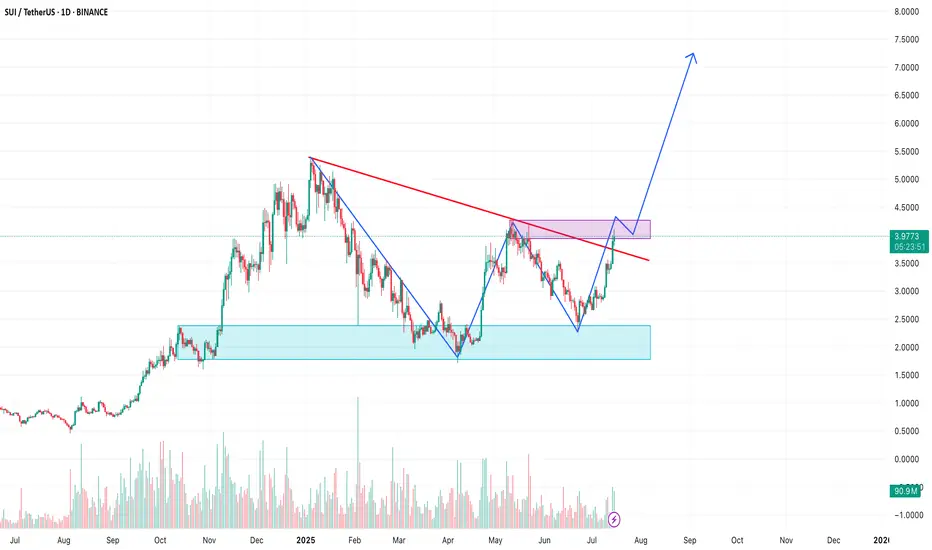
SUI - Channel Structure
SUI just printed a powerful +12.95% daily move, bouncing cleanly from the mid-range of its long-term ascending channel. This structure has been respected since mid-2023, guiding both impulse legs and corrective phases with precision.
Now trading around $3.47, the next logical magnet is the channel top near $5, especially if momentum persists and market sentiment remains risk-on.
Technical Structure:
Bullish trend within a well-defined ascending channel
Clean reaction from dynamic support (midline)
Clear higher low + breakout structure in play
Upside Target:
$5 (channel resistance)
As long as SUI holds above the rising midline (~$2.80 area), this setup remains valid for trend continuation toward the upper range.
📌 Risk Management:
Break below the midline flips the bias short-term. Until then, trend = friend.
SUI is breaking out – Time to buy again.SUI is now breaking above the descending trendline. The price is approaching a key resistance zone around $4.10–$4.20. A successful breakout and retest could open the door to a strong bullish continuation.
💬 What do you think?
Drop your thoughts ⬇️
#SUI #CryptoTrading #Breakout #Altcoins #TechnicalAnalysis
#SUI/USDT#SUI
The price is moving within a descending channel on the 1-hour frame, adhering well to it, and is heading toward a strong breakout and retest.
We are experiencing a rebound from the lower boundary of the descending channel, which is support at 2.90.
We are experiencing a downtrend on the RSI indicator that is about to break and retest, supporting the upward trend.
We are heading toward stability above the 100 Moving Average.
Entry price: 3.00
First target: 3.07
Second target: 3.15
Third target: 3.24
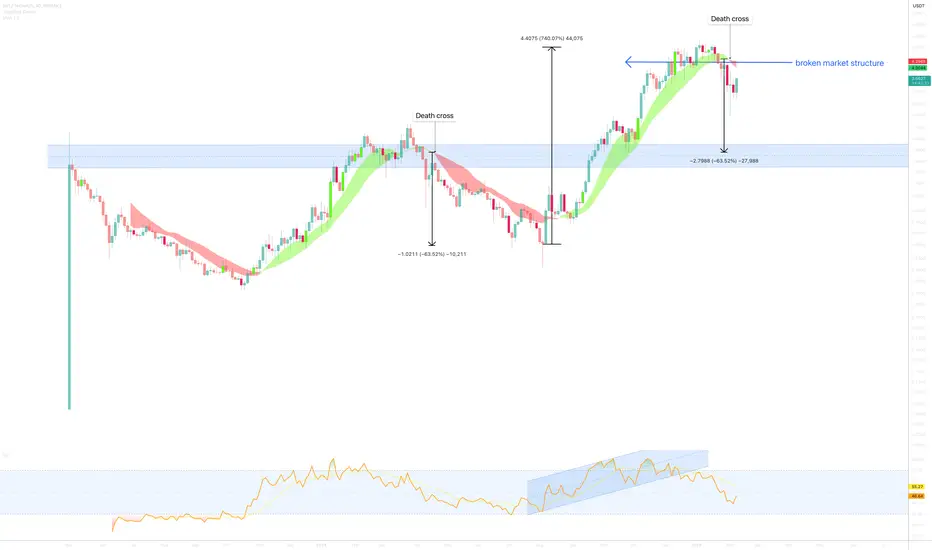
SUI 50% correction to $1.50 areaOn the above 3 day chart price action has moved up 700% since last August. A number of reasons now exist for a reversal, they include:
1) Broken market structure.
2) Price action and RSI support breakouts.
3) A reliable bearish crossover.
4) No support levels until 1.90. A strike of 1.50 is probable.
5) "Short" active from $4.05 area.
Is it possible price action continues printing higher highs? Sure.
Is it probable? No.
Ww
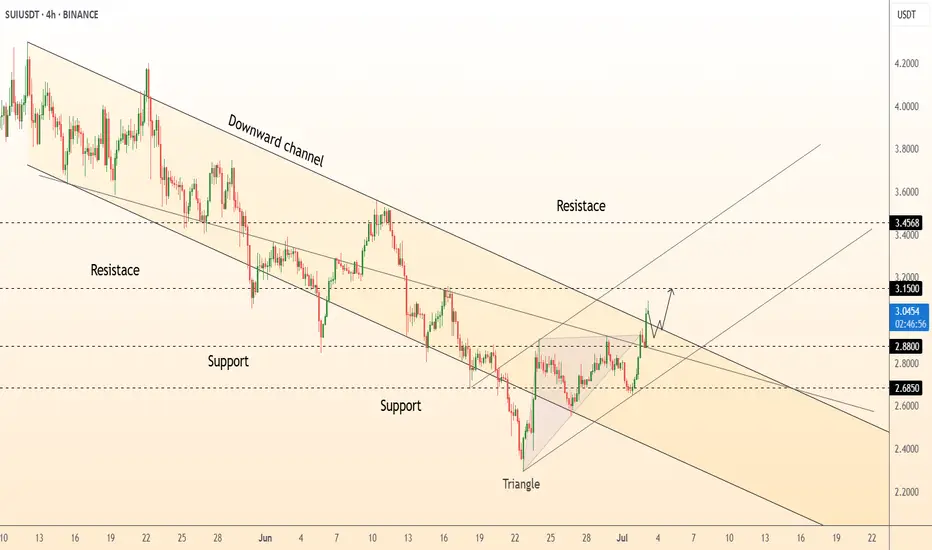
DeGRAM | SUIUSD got out of the channel📊 Technical Analysis
● Price pierced the four-week falling-channel roof and the apex of a contracting triangle, turning 2.88 support into a launchpad and carving a sequence of higher lows.
● Breakout measured move and channel mid-band converge at 3.15; a close above there exposes the next horizontal barrier and channel top at 3.46. Risk is framed by the former triangle base at 2.88 and major swing floor 2.69.
💡 Fundamental Analysis
● Sui’s on-chain TVL has climbed >15 % since 25 Jun after zkLogin main-net rollout and Mysten Labs’ new developer grants, underpinning demand despite broad market lethargy.
✨ Summary
Long 2.90-3.05; hold above 3.15 targets 3.46. Invalidate on a 4 h close below 2.88.
-------------------
Share your opinion in the comments and support the idea with a like. Thanks for your support!
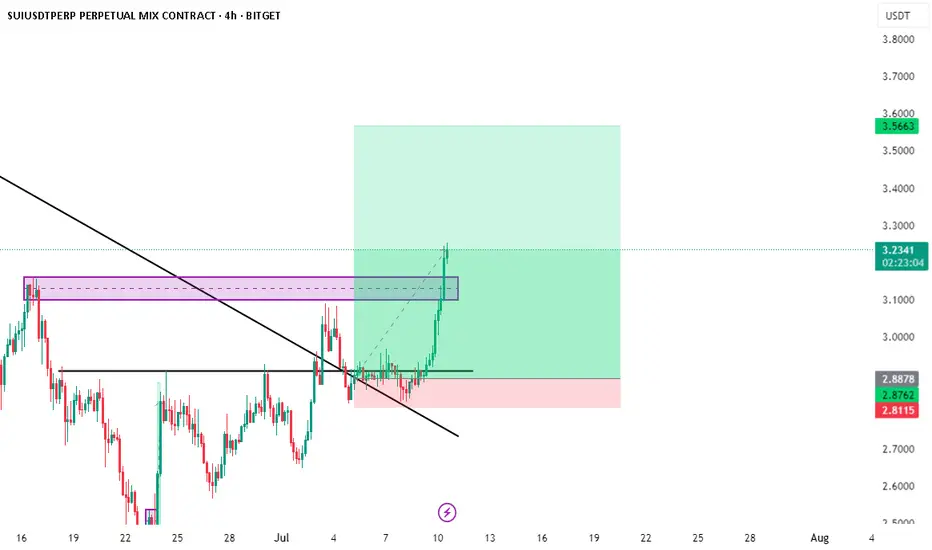
Trade Update – SUI/USDT✅ Trade Update – SUI/USDT
📅 July 11, 2025
🚀 Target almost fully hit on the 4H breakout move!
🔓 I’ve booked my profits here — solid R:R and clean breakout follow-through.
📉 Broke out of the downtrend
🔁 Retested previous resistance as support
📈 Strong bullish momentum took it straight to target
💰 Hope you’re in profit too if you followed this!
📌 Always manage your risk & lock in gains 🔐
📊 Chart speaks for itself 👇
Follow for more updates 🧠💸
#Crypto #SUI #Bitget #TradeUpdate #Breakout #TA
👉 Follow me on X for more sharp trades 🧠📈
@Ali15349323
$SUI breakout incoming?Looks like SUI is having strength IMO. I wonder if the breakout confirms and holds :O