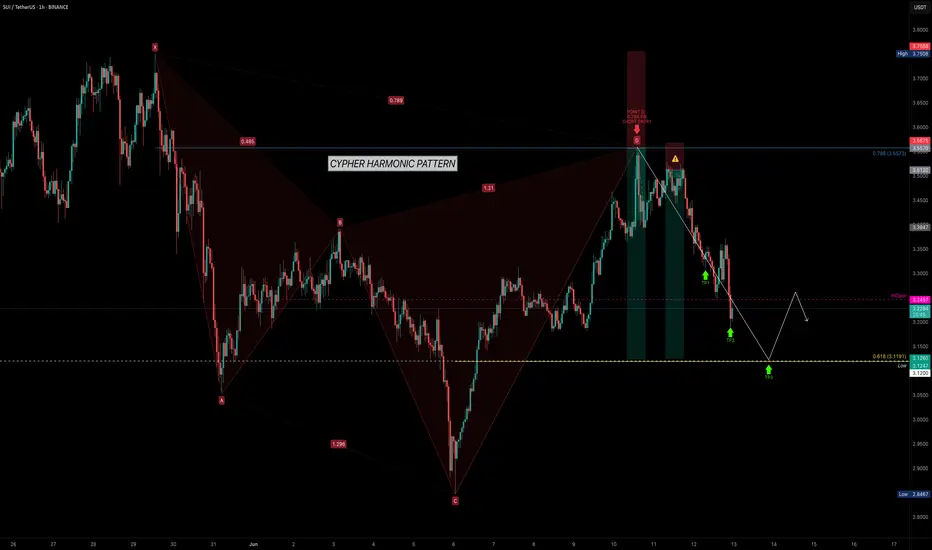
SUI — Trading with Geometry: Why Harmonics Work So WellSUI has been respecting technical levels with remarkable consistency. After bouncing from the $2.8467 low, it surged sharply — completing a clean Cypher Harmonic Pattern. This led to a high-probability short setup at the 0.786 Fibonacci retracement (Point D) around $3.5573.
🎯 Trade Setup Breakdown
Pattern: Cypher Harmonic
Entry (Point D): $3.5573 (0.786 retracement of XC)
Target: $3.1191 (0.618 retracement of CD)
Stop-Loss: Above Point X
The 0.618 fib retracement of the CD leg coincides with a significant key low from May 6, 2025, adding structural confluence. This is an ideal level to monitor for absorption, reaction, or potential reversal behaviour.
🧠 Educational Insight: How to Trade Harmonic Patterns Like a Pro
Harmonic patterns aren't just visually appealing — they represent high-probability setups based on market structure, Fibonacci geometry, and behavioural cycles. The most critical part of every harmonic pattern?
You enter at Point D.
Whether the pattern is bullish or bearish, Point D is your trigger:
In bearish patterns (like this Cypher), you short from Point D.
In bullish patterns, you long from Point D.
This works because Point D marks the exhaustion of the corrective leg, where trapped traders and liquidity often sit. The structure often aligns with supply or demand zones, order blocks, or FVGs (Fair Value Gaps).
💡 Important: Harmonic patterns are most effective on higher timeframes — 4H and above. On lower timeframes, noise increases and reliability drops significantly. For clean execution and meaningful structure, stay with mid to high timeframes.
Here’s how to trade it effectively:
✅ Wait for the full pattern to form — don’t front-run
✅ Use fib levels and structure confluence to validate Point D
✅ Use order flow tools (like Exocharts) to confirm absorption or volume shift
✅ Enter on Point D with your stop-loss just beyond X
✅ Take profits at common retracement levels like the 0.382 or 0.618 of the CD leg
Patience is key. Harmonic traders wait for the market to complete the cycle — then strike with a plan.
📌 Final Thoughts
SUI is delivering clean harmonic respect, and this setup is no exception. Whether you're already short or waiting for further confirmation, keep an eye on volume, liquidity zones, and reaction levels around $3.1191. If this zone holds, it may serve as a pivot for the next move.
Pattern. Precision. Patience. That's how you catch high-probability trades like this.
_________________________________
💬 If you found this helpful, drop a like and comment!
Want breakdowns of other charts? Leave your requests below.
SUIUSDT.P trade ideas
SUI - overhyped or does it have a FUTURE?⚡️ Hello everyone! So far, there has been nothing unexpected in Bitcoin for me personally to update the review. Let's take a look at one of the main altcoins of the season - SUI.
The project burst onto the scene very quickly, with some people writing it off when it hit $1. But it successfully reached $5+, which begs the question: what was that all about? A fleeting narrative or a new token of the future?
📊 Now the token has formed a flag, like many other projects on the market, and is effectively “nowhere.” Gradually approaching both sides of the slope, let's dig deeper to understand which direction a breakout is most likely.
I am not a fundamental expert, but I know that the number of network users is actively growing along with TVL. New projects are being launched and partnerships are being formed (Trump's WLFI).
❓ But what does the chart tell us?
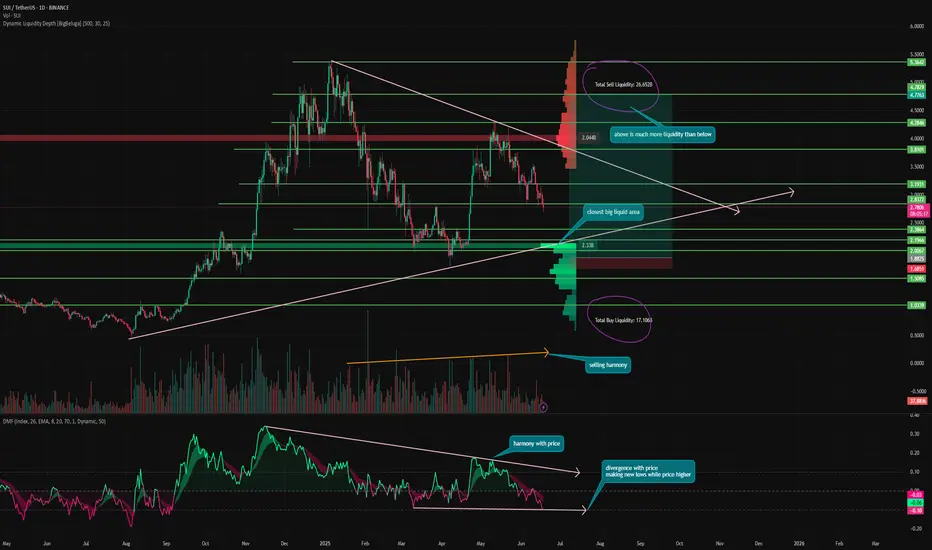
Money Flow - harmony with price. Positions are gradually closing, liquidity is leaving. But there is a divergence in the inflow, the indicator is already forming new lows, while the price is significantly higher than the previous low. This means that people are not yet ready to buy at the current price.
Liquidity Depth - there is currently significantly more liquidity concentrated at the top than at the bottom. This is understandable, as the token has been declining for a long time and is trading below its ATH, with a lot of shorts accumulated. And as we know, the price moves from one liquidity zone to another—that is its fuel. However, despite this, the nearest large liquidity cluster is at the bottom, at levels of 2.13 - 2.04.
Volume - one of the only tokens on the market where sales volumes remain harmonious even after 6 months of correction. The token grew for a very long time, many held on to it and are now continuing to take profits.
📌 Conclusion:
I believe the token clearly has potential. But it is too young, and it is difficult to determine its real value at this point. Many tokens that were a hit in 2021 are now, well, you know where...
So, I am currently considering SUI purely as a speculative asset, and the bear market will show who is who.
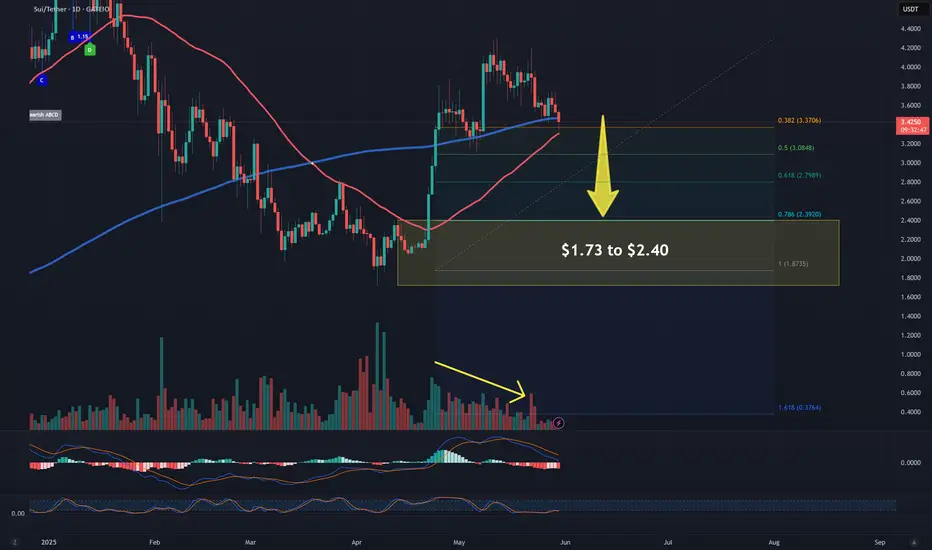
I believe that now, together with the entire market, we are going lower, removing liquidity from the 2.13-2.04 level. A correction below 1.7246 (previous low) is even likely.
📈 And from this zone, I begin to consider the possibility of a rebound and taking a long position.
Have a nice day, everyone!
Sui Update, Retest of Support; Bullish ConfirmedIt's been 9 days since my last Sui update. The chart looks good.
For context, see the previous analysis:
We started at the C wave of an ABC correction. There was an attempt to push prices higher but resistance was found at MA200. The resistance produced retrace and the same support zone is tested and holds. If a new advance develops here, which is exactly what is going to happen, then you can expect much higher prices next. This time around, MA200 as resistance will break, which means a new high. The highest prices in more than six months, since January 2025.
This is where the next move will take us and this is easy to predict now that support has gone through a retest and holds.
Namaste.
sui roadmapBased on the price movements and patterns created in this currency and the block order created, I predict bullish movements for SUI on the daily time frame.
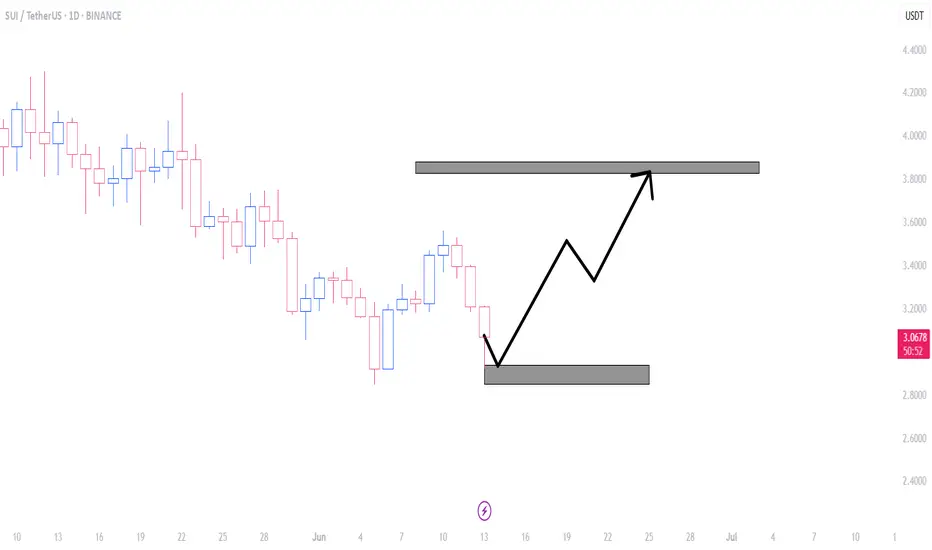
SUI landslide incomingSUI has lost support and has fallen below $3.55, and then failed to regain any ground above it repeatedly. The expectation is that it will hit the March 27 high of $2.82 and then possibly fall further.
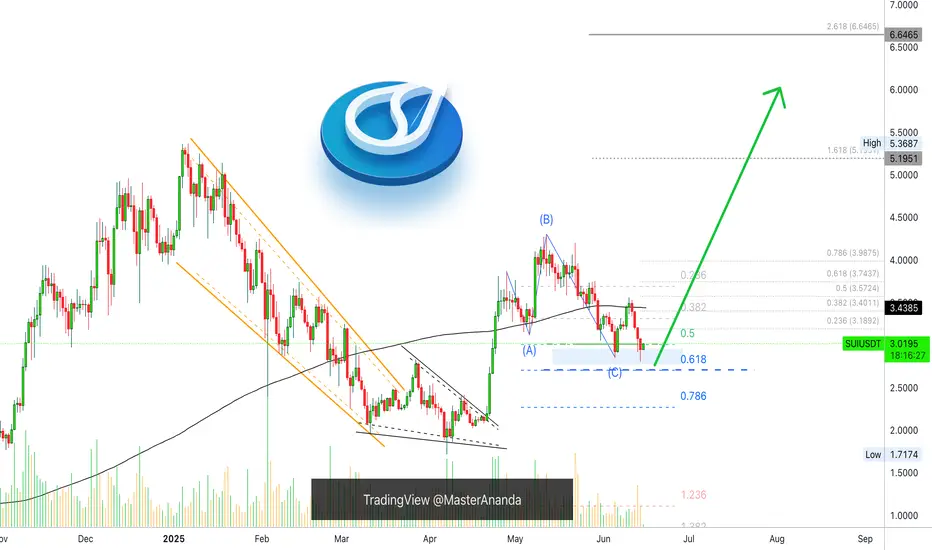
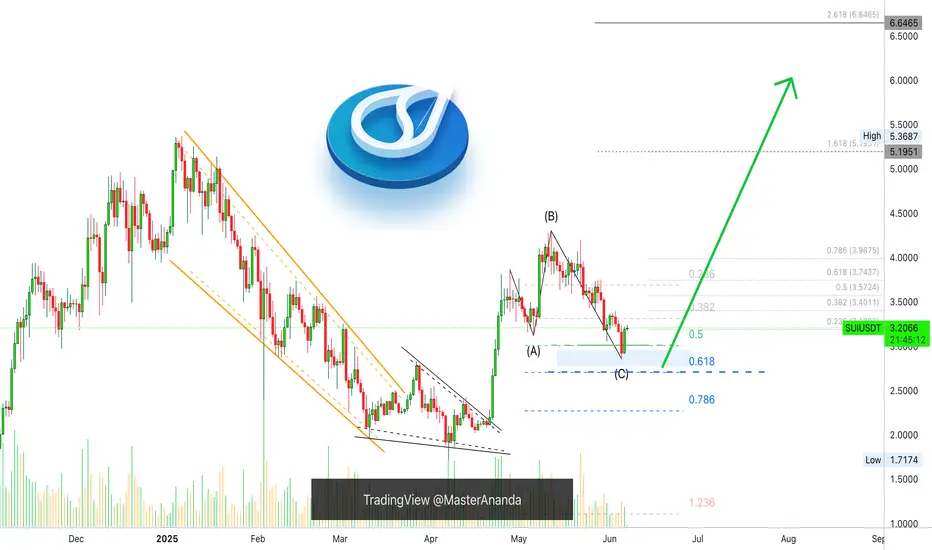
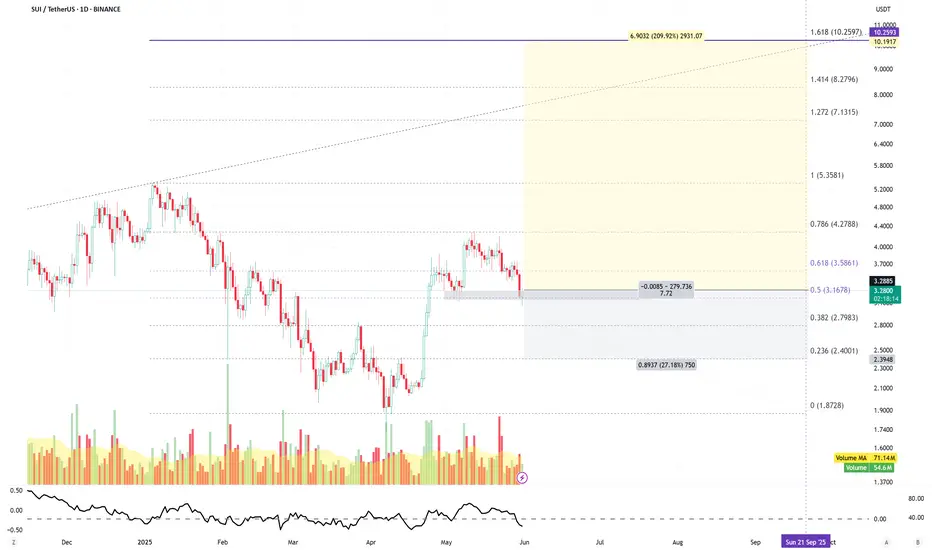
Sui Turning Green ($6.65 Target = 100%+ PP)Just like that Sui was red for 24 days. 24 days might not be that long but when you consider that the rise lasted 35 days, then yes, within this context it is a very long retrace... And look at the levels on the chart.
Support found at 0.5 Fib. retracement. This level was pierced followed by a recovery the next day. Double-bullish signal; the recovery and the fact that 0.618 wasn't tested.
I can honestly say that it is still early, but I can also say that this zone where the bounce just happened is a very strong classic support zone. This support zone can lead to the next leg-up, a strong rise with targets reaching $5.19 and $6.65.
The chart looks good for a new bullish wave. The $6.65 target means more than 100%. Taken from the 7-April low, we are talking about a 285% total growth, profits of course. And this wouldn't be the end, only the start.
SUIUSDT has much more to give. We can expect the market to turn and remained green.
Namaste.
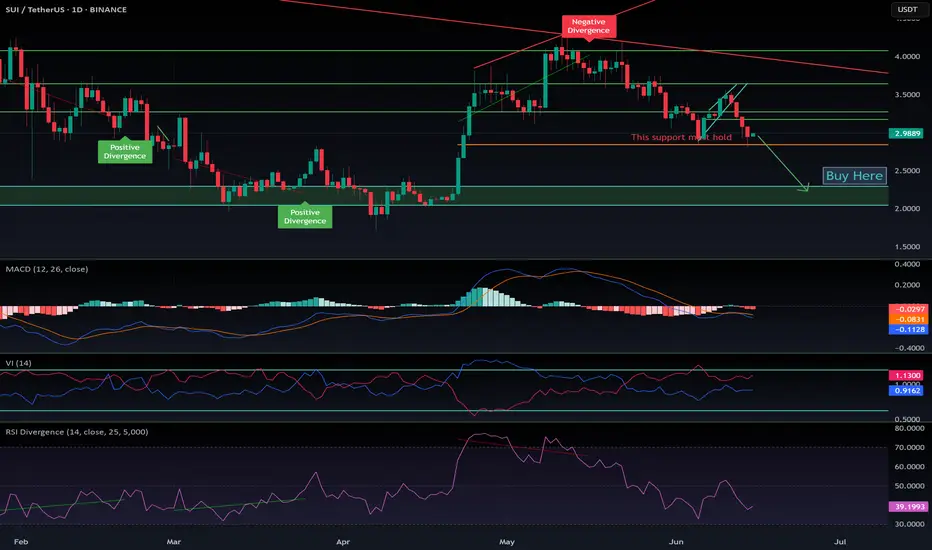
$SUI follow up for June 2025CRYPTOCAP:SUI has tapped my support zone around $2.85, which is currently holding well.
That said, the broader trend remains corrective, and it's likely only a matter of time before this support gives way.
If that happens, we could see a drop into my green buy zone — sitting just below a major order block. A break there might trigger heavy liquidations and a sharp move to the next support level.
I don't expect a deeper crash, as bulls are showing strong activity to defend this area.
If you set buy orders around this zone, a solid bounce could offer attractive profits.
As always, DYOR.
This is a follow up for this idea from May 2025
Sui cup and handleThanks to @leu76 i think we are going to make a cup and handle.
We just need to stay above the 0.5 fib.
Target to the 2 fib

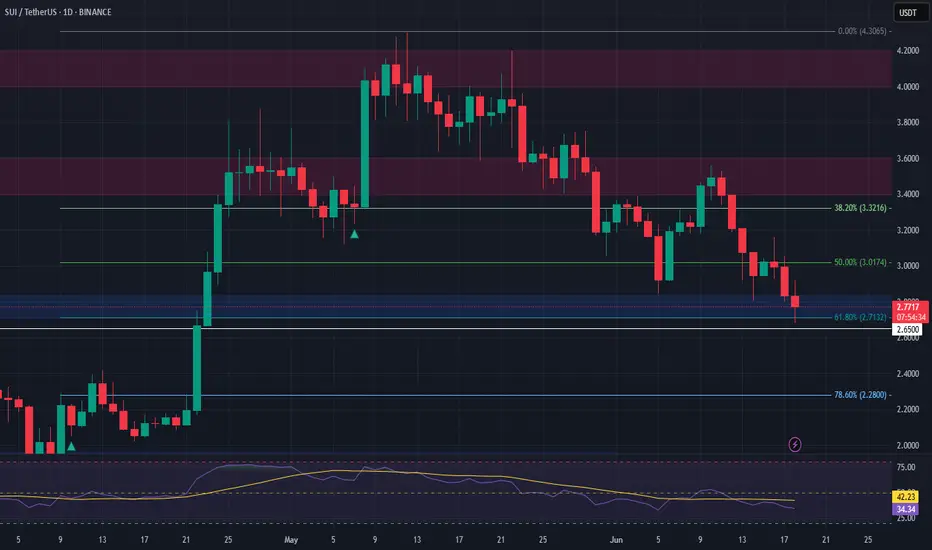
SUI Long Swing Setup – Confluence of Support and Fibonacci LevelSUI has pulled back into a key confluence zone, aligning with both the 61.8% Fibonacci retracement and horizontal support. We’re now eyeing the $2.70–$2.80 area for a potential long entry.
📌 Trade Setup:
• Entry Zone: $2.70 – $2.80
• Take Profit Targets:
o 🥇 $3.40 – $3.60
o 🥈 $4.00 – $4.20
• Stop Loss: Daily close below $2.65
Sui Update, Retest of Support; Bullish ConfirmedIt's been 9 days since my last Sui update. The chart looks good.
For context, see the previous analysis:
We started at the C wave of an ABC correction. There was an attempt to push prices higher but resistance was found at MA200. The resistance produced retrace and the same support zone is tested and holds. If a new advance develops here, which is exactly what is going to happen, then you can expect much higher prices next. This time around, MA200 as resistance will break, which means a new high. The highest prices in more than six months, since January 2025.
This is where the next move will take us and this is easy to predict now that support has gone through a retest and holds.


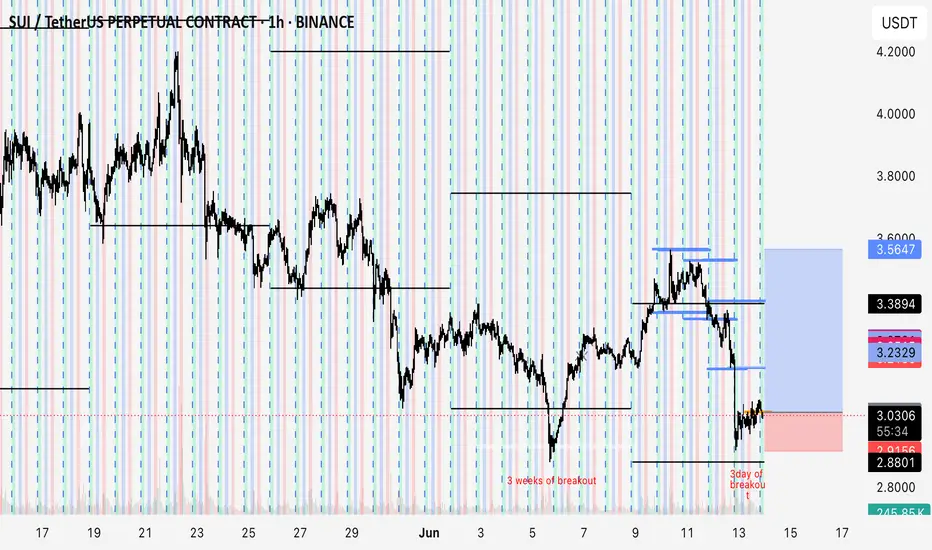
Last bounce for the weekStill have today and Tomorrow to close out the week so hopefully it will be clean and close in our direction. 3 weeks of breakout, Monday triggered the other direction but Wednesday started to go down and in Friday it became 3 days of breakout to the low . Saturday’s Asia open above yesterday’s session lowest high , pull back into it and I got an entry. 3 weeks of breakout + 3 day of breakout+ session turnover. Let see what happen. Either hit my SL or today closes in profit and I move stop to break even , the maximum hold is next Monday’s Asia open
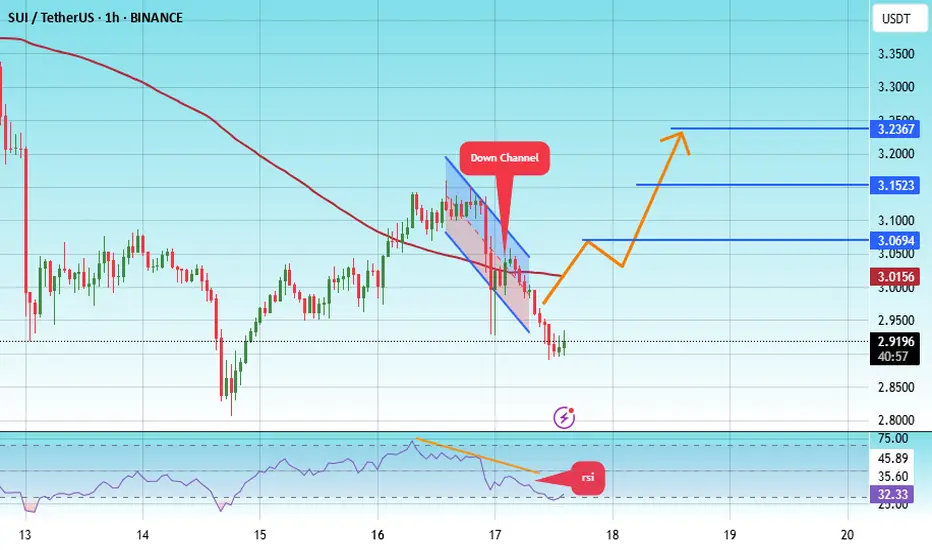
#SUI/USDT#SUI
The price is moving within a descending channel on the 1-hour frame, adhering well to it, and is heading toward a strong breakout and retest.
We are experiencing a rebound from the lower boundary of the descending channel, which is support at 2.90.
We are experiencing a downtrend on the RSI indicator that is about to break and retest, supporting the upward trend.
We are heading toward stability above the 100 Moving Average.
Entry price: 3.00
First target: 3.07
Second target: 3.15
Third target: 3.24
SUI MAJOR BUY ZONESUIUSDT rejected from marked supply zone and looks to dump more as well. So Major buy zone is around 2.15-2.30. Keep eyes on that level.

Buy SUISui is a Layer 1 blockchain developed by Mysten Labs, founded by former Meta engineers who previously worked on the Diem blockchain and the Move programming language. Launched in May 2023, Sui aims to provide high-speed, low-cost transactions with a focus on scalability and user-friendly features, making it suitable for applications like decentralized finance (DeFi), gaming, and non-fungible tokens (NFTs).
Current prices are at Fib 0.5, a strong support. As a result, a Long setup (with a good RR ratio) is as in chart.
Disclaimer:
This analysis is based on my personnal views and is not a financial advice. Risk is under your control.
#SUI/USDT Analysis 📊 #SUI/USDT Analysis 📊
CRYPTOCAP:SUI just swept the PML as a classic Turtle Soup setup — right inside the Weekly FVG 🐢
🔻 For shorts: I wanna see a Monday high sweep & tap of the bearish OB
🔺 For longs: Looking for Equal Lows to be swept + a tap into the OTE level for confirmation

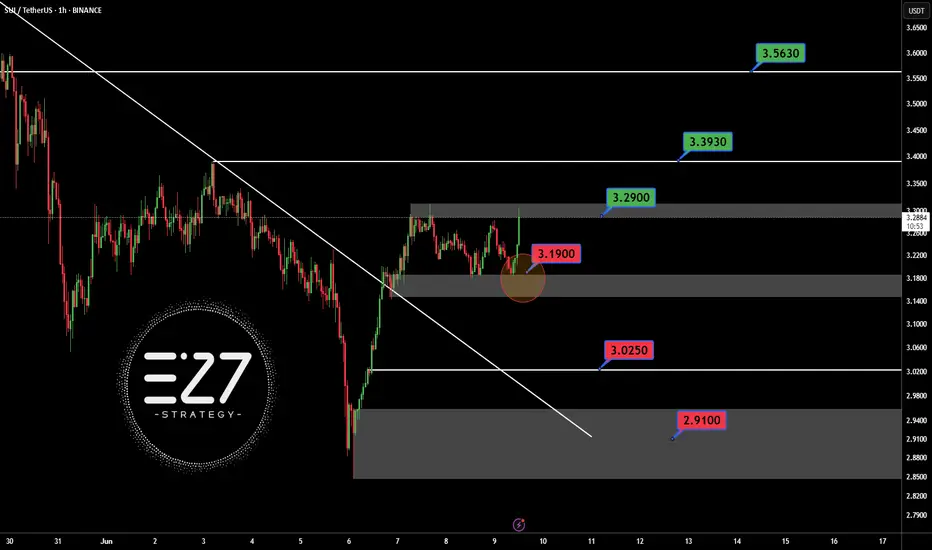
SUIUSDT3.19$ best price for pollback need for pump BINANCE:SUIUSDT . but for trust bullish trend, need for breaked 3.29$.
Best support: 3.025 - 2.91 $
Best resistance: 3.29 - 3.393 - 3.563 $
Contorl Risk management for trades.
$SUI: $2.95 must hold!CRYPTOCAP:SUI is following the broader altcoin market and entering a correction phase. As shown in the chart, CRYPTOCAP:SUI has already broken through two key support levels and is now hovering just above a critical support at $2.95.
If this level fails to hold, the next major support lies within my green box at $2.20 — which could present a strong buying opportunity.
However, proper risk management is essential — make sure to place your stop losses accordingly.
DYOR (Do Your Own Research).
#SUI #Altcoins #CryptoCorrection #SupportLevels #BuyTheDip #CryptoTrading #TechnicalAnalysis #DYOR
DYOR

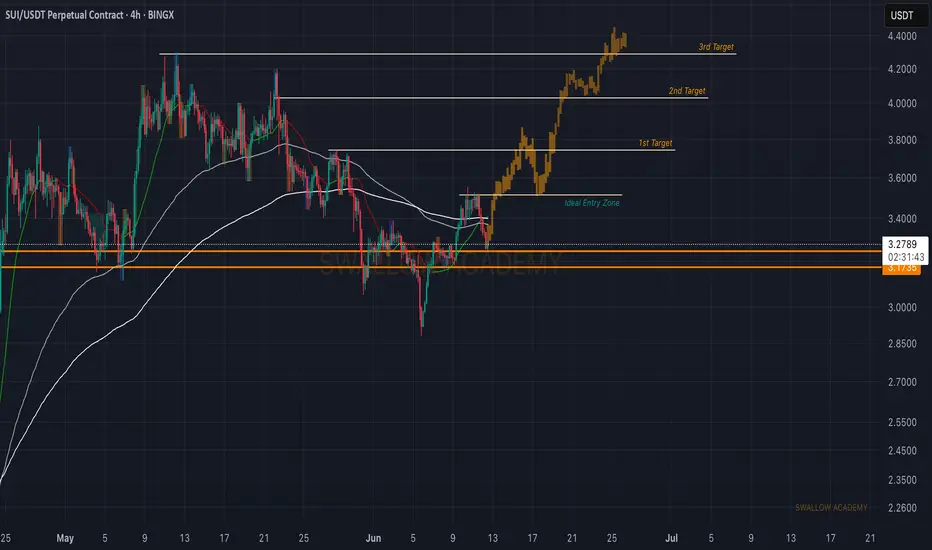
Sui (SUI): Targeting $4.20 | Bullish ScenarioWe are seeing the possibility for upward movement here, which could result in +20% of market price movement from our entry.
As of now it is too early yet to talk about any bullish movement here so we are waiting patiently for a proper breakout from our entry area, which would then give us a proper chance for bullish movement from there.
Swallow Academy
SUIUSDT 1D Analysis SUI ~ 1D Analysis
#SUI Buy gradually from this support block with short term target of at least 15%+, Long term target $11

SUI – Prepping for New Highs
CRYPTOCAP:SUI showing clear signs of strength after that reaction at $3.
Starting to build a position here and will add more on a potential Monthly retest—if it comes.
Expecting this to push above $6 and enter price discovery in the next two months.
Could follow a similar path to its October 2024 – January 2025 move. BINANCE:SUIUSDT

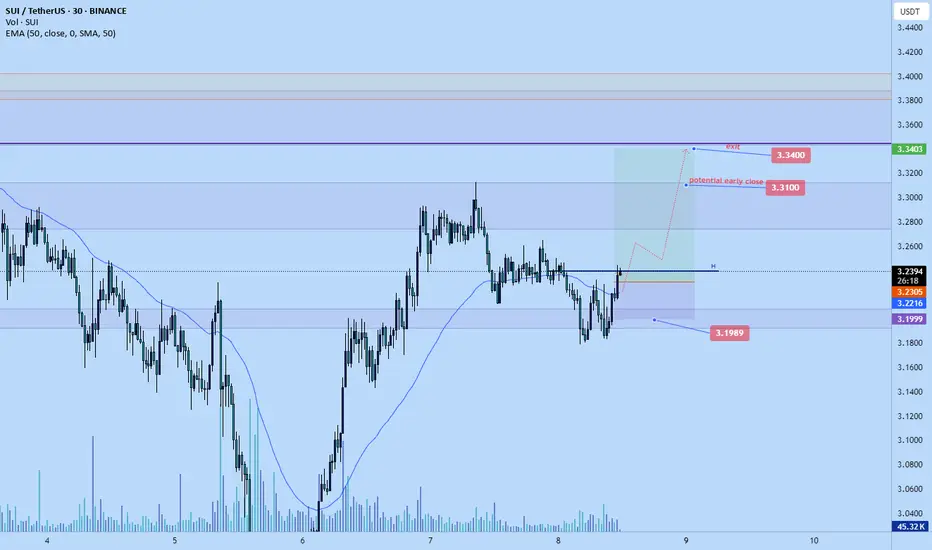
Sui long to $3.34 are todaySui long to $3.34 possibly today.
Looks like the correction is coming to an end.
Aiming for the highs. On higher tif $3.34 is also daily LH. If market ought to flip bck bullish on the daily it will need to pump pass there.
Roughly 3.6RR for full tp
Stop: $3.1989 or lower
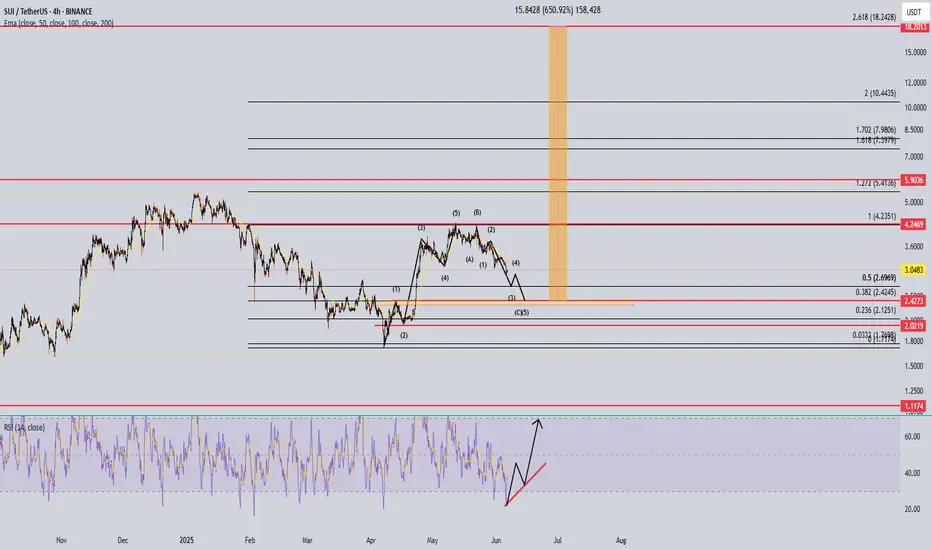
SUI 650% trade coming up??5 waves up, now correcting. I think it will bounce from the 2.42 area. Nice 650%
Now tring to count 5 waves down for the wave C.
I also see it could bounce from the 0.5 fib and make a cup and handle, but the cup isnt that round. So yeah 2.42 would be my buy zone.