Sui Update · Support Found, Moving AveragesWe will focus solely on the chart. As a move happens, there are always fluctuations, down and up. What determines the trend is not the short-term but the broader market move. When a pair is producing higher highs and higher lows, we are growing and going up. If there is a drop short-term, this is nothing more than a retrace because prices (profits) are rising mid- and long-term. This is the current situation and has been true for many months.
Each time Sui retraces, it finds support and then continues to grow.
SUIUSDT peaked 28-July, now five days ago. A classic retrace because after this date all days are red. Facing resistance led to immediately to a test of support. A test of support tends to lead to a new challenge of resistance.
SUIUSDT is working support at EMA89 and EMA55 daily, the same levels we had active on the last update. These levels seen to be holding strong so far and if they hold, we can see growth right away. Normally, support tends to be pierced briefly and then the market turns. So anything goes.
We can see a reversal happen now, or it can take a few days at most. The action is already happening at support and within a higher low. It can move a bit lower, but we are getting ready for the next bullish jump. This one will be a surprise and it will bring the entire market up. No excuses, no reason, just up.
Namaste.
SUIUSDT trade ideas
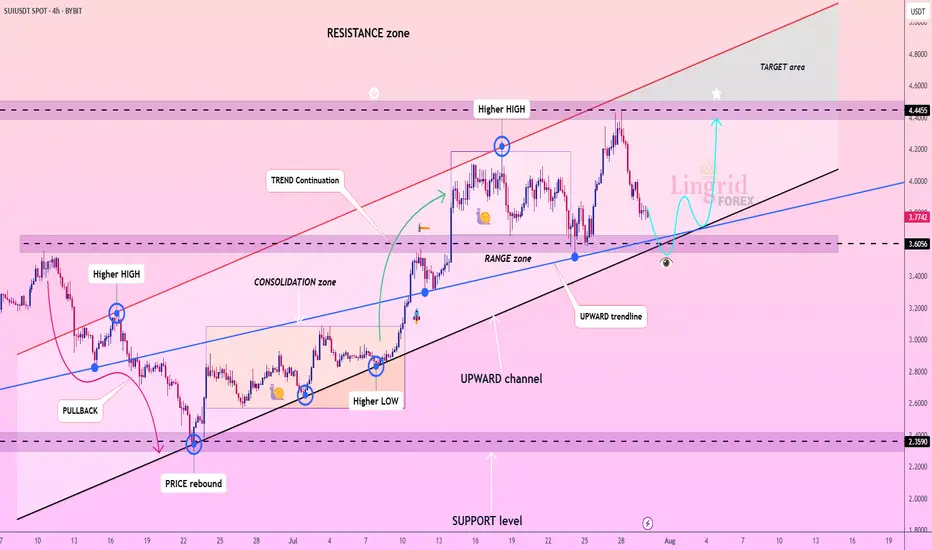
Lingrid | SUIUSDT Approaching Key Level for Potential LongBINANCE:SUIUSDT has pulled back from the 4.44 resistance but remains within a well-defined upward channel, holding above the 3.60 support zone. The structure shows higher lows with price hovering around the blue upward trendline, indicating ongoing bullish momentum. As long as 3.60 holds, buyers may regain control and push price back toward the 4.44 resistance and beyond. Momentum favors continuation as the consolidation phase near support suggests accumulation.
📉 Key Levels
Buy trigger: Break and close above 3.85
Buy zone: 3.60–3.70
Target: 4.44
Invalidation: Drop below 3.26
💡 Risks
Failure to hold above 3.26 could trigger deeper pullback.
Resistance near 4.44 may cause rejection.
Low market volume could delay breakout attempts.
If this idea resonates with you or you have your own opinion, traders, hit the comments. I’m excited to read your thoughts!
SUI Approaching Major Buy Zone: A High-Confluence Long SetupHello, traders. Today, we're putting SUI under the microscope as it undergoes a sharp but healthy correction following an impressive rally. The price has recently broken below its short-term moving averages, and is now heading directly towards a powerful cluster of technical support. This is a classic "buy the dip" scenario unfolding.
This analysis will provide a step-by-step breakdown of why the $3.60 - $3.70 zone represents a high-probability area for this corrective move to end, and for the primary bullish trend to resume.
The Analysis: A Convergence of Powerful Signals
The strongest trade ideas are not based on one signal, but on multiple, independent factors aligning. Here is the powerful confluence we are observing on the SUI 4H chart:
1. The Primary Bullish Structure:
First, let's establish the market context. The Zig-Zag indicator confirms that the primary market structure is firmly bullish, with a clear series of higher highs and higher lows. The current move is a textbook corrective pullback within this uptrend. Our goal is not to fight the trend but to identify the most logical point for it to continue.
2. The Key Support Cluster (Order Block + EMA 200):
The price is approaching a major floor of support. This floor is composed of two critical elements:
Demand Zone / Order Block: There is a significant demand zone (the blue-shaded box) sitting between $3.60 and $3.70. This is an area where strong buying pressure previously entered the market, and it's likely to act as a solid support level.
The EMA 200: Flowing directly through this demand zone is the EMA 200. This long-term moving average is one of the most significant dynamic support levels in an uptrend. The confluence of a static order block with the powerful EMA 200 creates an incredibly strong support cluster.
3. Multi-Timeframe Momentum Exhaustion (The Key Timing Signal):
This is the crucial timing component. While the price is dropping, our momentum dashboard reveals that sellers are becoming exhausted.
MC Orderflow: The oscillator in the sub-chart is plunging towards the green "Oversold" area, signaling that the downward momentum is getting stretched.
The Dashboard: This gives us a panoramic view of momentum. The 30M, 1H, and 4H timeframes are all simultaneously flashing "Oversold". This is a critical piece of information. It tells us that selling pressure is exhausted across multiple key timeframes, precisely as the price is about to hit a major support cluster. This is a classic recipe for a sharp reversal.
The Potential Trade Plan
Based on this powerful alignment of signals, here is a potential trade plan:
Entry Zone: The support cluster between $3.60 and $3.70 is the ideal zone to look for entries.
Stop Loss: A logical stop loss could be placed just below the demand zone and the EMA 200, around $3.55. A break below this level would invalidate the bullish structure.
Potential Targets:
Target 1: A reclaim of the Daily Open at $3.91.
Target 2: The intermediate resistance and recent swing high in the $4.15 - $4.25 area.
Target 3: A full retest of the major high at $4.45.
Conclusion
We are witnessing a textbook technical setup on SUI. The price is correcting within a confirmed uptrend and is now approaching a massive confluence of support (Order Block + EMA 200), all while multi-timeframe momentum indicators are signaling widespread seller exhaustion. This presents a compelling, high-probability case for a long position.
Disclaimer:
This analysis is for educational purposes only and is not financial advice. Trading cryptocurrencies involves a high level of risk. Always conduct your own research and consult with a licensed financial advisor before making any trading decisions.
SUI/USDT – Price Outlook (2H TF)🔍 Updated Aug 4, 2025 | SMC + NeoWave
SUI has broken out of the descending channel and is currently holding above the strong demand zone around $3.35–$3.40. This zone overlaps with a bullish order block and prior trendline support.
📌 Bullish Scenario (preferred):
Price confirms support → Push toward $3.90–$4.00 supply zone.
📌 Invalidation:
A close below $3.35 invalidates the setup and suggests continuation of the correction.
💡 Tip: A breakout of structure (BOS) + mitigation of OB = solid confluence for long setups.

SUI Swing Buy / Long SetupSui is on Strong and decision Order block on 1 day Timeframe, If we break this then SUI will take correction till recent weekly low. If we hold this then new ath. Book some or 80% on mentioned area, rest hold till 6$.

SUI LONGFollowing a significant decline, the asset will take support and bounce back from this point.
Disclaimer: This is not financial advice.
This algorithm provides highly precise buy and sell signals with alerts:

#SUI TRADE PLAN Closely monitoring the trade. Would update once a decision candle is formed.
Keep watching

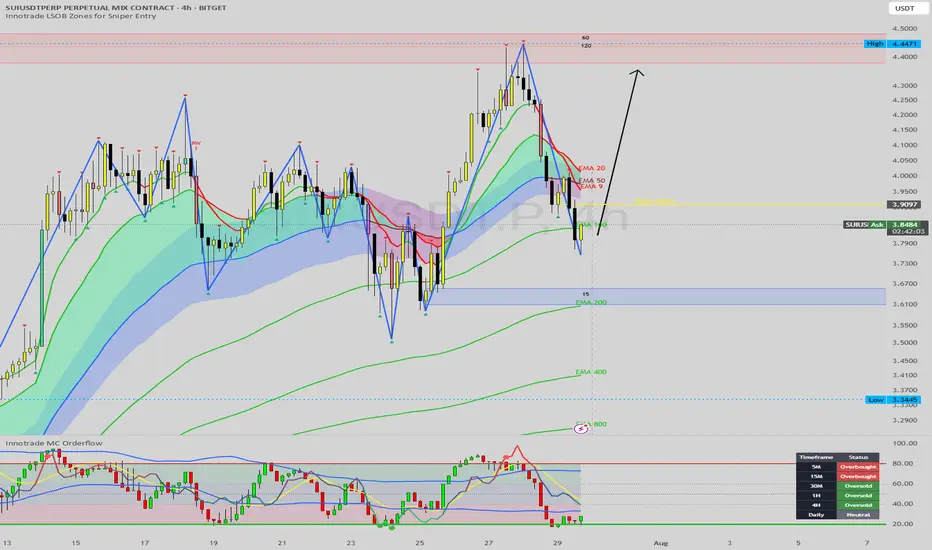
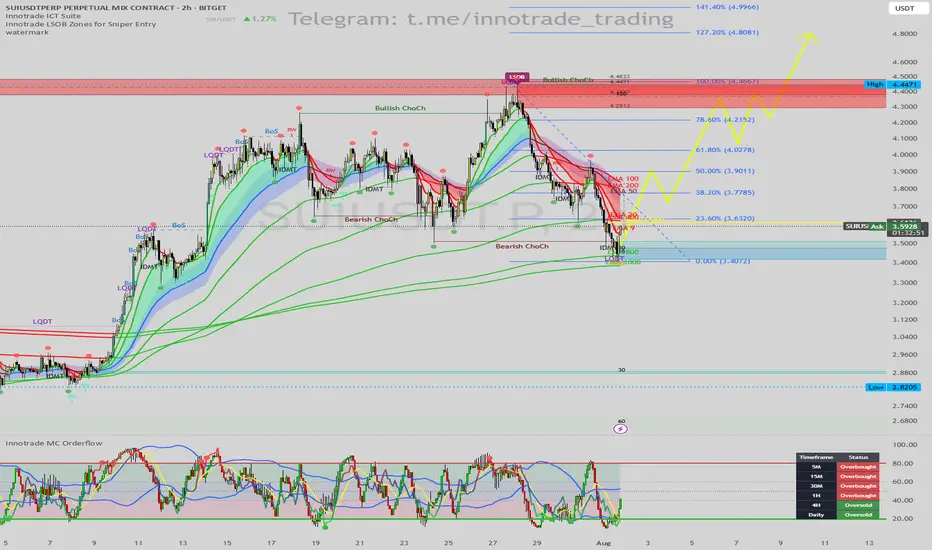
SUI/USDT: Prime Long Setup from LSOB Demand & Daily OversoldHello traders,
This analysis highlights a high-probability long setup on SUI/USDT (2H Chart). The current price action presents a classic institutional-style reversal pattern, strongly confirmed by momentum indicators signaling a bottom may be in.
1. Trend & Context (The "Why")
While the short-term trend has been corrective after a "Bearish ChoCh," price has now entered a major area of interest where a powerful bullish move could originate.
Here is the confluence checklist:
Primary Signal (LSOB Zone): Price has tapped into a key Bullish LSOB (Liquidity Sweep Order Block). This is a critical demand zone where smart money is likely to absorb selling pressure and initiate long positions.
Liquidity Sweep Confirmation: The price action confirms this with a clear Liquidity Sweep (LQDT), where the price wicked down to take out stops below the previous lows before reversing. This is a very strong bullish signal.
Momentum Exhaustion (MC Orderflow): This is where the setup gains its highest conviction:
The MC Orderflow oscillator is in the EXTREME OVERSOLD territory, indicating that sellers are exhausted.
CRITICAL MTF CONFLUENCE: The Multi-Timeframe Cycle Table is showing that both the 4H and Daily timeframes are "Oversold." This alignment of higher timeframe momentum with our 2H demand zone is the most powerful confirmation for this trade.
2. Entry, Stop Loss, and Targets (The "How")
This confluence provides a clear and structured trade plan with excellent risk-to-reward potential.
Entry: An entry around the current price ($3.50 - $3.58) is ideal, as we are in the LSOB demand zone. For a more conservative entry, one could wait for the 2H candle to close bullishly.
Stop Loss (SL): $3.38. This places the stop loss just below the low of the liquidity sweep wick. If this level is broken, the bullish setup is invalidated.
Take Profit (TP) Targets:
TP1: $3.90 (Targeting the cluster of short-term EMAs and the recent swing high).
TP2: $4.28 (The next major structural resistance).
TP3: $4.45 (The major swing high, which is also a Bearish LSOB supply zone).
Conclusion
This trade presents a superb opportunity due to the powerful combination of a price-action sweep into a key demand zone (LSOB), confirmed by severe multi-timeframe momentum exhaustion. This alignment across indicators points towards a high-probability bullish reversal.
Disclaimer: This is not financial advice. This analysis is for educational purposes only. Always conduct your own research and manage your risk appropriately.
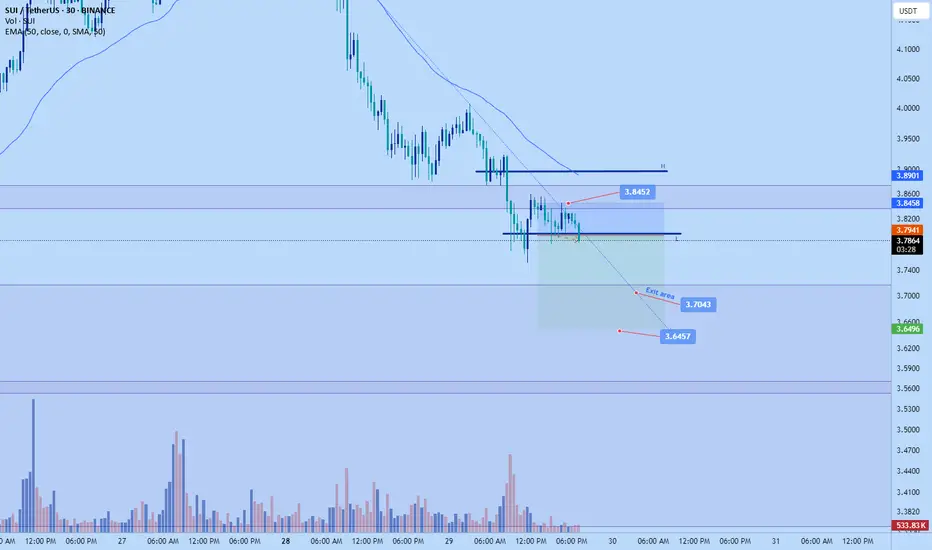
Sui short 3.7 or lowerjust hopped into a sui short
sl: $3.8452
tp area: $3.7043 and lower
Anticipating an impulsive push down tonight before spike back up
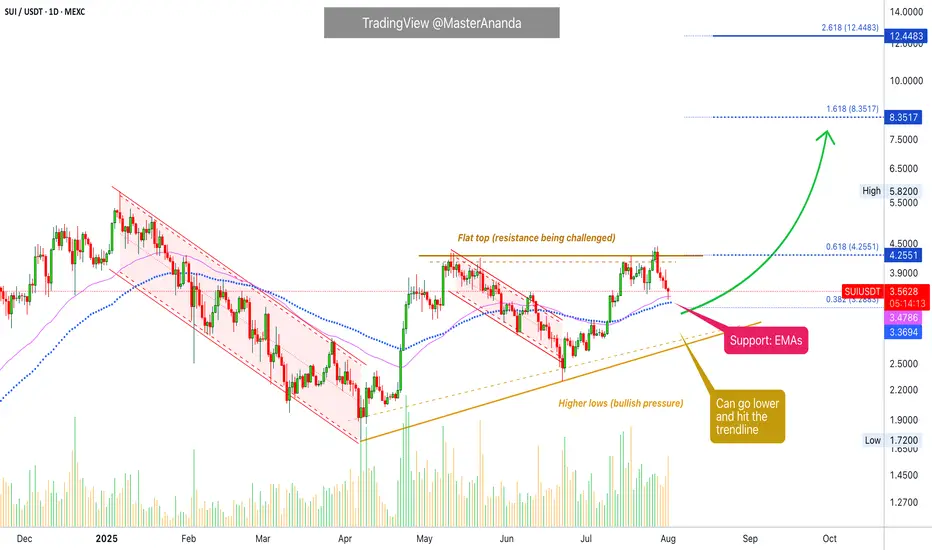
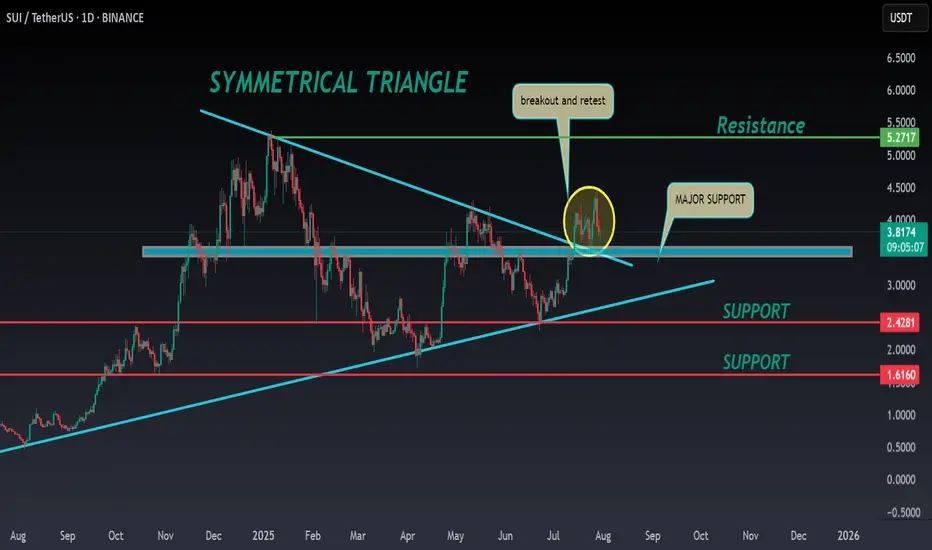
SUI ANALYSIS🔮#SUI Analysis 💰💰
#SUI is trading in a symmetrical triangle in a weekly time frame and if it breakouts with high volume then we can see a bullish momentum in #SUI. Before that we will see little bit bearish movement towards its support zone and that a bullish movement.
🔖 Current Price: $3.81
⏳ Target Price: $5.27
⁉️ What to do?
- We can trade according to the chart and make some profits in #SUI. Keep your eyes on the chart, observe trading volume and stay accustom to market moves.💲💲
🏷Remember, the crypto market is dynamic in nature and changes rapidly, so always use stop loss and take proper knowledge before investments.
#SUI #Cryptocurrency #Pump #DYOR
#SUI/USDT Update – Bounce Setup from Demand Zone?#SUI
The price is moving within a descending channel on the 1-hour frame and is expected to break and continue upward.
We have a trend to stabilize above the 100 moving average once again.
We have a downtrend on the RSI indicator that supports the upward break.
We have a support area at the lower boundary of the channel at 3.27, acting as strong support from which the price can rebound.
We have a major support area in green that pushed the price higher at 3.20.
Entry price: 3.38
First target: 3.58
Second target: 3.65
Third target: 3.80
To manage risk, don't forget stop loss and capital management.
When you reach the first target, save some profits and then change the stop order to an entry order.
For inquiries, please comment.
Thank you.

SUI 8H – Trendline Bounce Into Layered Supply ZonesSUI just respected a multi-week ascending trendline on the 8H chart — marking its third major touch since June. After a strong bounce from the $3.35 region, price is now moving with momentum, aiming toward two clearly defined supply zones stacked above.
The structure sets up a textbook bullish continuation play, with confluence from Stoch RSI flipping upward and trendline support staying intact.
🔍 Key Zones:
– Trendline Support: Untouched since mid-June
– First supply zone (~$3.95–$4.10): Initial retest target
– Second supply zone (~$4.40–$4.65): Key breakout trigger zone
– Stoch RSI just reset and is now pushing upward = momentum confirmation
A clean rejection at the first box would suggest chop or potential fakeout — but a break and retest could open the door to retesting highs above $4.80+.
This chart tells a simple story: trend is still intact, and bulls are in control — unless proven otherwise.
👇 Bullish? Bearish? Let’s hear your take.

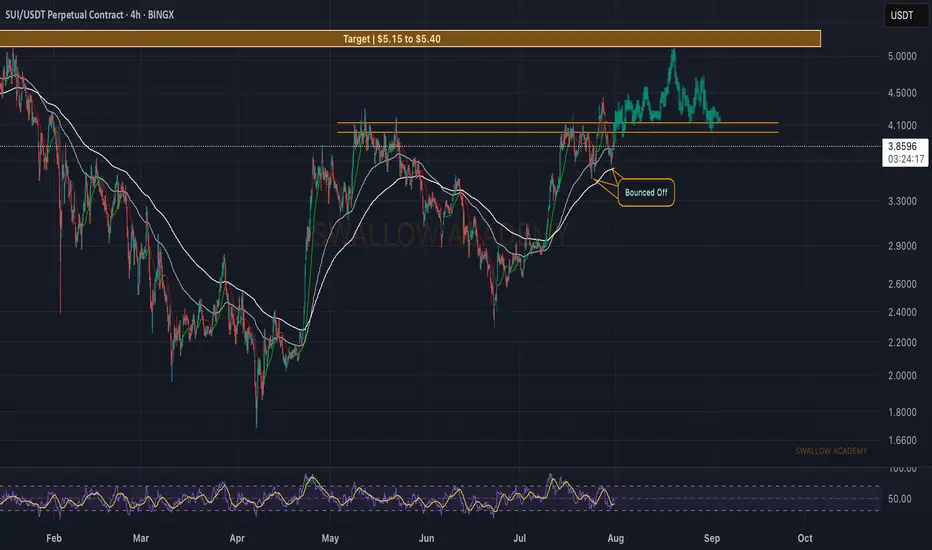
Sui (SUI): Looking For Breakout | Potential Move To $5.40!SUI is still hovering near our local resistance line, where since last time we had one breakout but failed one, which led the price back to EMAs, where we bounced off from.
We still see upside potential here so if we get another breakout attempt, most likely it will be the last one, before going for the $5.40 zone.
Swallow Academy
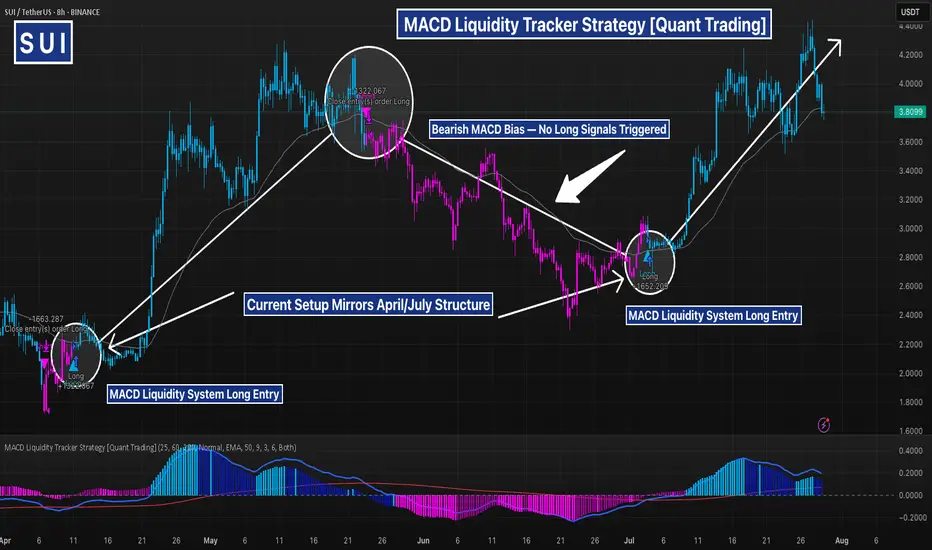
SUI 8H – Liquidity Tracker Signals a Third Major Leg Higher?The MACD Liquidity Tracker Strategy continues to deliver precise trend entries and exits on SUI, with another textbook setup potentially forming. The system has already caught two clean long cycles since April — each triggered after MACD histogram reversal and confirmed trend structure.
What stands out is how well the system avoids chop: during the magenta (bear-biased) zone from May to early July, no long entries were triggered despite volatile bounces. This highlights the strategy’s strength — it filters noise and only fires when true momentum aligns with structural breakout zones.
We're now in what could be the early stages of a third bullish cycle. The latest long entry (circled) followed a deep reset in both price and MACD, similar to April and July before the last rallies. Price has now cleared its EMA filter and is attempting to hold above $3.80–4.00.
MACD histogram shows early signs of momentum rebuilding, and if price holds this level, there’s potential for continuation toward $4.80+. If momentum fades here, a retest of $3.50 remains possible before any further upside.
📊 Strategy Settings Used:
– MACD: 25 / 60 / 220
– EMA Filters: 50 & 9 (Normal Mode)
– Entry Logic: MACD momentum + trend alignment
– Visual Bias: Blue = Bullish, Magenta = Bearish
⚠️ Key to this system is patience — waiting for full signal alignment instead of anticipating. So far, this strategy has rewarded discipline with high-conviction moves.
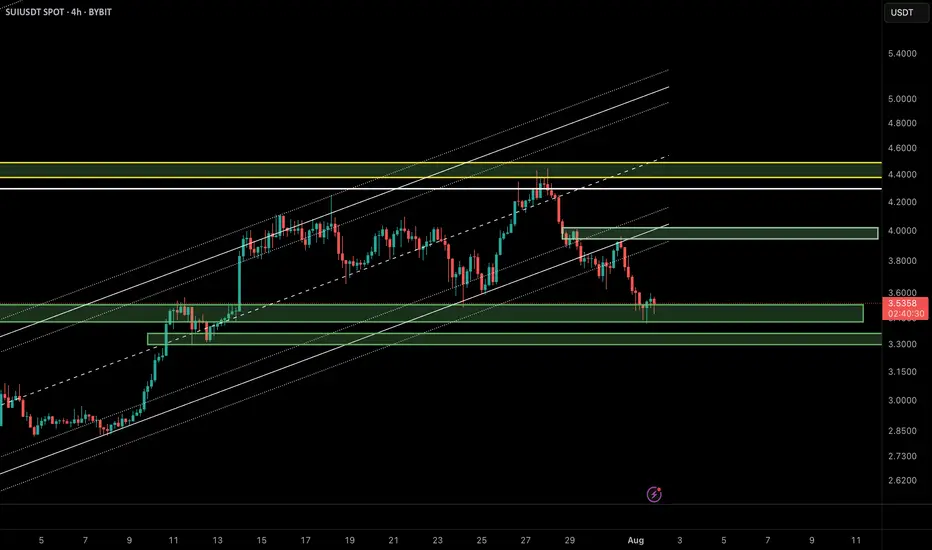
SUI/USDT Update – Bounce Setup from Demand Zone?In the previous analysis, we highlighted a short opportunity near $4.20, which played out perfectly. Now, SUI has reached a key demand zone around $3.40–$3.55, overlapping with the lower boundary of the ascending channel and a previously defined bullish order block.
🔹 Market Structure:
After breaking the bullish structure, price is now revisiting a major liquidity zone between $3.40 and $3.55.
🔹 Price Behavior:
Wicks to the downside suggest buy-side absorption and potential for short-term reversal.
🔹 Possible Scenario:
If the $3.40 zone holds, we could see a corrective move up to the supply zone around $3.90–$4.00.
📌 Key Levels:
• Support: $3.40–$3.55
• Resistance: $3.90–$4.00
❗️If the $3.40 support fails, bullish momentum will likely be invalidated in the short term.
🧠 Pro Tip (SMC-based):
When a demand zone aligns with liquidity sweep and channel support, it often becomes a high-probability area for institutional re-entries. Wait for a clear confirmation like BOS or bullish engulfing candle before entering.
⸻
🔗 Like, share, and follow for more Smart Money & Elliott Wave-based insights!
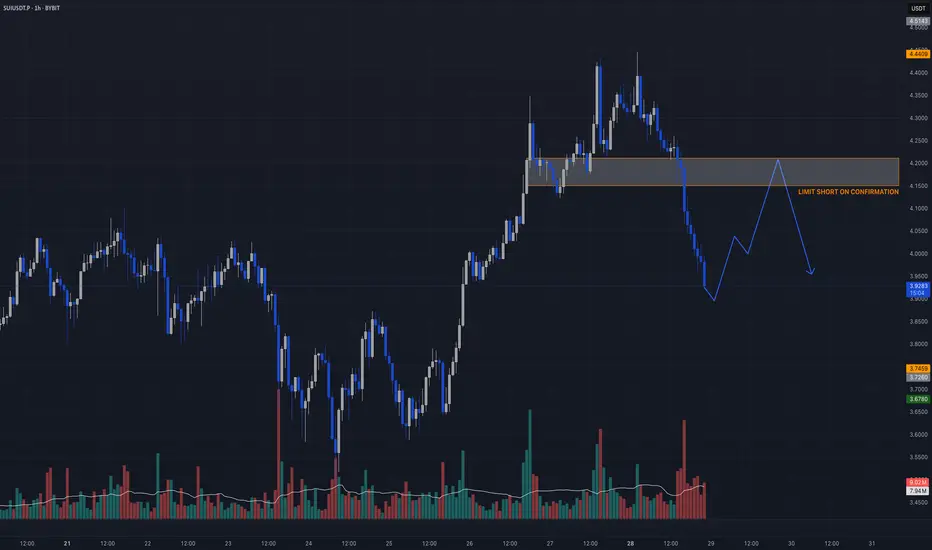
$SUIUSDT.P – INTRADAY SHORT IDEAAfter the impulsive sell-off, we’re eyeing a short entry on a potential rally into the FVG + prior support zone between $4.10–$4.20. No need to chase — let price return to our level of interest and confirm weakness.
🎯 Direction: Short
📍 Entry Zone: $4.15–$4.20
🩸 Stop Loss: $4.50
💸 Take Profits:
TP1: $3.20
TP2: $2.80
🧠 Setup Logic:
– Price broke down impulsively, leaving inefficiency behind
– $4.10–$4.20 = prior support + fair value gap
– Watching for M5–M15 CHoCH/BOS on retest
– Funding spike on bounce = ideal short trigger
This is not a blind short — wait for structure shift confirmation on the LTFs.
Candle Craft | Signal. Structure. Execution.
SUI 4H – Rejected From Resistance, But Fib Golden Pocket NearSUI just cleanly rejected from a major supply zone near $4.40 — now pulling back into a deep retracement zone that’s historically acted as support.
The 0.5–0.786 Fibonacci levels align perfectly with a previous structure zone, making this a key area for potential bounce setups.
🔹 0.5 = $3.09
🔹 0.618 = $2.77
🔹 0.786 = $2.31
Momentum indicators like Stoch RSI are also rotating downward, suggesting room for a full reset.
⚠️ If buyers step in at the golden pocket, expect volatility. If not — we could revisit May’s lows.

SUI’s Next Big Move? Key Levels You Must WatchHey friends, it’s Skeptic 🩵
In this video, I’m diving into the current setup on SUI – whether to long or short, plus an update on market context and risk zones.
I broke down key levels, previous triggers, and what price action is hinting at next.
This one’s packed with insights, especially if you're in futures or looking for an entry on spot.
⚠️ Don’t forget about risk management – chasing pumps is a recipe for FOMO and mistakes.
💬 Let me know your thoughts on SUI in the comments, and let’s talk setups.

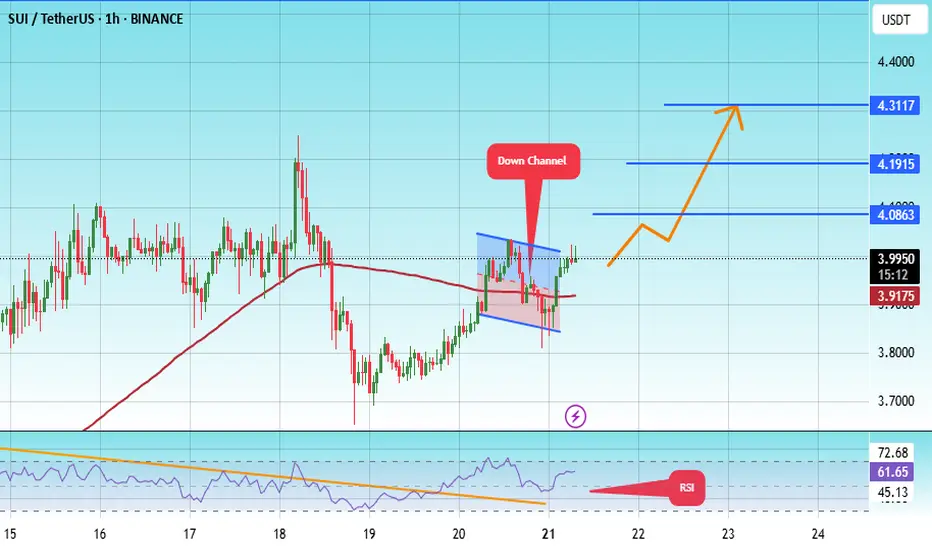
#SUI/USDT potentail to 4.30 $#SUI
The price is moving within a descending channel on the 1-hour frame, adhering well to it, and is on its way to breaking strongly upwards and retesting it.
We have support from the lower boundary of the descending channel, at 3.85.
We have a downtrend on the RSI indicator that is about to be broken and retested, supporting the upside.
There is a major support area in green at 3.80, which represents a strong basis for the upside.
Don't forget a simple thing: ease and capital.
When you reach the first target, save some money and then change your stop-loss order to an entry order.
For inquiries, please leave a comment.
We have a trend to hold above the Moving Average 100.
Entry price: 3.99.
First target: 4.08.
Second target: 4.19.
Third target: 4.30.
Don't forget a simple thing: ease and capital.
When you reach your first target, save some money and then change your stop-loss order to an entry order.
For inquiries, please leave a comment.
Thank you.
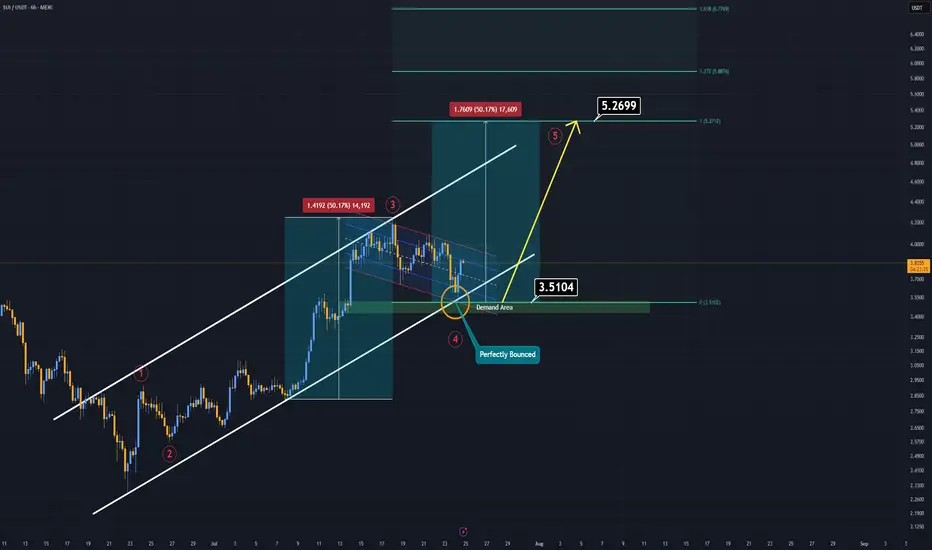
SUI Analysis (6H)If you're on the hunt for extreme risks and potentially high rewards — SUI might be calling your name.
Currently, SUI is trending within a well-respected ascending channel, and just today, it tapped both the demand zone and the lower boundary of this channel.
That’s what we call a double support, and it often signals a strong potential bounce.
SUI now appears to be forming a bullish flag pattern. If this formation breaks to the upside, it could trigger the fifth impulsive wave in line with Elliott Wave Theory.
In such a case, the main target is projected around $5.00–$5.20.
Extreme setups demand extreme conviction.
Good luck.
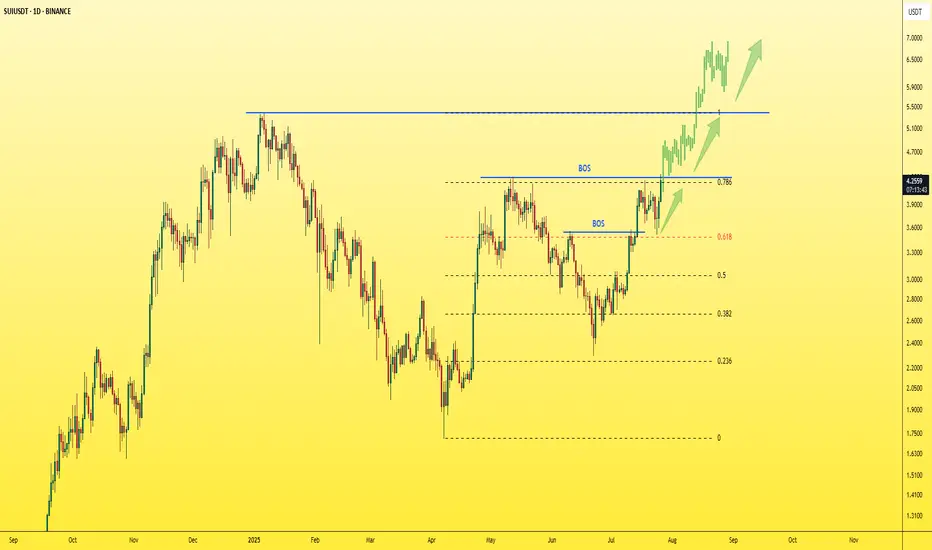
SUI - Just one step away from the explosion!The last candle on the daily chart just confirmed a BOS (Break of Structure) — a clear and strong sign of bullish continuation for the asset.
✅ This is a textbook entry for a long position.
🎯 Next target: $5 — and so far, no bearish signs in sight.
Best regards,
Ceciliones 🎯
SUI / USDT : Looking bullish SUI/USDT chart shows a breakout from a descending trendline, confirming upward momentum. Current price tests the resistance zone around $4.00. BTC is receiving support from the FVG, indicating short-term bullish potential.
Bullish Scenario: If price breaks above the resistance zone, a rally towards $4.50 to $5.00 is possible. Watch for confirmation of higher highs on shorter timeframes.
Invalid Setup: If price fails to break the resistance and falls back below $3.50, the bullish setup would be invalidated.
Pro Tip: Always wait for a clear confirmation candle above the resistance zone before entering a trade to minimize risk.

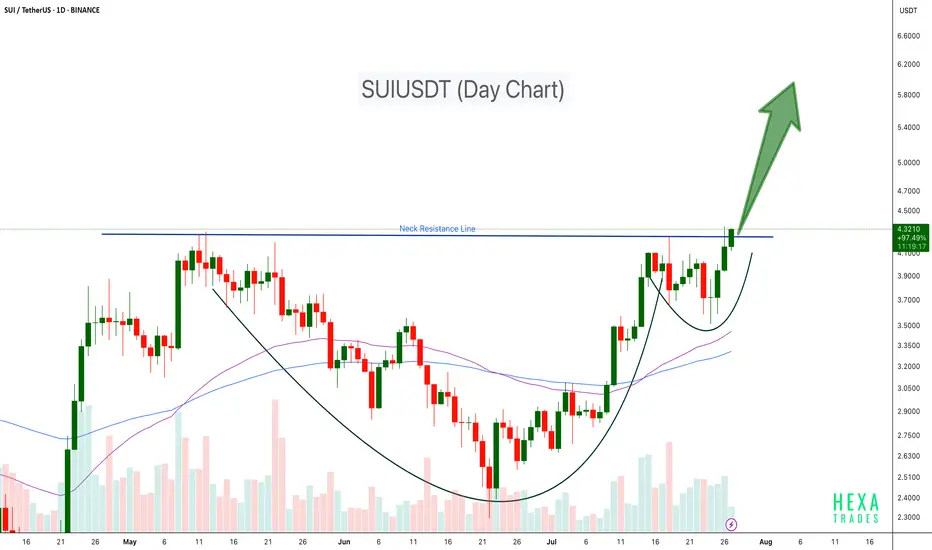
SUIUSDT Cup & Handle Breakout SUI has formed a classic Cup and Handle pattern on the daily chart and has now successfully broken above the neckline resistance around $4.30. This breakout could trigger a strong bullish continuation if volume sustains and retests hold.
Key Points:
Pattern: Cup and Handle
Breakout Level: ~$4.30 (neck resistance)
Potential Upside Target: $5.50 – $6.00+ based on pattern projection
Support Zone: $3.50
Confirmation: Sustained volume and close above neckline
Cheers
Hexa