Sui short to $2.2920Went short on sui a while ago. I think the market is likely to push down a bit more before we have any major corrective move based on my DTT analysis
Stop: $2.46 for better invalidation
Tp $2.2920
potential early close at $2.3248
Time sensitive
SUIUSDT trade ideas

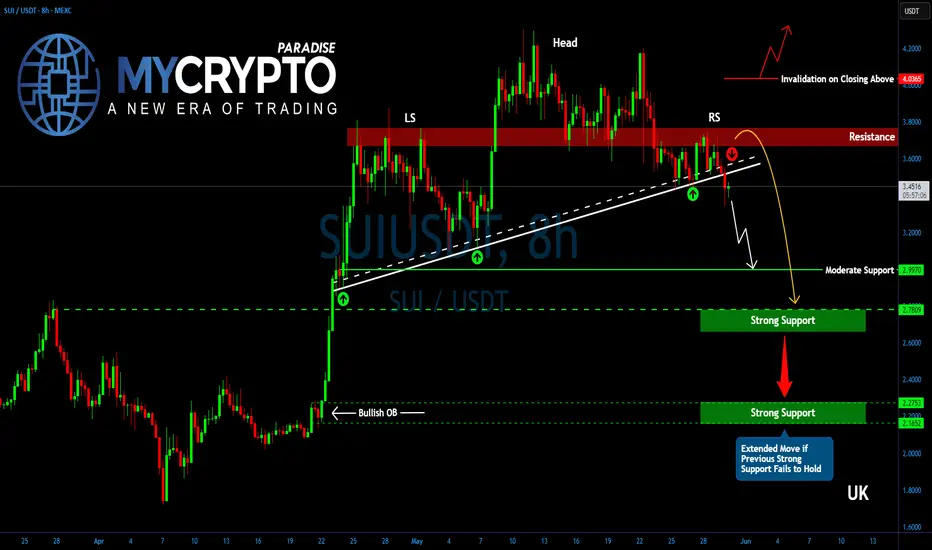
SUI Collapse Incoming? Bearish Pattern You Can’t IgnoreYello, Paradisers! Is #SUI about to enter a bearish spell? We’ve seen this setup many times before, and the warning signs are stacking up fast. If you're not already positioned or protecting capital, now’s the time to pay attention.
💎SUIUSDT has started losing momentum just as a classic head and shoulders pattern has completed at the top, a formation often associated with trend reversals. This bearish structure is further validated by the presence of bearish divergence on momentum indicators, hinting at exhaustion from buyers and growing strength among sellers.
💎#SUIUSDT's neckline support at $3.60 has been breached, and since then, price has been sliding gradually. Right now, its on a path toward the $3.00 level, a moderate support area where some initial profit-taking may occur. However, according to the structure's full pattern target, the move is likely not over just yet.
💎Given the weakening market dynamics and lack of bullish follow-through, an extended dip cannot be ruled out. If sellers manage to overwhelm the $2.65 floor, the next potential landing zone would be around $2.30, a high-confluence level with a strong historical order block. This is a zone where a more meaningful bounce or even a longer-term reversal could initiate, but only if market sentiment finds footing.
💎On the other side, bulls face an uphill battle. They must reclaim the $3.65 to $3.80 resistance range, a zone that has consistently rejected upward attempts over the past several days. A breakout above this range would be the first sign of renewed bullish intent and could help ease the selling pressure.
Paradisers, strive for consistency, not quick profits. Treat the market as a businessman, not as a gambler.
MyCryptoParadise
iFeel the success🌴
$SUI follow up for June 2025CRYPTOCAP:SUI has tapped my support zone around $2.85, which is currently holding well.
That said, the broader trend remains corrective, and it's likely only a matter of time before this support gives way.
If that happens, we could see a drop into my green buy zone — sitting just below a major order block. A break there might trigger heavy liquidations and a sharp move to the next support level.
I don't expect a deeper crash, as bulls are showing strong activity to defend this area.
If you set buy orders around this zone, a solid bounce could offer attractive profits.
As always, DYOR.
This is a follow up for this idea from May 2025
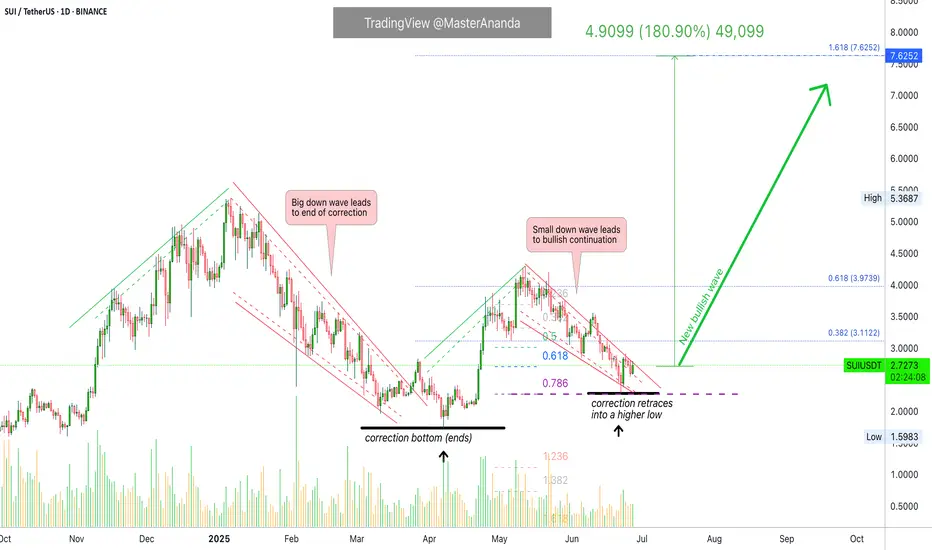
Sui: Bullish Potential w Leverage, Between 4-8X (PP: 720%-1440%)Sui looks great right now. This is a pair that I am approaching with leverage considering only a relatively small range, a 180% target. When multiplied by your number of leverage you can get an idea of the total profits potential. For example, 8X would be equal to 1440% while 4X gives 720%.
Technical analysis
How do we know the correction is over? We don't. We never do, but we always make an educated guess.
The higher low found support at 0.786 Fib. retracement relative to the initial breakout. Support is always found at one of these fib. levels with the 0.786 being the lowest on a bullish bias. When prices go as low as 0.786 a resumption of the bullish move is high probability. This can always be supported by additional signals of course.
Additional signals
Bitcoin is strongly bullish above $106,000 on a daily basis. The altcoins market tends to grow when Bitcoin consolidates at high prices.
The altcoins that moved first all remain bullish rather than producing a major crash. This means that the bullish cycle is on or else those that move strongly revert as soon as resistance is found. When a pair finds resistance and after a few days continues to challenge it, this is super bullish. This is what I am seeing on the pairs that I am tracking, and we are only concerned with the pairs we track because there are thousands of trading pairs and everything is always possible. Opportunities are endless.
Drawings vs numbers
The drawings and technical analysis are for learning and entertainment. The numbers, chart setup, entry and timing are the opportunity.
You can use one, you can use both. Whatever you do, is up to you.
Please keep in mind that there is always risk involved, especially when using leverage.
Do your own research and planning. Accept your mistakes, learn from these mistakes and success is guaranteed. When life hits you hard, stand up and try again. These are only lessons that will help us improve our game.
Challenges build resilience and character. Bring them all...
I am ready for battle, I am ready for profits, I am ready for success.
Thank you for reading.
Namaste.
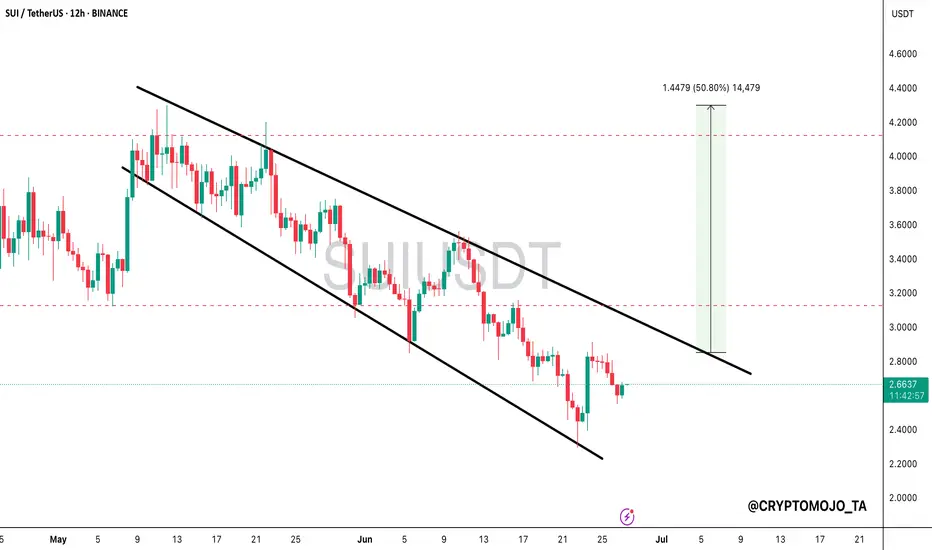
$SUI is still moving inside a falling channel!!CRYPTOCAP:SUI is still moving inside a falling channel on the 12H chart.
The price is near the bottom of the channel and starting to slow down.
If it breaks out from here, it could move up toward $4, that’s around 50% higher.
No breakout yet, but the setup looks interesting.
DYOR, NFA
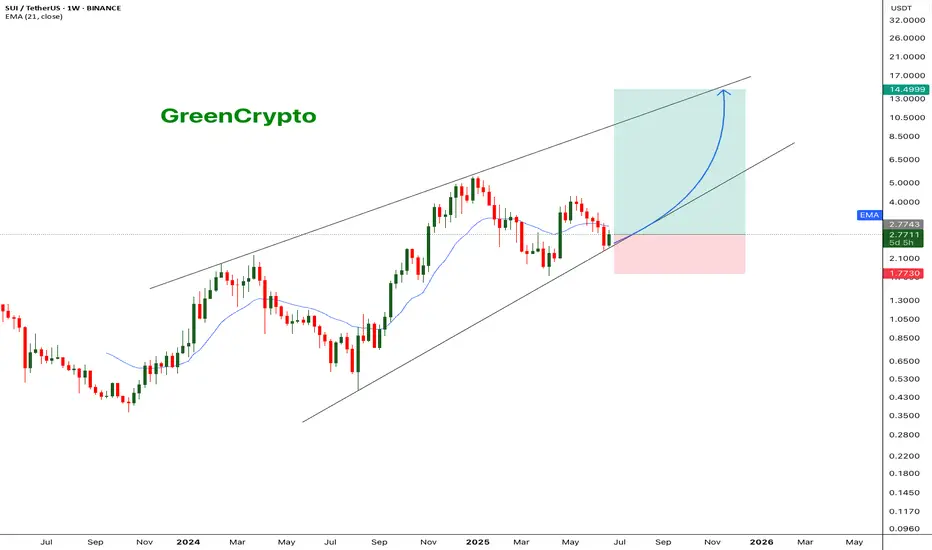
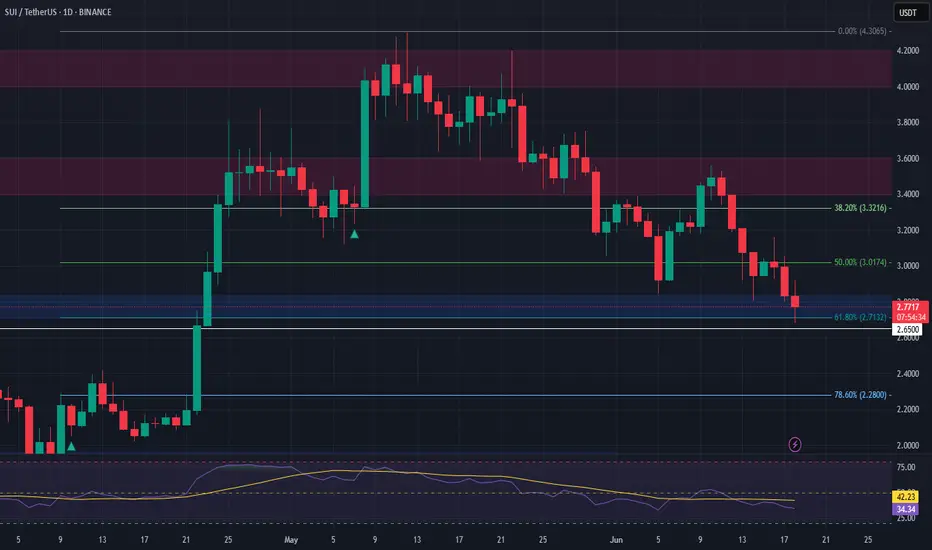
SUI - Only way is up.BINANCE:SUIUSDT (1W CHART) Technical Analysis Update
SUI is currently trading at $2.77and showing overall bullish sentiment
Price has touches the trending support and managed to bounce back from the support, this is a good sign. I see a good opportunity for long trade here with a decent stoploss.
Entry level: $ 2.77
Stop Loss Level: $ 1.77
TakeProfit 1: $ 3.6997
TakeProfit 2: $ 4.2126
TakeProfit 3: $ 5.7785
TakeProfit 4: $ 9.5494
TakeProfit 5: $ 14.1762
Max Leverage: 5x
Position Size: 1% of capital
Remember to set your stop loss.
Follow our TradingView account for more technical analysis updates. | Like, share, and comment your thoughts.
Cheers
GreenCrypto
SUIUSD, almost near bottom, parabolic move nextSUI currently ay 2.65 is presently positioned near the lower boundary of its trendline. I expect an upward trajectory, potentially leading to a significant parabolic increase. We will monitor its progress.
SUI Is Ready To Run!Good Morning Trading Fam,
I'm putting out a quick trade setup here on SUI, a coin I am honestly a long-term hodl'er of. I believe this coin has an exciting future ahead of it with tremendous potential to change the blockchain landscape for the better.
But this post is for those of you interested in trading it.
We have a perfect setup here. Descending bullish triangle, which we are nearing the end of. Strong long-time support underneath us. And my proprietary indicator has given us a buy signal at the point of confluence of both of the above. I have set three targets for you. Obviously, the higher the target, the higher the risk. Trade accordingly and let me know in the comments how you did. It makes me happy to know my followers are successful in their trades.
Best,
Stew
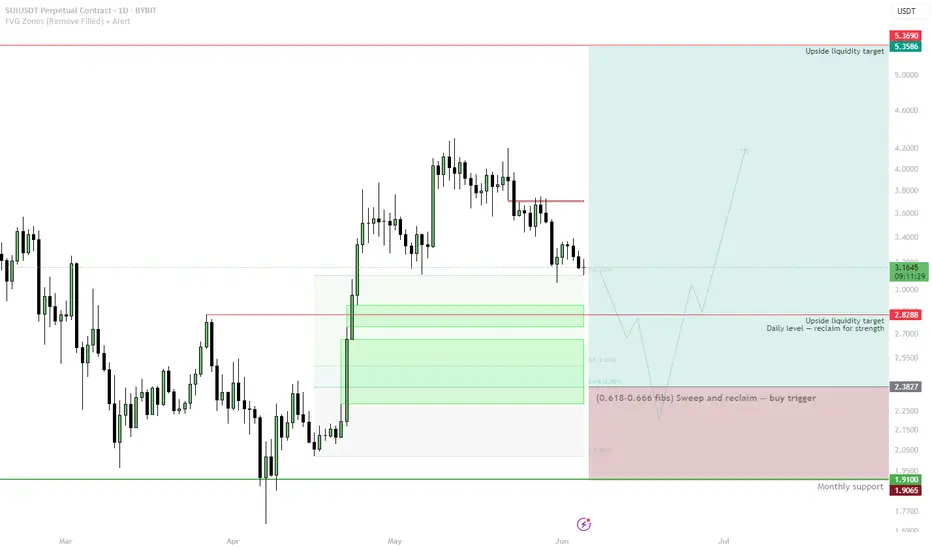
SUI | — Key Buy Trigger AheadPrice is drifting lower and approaching a high-confluence retracement zone. A key bullish setup may form if price sweeps the 0.618–0.666 Fibonacci region and reclaims the level with strength.
📌 Buy Trigger:
• Sweep into the $2.38–2.5 zone
• Look for reclaim and bullish reversal for long entry
• Structure remains constructive while above monthly support ($1.91)
📈 Reclaim Level for Strength:
• $2.83 — clearing this confirms bullish intent
• Flip = strength toward $3.80 and beyond
🎯 Targets:
• $2.83 → Range reclaim level
• $3.50–3.60 → local resistance
• $5.36–5.37 → full upside liquidity target
🟥 Invalidation:
• Clean break below $1.90 (monthly support) = full invalidation
📌 Best setups form when liquidity is swept and price reclaims structure. Wait for the flush and follow strength.
Short SUISUI has broken below both the 4-hour trendline and the daily horizontal support levels. The next key support zone lies around $2.20.
Setup is as in chart.
Disclaimer:
This analysis is based on my personnal views and is not a financial advice. Risk is under your control.
Pre-emptive W patternW pattern forming double bottom here then send to $12 that simple
potentially down to $2.30 - $2.50 max pain then if not here onwards and at 4 we tab off for the W and then boom rocket town.
Buckel up this is what I think, SUI loves W's
DYOR
I spoke to the one of the CO founders in an interview and everything is pointing towards this....
SUI - SUI thats how air soundsSo i told how you air sounds, about SUI? It looks like it will take top liqudity and then form the force within what it shall happen!
SUI landslide incomingSUI has lost support and has fallen below $3.55, and then failed to regain any ground above it repeatedly. The expectation is that it will hit the March 27 high of $2.82 and then possibly fall further.
Sui - TradeI’ve opened a short-term long position on $SUI.
Entry: 0.618 Fib level at $2.7031
Stop-loss: $2.5765
Once I reach at least 2R in profit,
I’ll move the trade to break-even and begin taking profits.
SUI Long Swing Setup – Confluence of Support and Fibonacci LevelSUI has pulled back into a key confluence zone, aligning with both the 61.8% Fibonacci retracement and horizontal support. We’re now eyeing the $2.70–$2.80 area for a potential long entry.
📌 Trade Setup:
• Entry Zone: $2.70 – $2.80
• Take Profit Targets:
o 🥇 $3.40 – $3.60
o 🥈 $4.00 – $4.20
• Stop Loss: Daily close below $2.65
Sui cup and handleThanks to @leu76 i think we are going to make a cup and handle.
We just need to stay above the 0.5 fib.
Target to the 2 fib

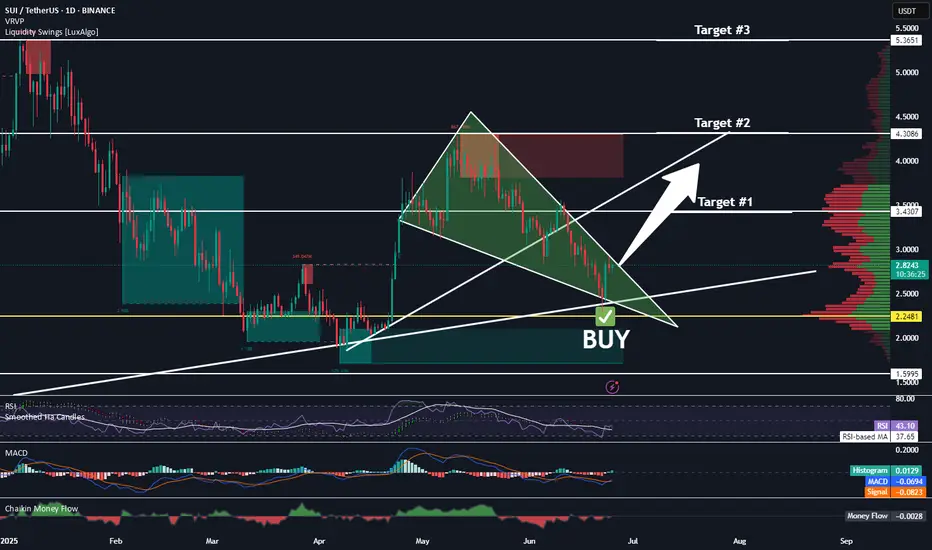
SUI MAJOR BUY ZONESUIUSDT rejected from marked supply zone and looks to dump more as well. So Major buy zone is around 2.15-2.30. Keep eyes on that level.

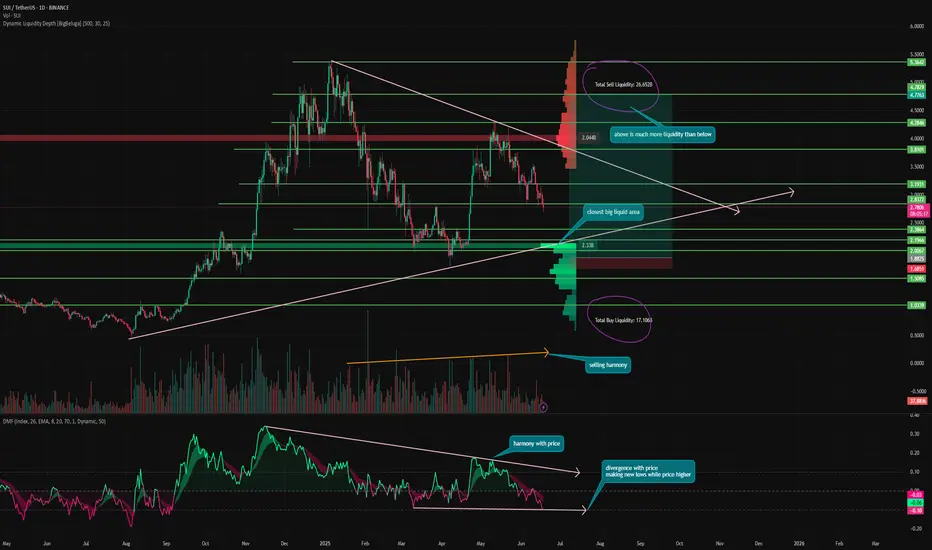
SUI - overhyped or does it have a FUTURE?⚡️ Hello everyone! So far, there has been nothing unexpected in Bitcoin for me personally to update the review. Let's take a look at one of the main altcoins of the season - SUI.
The project burst onto the scene very quickly, with some people writing it off when it hit $1. But it successfully reached $5+, which begs the question: what was that all about? A fleeting narrative or a new token of the future?
📊 Now the token has formed a flag, like many other projects on the market, and is effectively “nowhere.” Gradually approaching both sides of the slope, let's dig deeper to understand which direction a breakout is most likely.
I am not a fundamental expert, but I know that the number of network users is actively growing along with TVL. New projects are being launched and partnerships are being formed (Trump's WLFI).
❓ But what does the chart tell us?
Money Flow - harmony with price. Positions are gradually closing, liquidity is leaving. But there is a divergence in the inflow, the indicator is already forming new lows, while the price is significantly higher than the previous low. This means that people are not yet ready to buy at the current price.
Liquidity Depth - there is currently significantly more liquidity concentrated at the top than at the bottom. This is understandable, as the token has been declining for a long time and is trading below its ATH, with a lot of shorts accumulated. And as we know, the price moves from one liquidity zone to another—that is its fuel. However, despite this, the nearest large liquidity cluster is at the bottom, at levels of 2.13 - 2.04.
Volume - one of the only tokens on the market where sales volumes remain harmonious even after 6 months of correction. The token grew for a very long time, many held on to it and are now continuing to take profits.
📌 Conclusion:
I believe the token clearly has potential. But it is too young, and it is difficult to determine its real value at this point. Many tokens that were a hit in 2021 are now, well, you know where...
So, I am currently considering SUI purely as a speculative asset, and the bear market will show who is who.
I believe that now, together with the entire market, we are going lower, removing liquidity from the 2.13-2.04 level. A correction below 1.7246 (previous low) is even likely.
📈 And from this zone, I begin to consider the possibility of a rebound and taking a long position.
Have a nice day, everyone!
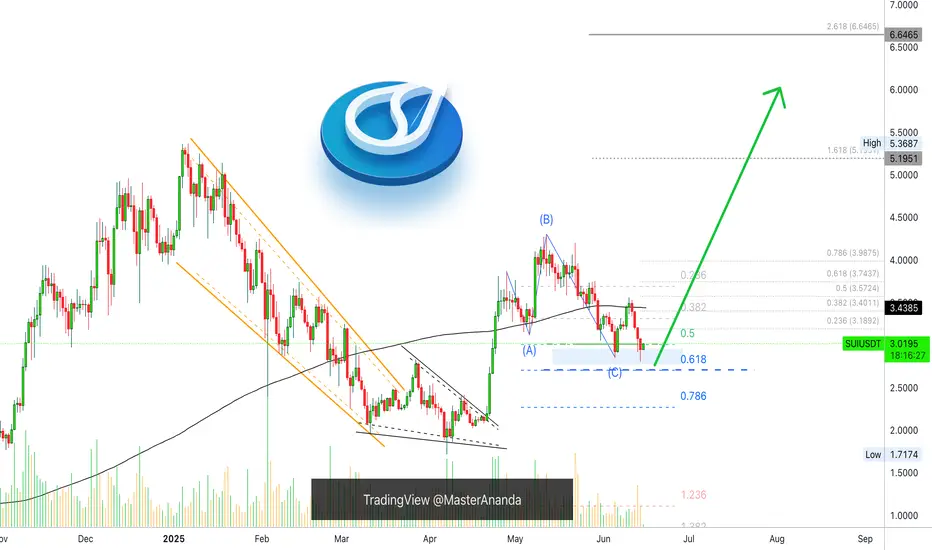
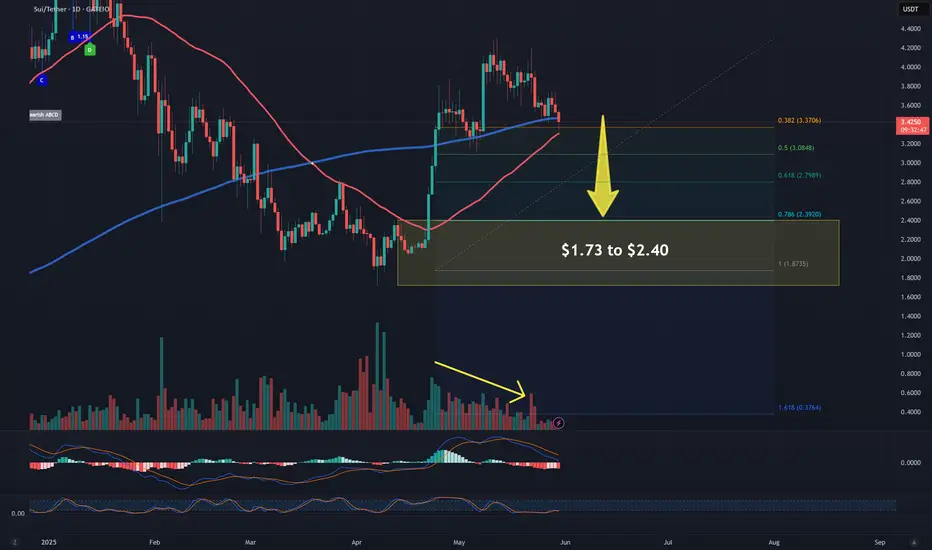
Sui Update, Retest of Support; Bullish ConfirmedIt's been 9 days since my last Sui update. The chart looks good.
For context, see the previous analysis:
We started at the C wave of an ABC correction. There was an attempt to push prices higher but resistance was found at MA200. The resistance produced retrace and the same support zone is tested and holds. If a new advance develops here, which is exactly what is going to happen, then you can expect much higher prices next. This time around, MA200 as resistance will break, which means a new high. The highest prices in more than six months, since January 2025.
This is where the next move will take us and this is easy to predict now that support has gone through a retest and holds.

#SUI/USDT#SUI
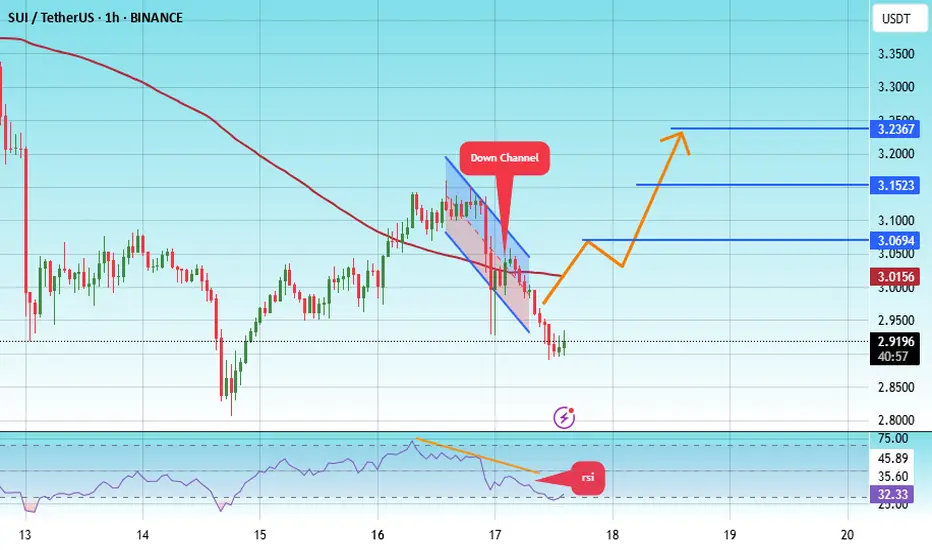
The price is moving within a descending channel on the 1-hour frame, adhering well to it, and is heading toward a strong breakout and retest.
We are experiencing a rebound from the lower boundary of the descending channel, which is support at 2.90.
We are experiencing a downtrend on the RSI indicator that is about to break and retest, supporting the upward trend.
We are heading toward stability above the 100 Moving Average.
Entry price: 3.00
First target: 3.07
Second target: 3.15
Third target: 3.24
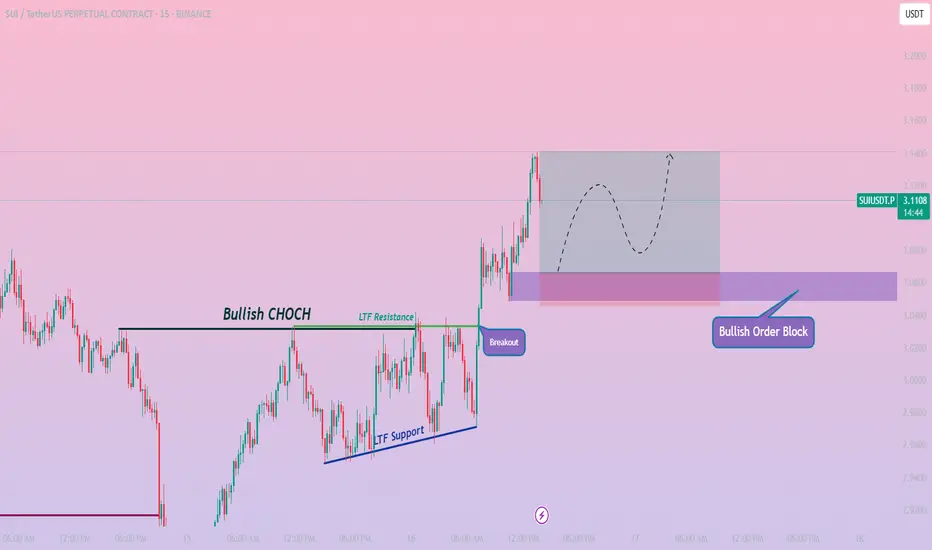
SUIUSDT / 15M / LONG🔍 Analysis:
I used Smart Money Concepts (SMC) and Price Action to build this setup.
The market recently formed a Bullish Order Block between 3.0669 and 3.0484, which aligns with the discount zone of the current price swing.
This suggests smart money accumulation in the demand zone, and a possible bullish internal shift of structure.
SUIUSDT / 15M / LONG
🔹Entry: 3.0662
🎯Take Profit (TP): 3.1407
🛑Stop Loss (SL): 3.0456
📊Risk-Reward Ratio (RRR): ~1:3.62
📅 Timeframe: 15 Minutes
Sui Update, Retest of Support; Bullish ConfirmedIt's been 9 days since my last Sui update. The chart looks good.
For context, see the previous analysis:
We started at the C wave of an ABC correction. There was an attempt to push prices higher but resistance was found at MA200. The resistance produced retrace and the same support zone is tested and holds. If a new advance develops here, which is exactly what is going to happen, then you can expect much higher prices next. This time around, MA200 as resistance will break, which means a new high. The highest prices in more than six months, since January 2025.
This is where the next move will take us and this is easy to predict now that support has gone through a retest and holds.
Namaste.