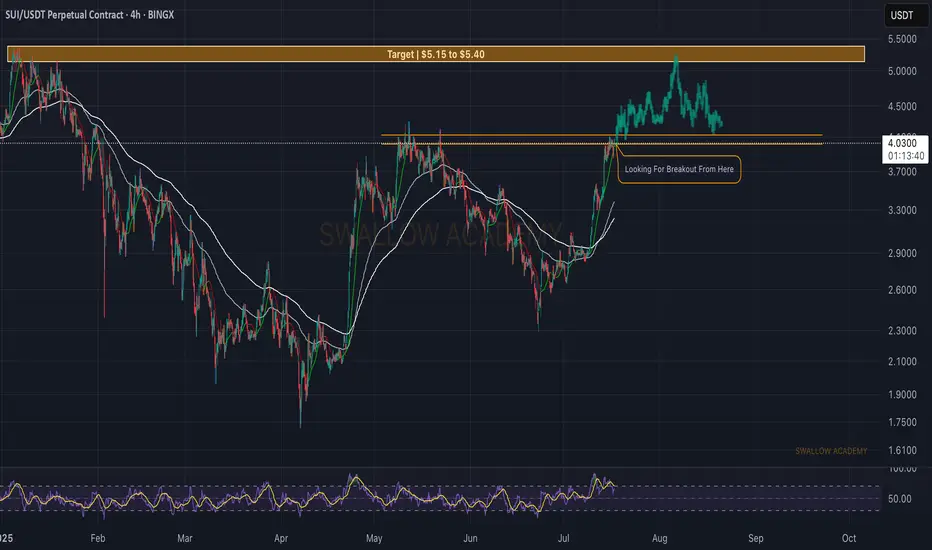
Sui (SUI): Looking For BOS (Break of Structure) Sui coin looks strong, where we are about to get a proper BOS (Break of Structure), which then would give us an ideal opportunity for a long position up until $5.40, where our target is sitting currently.
Once there we expect to see some sort of correction or sideways movement, before next wave of upward movement.
Swallow Academy
SUIUSDT trade ideas
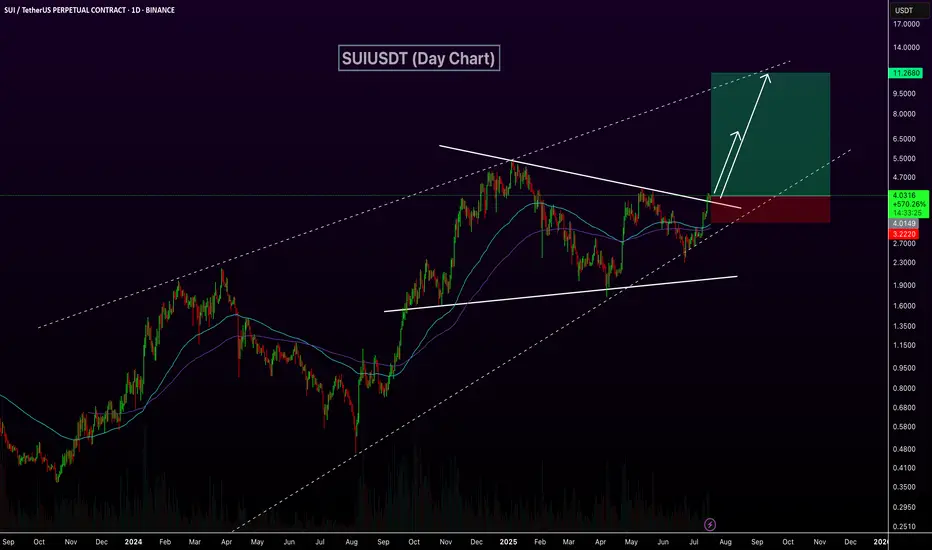
SUIUSDT Breaks Out of Triangle – Eyes on $10BINANCE:SUIUSDT daily chart has confirmed a breakout above a symmetric triangle resistance line within a larger ascending channel, signaling strong bullish momentum. Price has reclaimed the 100 and 200 EMAs, and the breakout is backed by rising volume. This setup opens the door for a potential rally toward the $10.00 level, with price currently holding above key structure support around $4.00. As long as this level holds, continuation toward the upper trendline remains likely. CRYPTOCAP:SUI
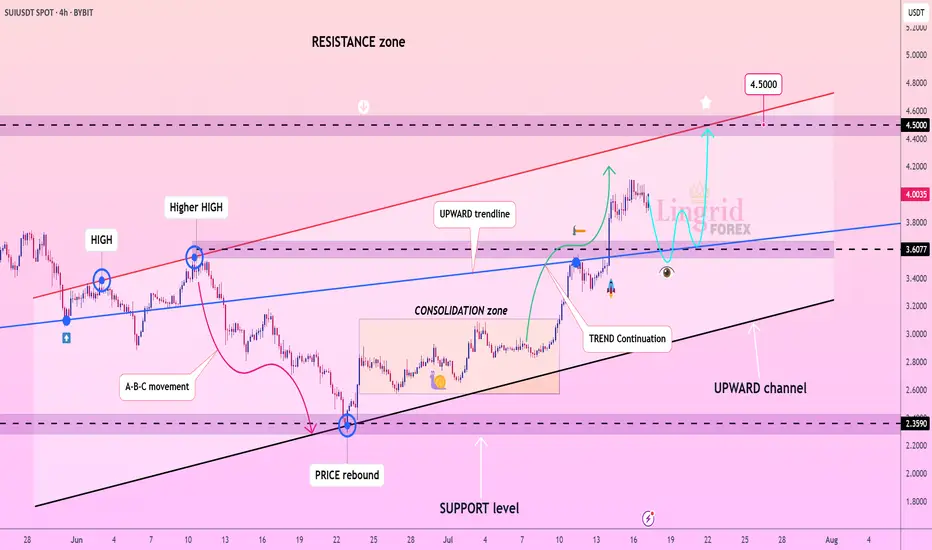
Lingrid | SUIUSDT Pullback and New Higher High PotentialBINANCE:SUIUSDT has rebounded strongly from the support level at $3.60, continuing its bullish sequence of higher highs and higher lows. The price broke out of the consolidation zone and climbed above the blue upward trendline, confirming a continuation of the bullish trend. A retest of the breakout area is likely before a push toward the major resistance zone at $4.50. The structure remains bullish as long as the channel support holds.
📉 Key Levels
Buy trigger: Bounce from $3.60 zone
Buy zone: $3.55–$3.70 (retest range)
Target: $4.50 (red resistance line)
Invalidation: Close below $3.45 trendline support
💡 Risks
Breakdown of the black channel line
Volume divergence or failure to hold the $3.60 support
Broader market weakness across altcoins
If this idea resonates with you or you have your own opinion, traders, hit the comments. I’m excited to read your thoughts!
SUI SELL SETUP , Sold From $3.95SUI SELL SETUP
Currently $3.95
Sold From $3.95
(Trading plan If SUI go up to $4.10
will add more shorts)
Expecting target $3.85 OR DOWN
In the event of an early exit,
this analysis will be updated.
Its not a Financial advice


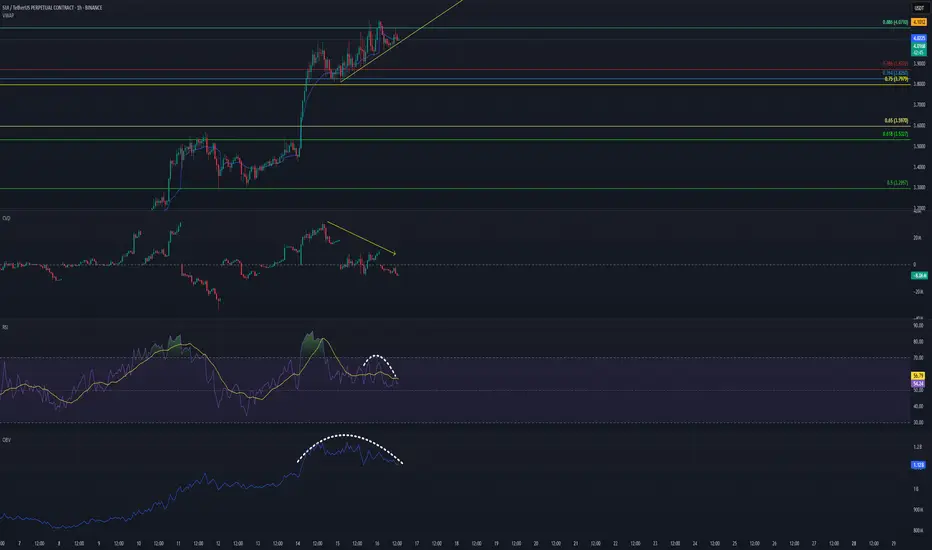
SUI‑USDT – Exhaustion or Extension?1. Why this zone matters
Price has reached the 0.886 Fib retrace of the May -> Jun swing.
Momentum is fading: 1‑hour RSI peaked lower (60 vs. 69 on the prior swing).
OBV and hourly volume both rolling over
2. Order‑flow snapshot (since 14 Jul 00:00 UTC)
Spot CVD → up Retail/FIAT buyers still lifting offers.
Perp CVD → down Aggressive shorts absorbing that demand.
Aggregated OI → up, now stalling Fresh longs trapped; beginning to unwind.
Interpretation: spot bids are being offset by short perps, and the build‑up in leverage is leaking—classic exhaustion.
3. Historical stats to know
The combo Spot CVD ↑ + Perp CVD ↓ + OI roll‑over + RSI bear‑div has produced a ≥ 1 % downside move within 30 minutes about 65 % of the time on tier‑1 alts (Jan 2023 – Apr 2025 sample).
4. Checklist before I short
M5 structure break (lower‑high plus close below the last M5 swing low).
Need a 1H candle CLOSE below the yellow ascending trendline!
Perp CVD flips ≤ 0 and OI prints two consecutive down‑ticks.
TPO sell tail with at least 3 single prints right at the high.
If all three fire → short is live. Otherwise, stand aside.
Bottom line
Momentum is fading; spot buying is being soaked up by stealth perp shorts, and leverage is already leaking out. Wait for the checklist—then look for a mean‑reversion move lower.
And remember: Reaction beats prediction.
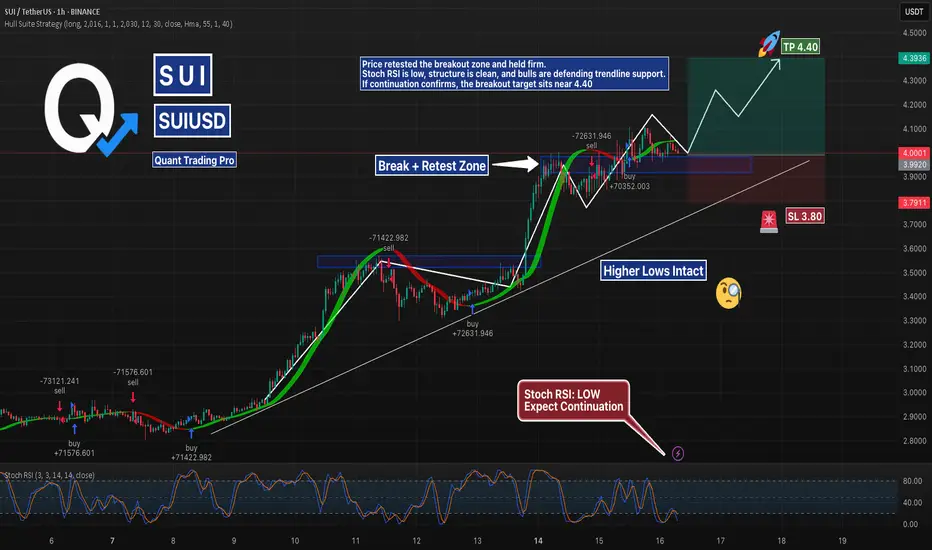
SUIUSD @ Retest Zone | Breakout Setup?SUI is consolidating in a potential bull flag above the previous resistance zone around $4.00.
Stoch RSI is low, trendline support is still intact, and a clean R:R setup presents itself with TP at $4.40 and SL at $3.80.
Watching for volume breakout confirmation before entry.
#SUIUSD #BullFlag #Crypto #SupportResistance #BreakoutSetup #TradingView #QuantTradingPro
SUI Analysis – July 15, 2025
SUI appears to have entered its bullish phase slightly earlier than most other altcoins.
This move seems to be fueled by a number of key partnerships and contracts signed over the past six months — a fundamentally positive signal.
📊 However, based on the current chart structure,
entering at this level may not be the most attractive opportunity.
✅ While a short-term 20% upside could be possible,
it’s more prudent to wait for price to test its previous high,
and observe how investors react to that resistance zone.
Their behavior will offer clearer insight into whether a continuation or correction is likely.

Sui and manipulation.In my opinion, this rally is a manipulation, and we’ll see a sharp correction in the near future.

SUI is breaking out – Time to buy again.SUI is now breaking above the descending trendline. The price is approaching a key resistance zone around $4.10–$4.20. A successful breakout and retest could open the door to a strong bullish continuation.
💬 What do you think?
Drop your thoughts ⬇️
#SUI #CryptoTrading #Breakout #Altcoins #TechnicalAnalysis
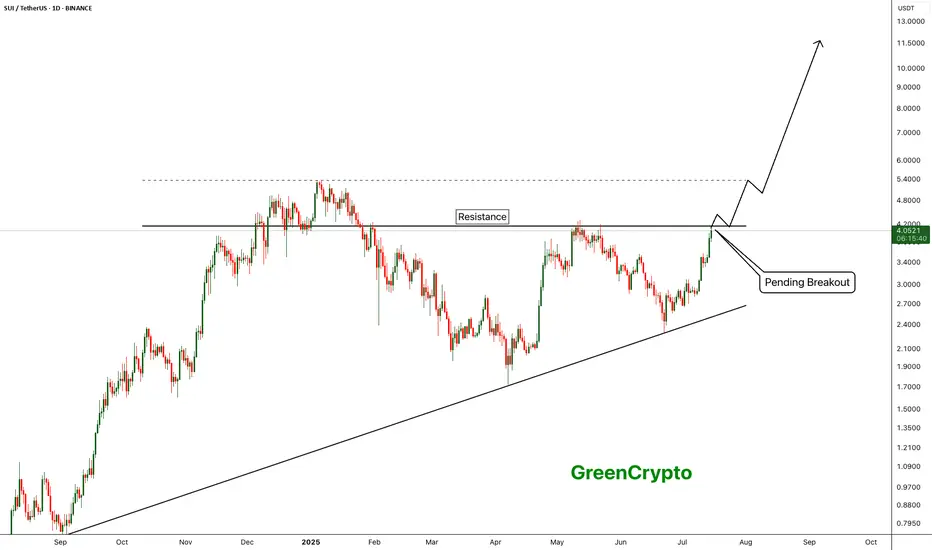
SUI - Breakout of the year- SUI is currently trading near the resistance line. Price was reject around this resistance line in the previous pump.
- Given the current bullish market, price is expected to breakout from this resistance easily
Entry Price: 4.04
StopLoss: 3.2
TP1: 4.5059
TP2: 5.3810
TP3: 6.5106
TP4: 7.8772
TP5: 10+
Don't forget to set stoploss.
Stay tuned for more updates
Cheers
GreenCrypto
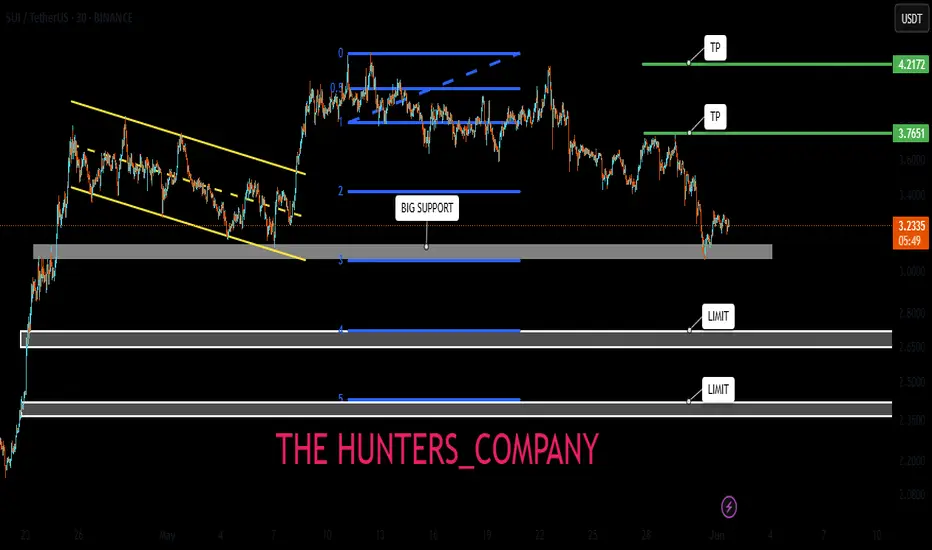
Will key support be held or broken today?Hello friends
According to the complete analysis we conducted on this currency, we concluded that the price correction can continue with the failure of the specified support and go to lower supports, but if buyers support the price in the support area, it can have a good rise.
Note that with capital and risk management, you can buy in steps in the specified support areas and move with it to the specified targets.
*Trade safely with us*
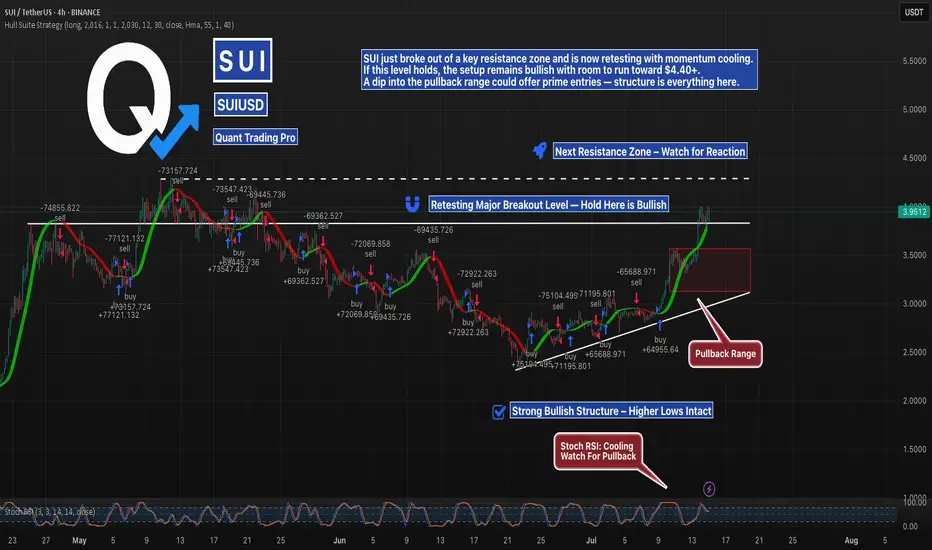
SUI Breakout Retest in Progress — Bulls Have the BallSUI has finally broken above major horizontal resistance and is now retesting that level, backed by a rising trendline of higher lows. With Stoch RSI cooling and the price sitting just above a prior range, this is the key decision zone.
If bulls defend the breakout, continuation toward $4.40+ is likely. If not, the pullback zone between $3.50–$3.00 becomes critical. Structure still favors the bulls — but confirmation is everything.
#SUIUSDT #CryptoBreakout #QuantTradingPro #TradingView #BacktestYourEdge #AltcoinSetup
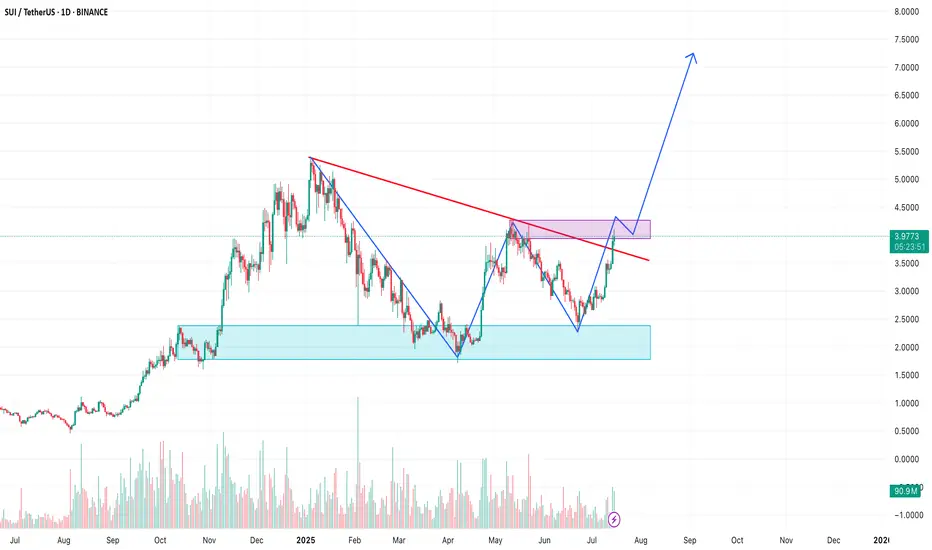
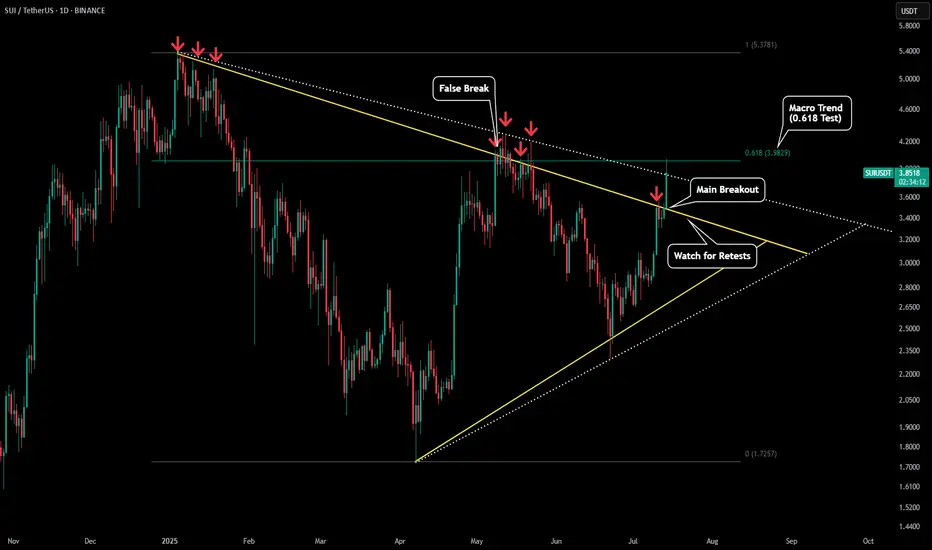
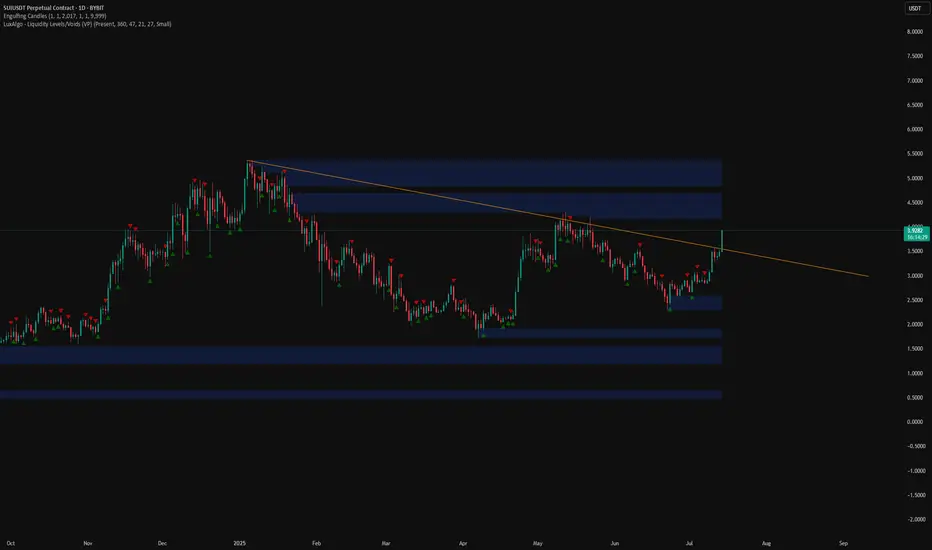
SUI - Daily Chart PerpectiveThis chart is in expansion to our previous post:
What we can see is SUI has clearly broken out of its symmetrical triangle (yellow trendlines). This is the first good sign for potential new highs for SUI.
However since the 4H chart could be spelling out a short term drop lets see where price could go.
Right now it is testing the 0.618 of the macro trend as resistance. It could also be battling with the top range of wick price action (dotted white lines).
If price does fall on the 4H chart it could coincide with a retest of our yellow trendline.
If we get a retest and hold of that yellow trendline that will be the confirmation we need for a full blown breakout for SUI.
If we do not fall on the 4h chart and break back above the $4 level then price will head to the 0.786 ($4.60) followed by a test of the previous high.
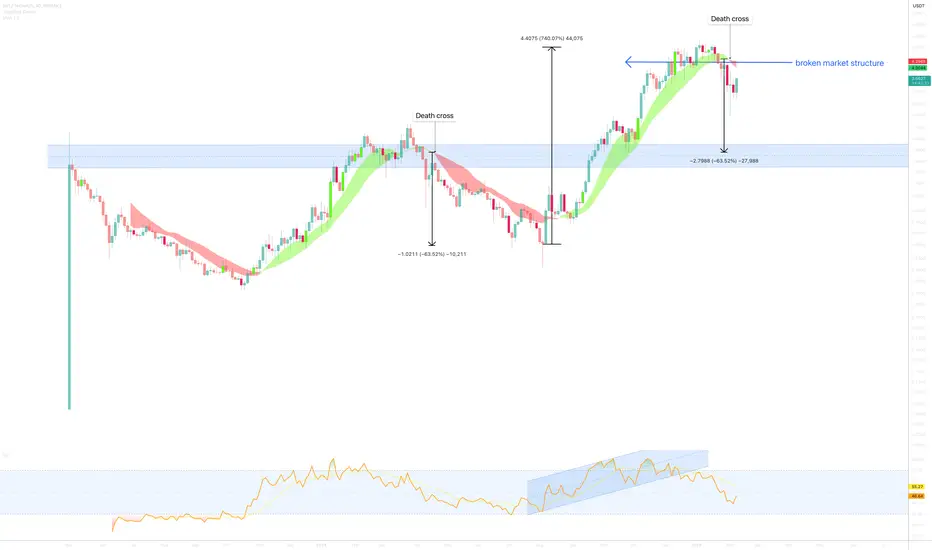
SUI 50% correction to $1.50 areaOn the above 3 day chart price action has moved up 700% since last August. A number of reasons now exist for a reversal, they include:
1) Broken market structure.
2) Price action and RSI support breakouts.
3) A reliable bearish crossover.
4) No support levels until 1.90. A strike of 1.50 is probable.
5) "Short" active from $4.05 area.
Is it possible price action continues printing higher highs? Sure.
Is it probable? No.
Ww
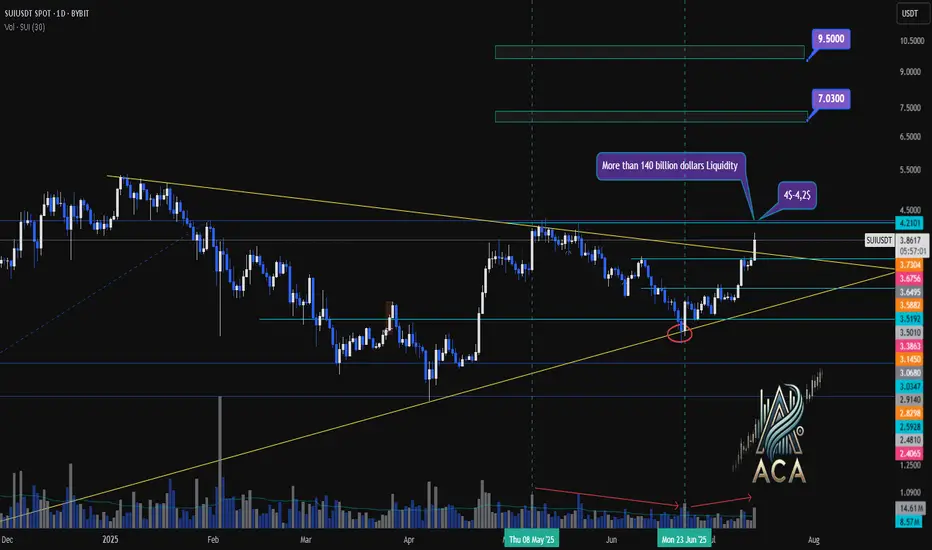
SUIUSDT Weekly Chart Analysis | Breakout Confirmed!SUIUSDT Weekly Chart Analysis | Breakout Confirmed, Massive Liquidity at $4–$4.20
🔍 Let’s dive into the SUI/USDT weekly chart after a decisive breakout from the symmetrical triangle, highlighting the critical liquidity zone and what it means for price action.
⏳ Weekly Overview
SUI has broken out of its multi-month triangle pattern following a textbook fakeout, with volume dynamics confirming renewed bullish momentum. The breakout is now awaiting daily candle confirmation for full validation.
🔺 Bullish Breakout & Key Liquidity Zone
A major liquidity cluster sits between $4.00 and $4.20, with more than $140 billion in liquidity concentrated in this range. This zone is crucial for several reasons:
- It represents a significant area where large buy and sell orders are stacked, likely leading to heightened volatility as price approaches or breaks through.
- Clearing this liquidity could unlock rapid moves toward the next upside targets at $7.03 and $9.50, as shown on the chart.
📊 Key Highlights
- Symmetrical triangle resolved with a bullish breakout, confirmed by increasing volume.
- The $4.00–$4.20 range holds over $140B in liquidity, making it a pivotal battleground for bulls and bears.
- Daily candle confirmation remains essential for trend validation.
- SUI ecosystem has reached a new all-time high in DeFi TVL, adding fundamental strength to the bullish case.
🚨 Conclusion
The breakout above the triangle, combined with surging volume and a record DeFi TVL, sets the stage for a potential rally. Watch the $4.00–$4.20 liquidity zone closely—how price interacts with this level could determine the speed and magnitude of the next move. Stay alert for daily confirmation and be prepared for volatility as SUI tests this high-stakes region.
#SUI #CryptoAnalysis #TradingView #Altcoins #ACA
SUI Daily break outSui has been trading in a triangle pattern facing overhead resistance since Jan 5 highs, pierced resistance today, expecting to retest of the FVG created then bounce to create new ATHs

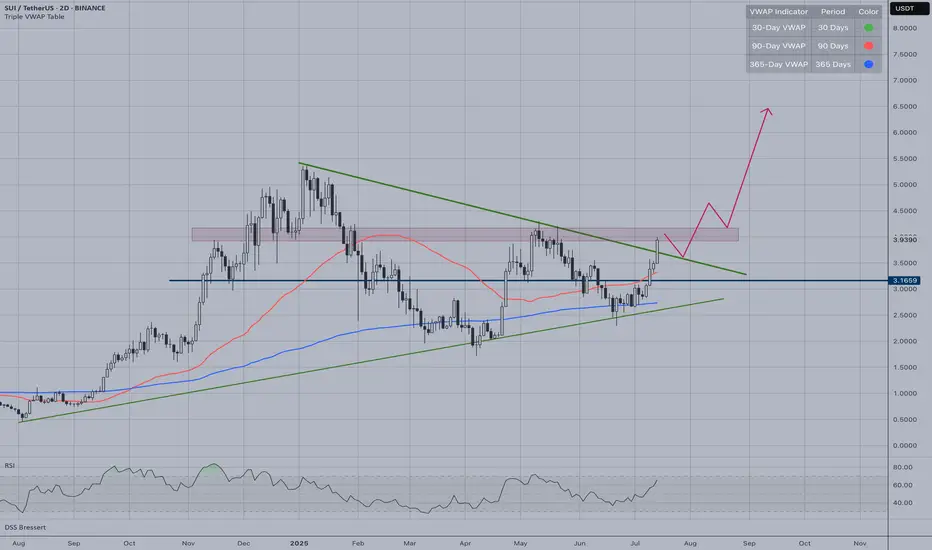
SUI | Triangle BreakoutSUI/USDT has successfully broken out of a major triangle consolidation pattern. The breakout pattern suggests SUI could experience significant upside momentum, especially if it maintains above the triangle's upper boundary. This technical setup aligns well with a medium-term bullish outlook.
Key Technical Points:
Triangle pattern breakout confirmed with strong momentum
Price cleared the upper resistance trendline decisively
RSI showing recovery from oversold conditions
Multiple VWAP levels providing support structure
Price Targets:
First resistance: $4.20 (red shaded zone)
Extended target: $6.50+ following the projected path
Trade Setup:
Entry: Current levels (agressive) or on a pullback to the triangle (conservative)
Stop loss: Below $3.30 VWAP-90 Support
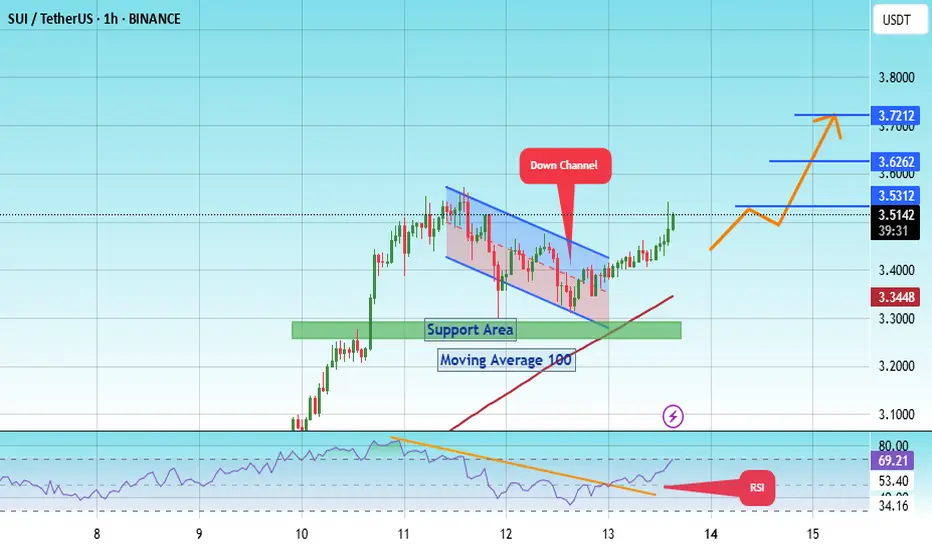
#SUI/USDT ready to surge 13% toward $3.72 target?#SUI
The price is moving within a descending channel on the 1-hour frame, adhering well to it, and is on its way to breaking it strongly upwards and retesting it.
We have a bounce from the lower boundary of the descending channel. This support is at 3.30.
We have a downtrend on the RSI indicator that is about to be broken and retested, supporting the upside.
There is a major support area in green at 3.20, which represents a strong basis for the upside.
Don't forget a simple thing: ease and capital.
When you reach the first target, save some money and then change your stop-loss order to an entry order.
For inquiries, please leave a comment.
We have a trend to hold above the 100 Moving Average.
Entry price: 3.44
First target: 3.53
Second target: 3.62
Third target: 3.72
Don't forget a simple thing: ease and capital.
When you reach the first target, save some money and then change your stop-loss order to an entry order.
For inquiries, please leave a comment.
Thank you.
SUIUSDT Long IdeaDescending trendline of lower highs has been breached
Should expect rejection at $4 area and a slight pullback to 0.382 fib level around $3.35
Resistance at $4 area should be closely monitored and if breached, wait for retest and confirmation in order to set up long position.
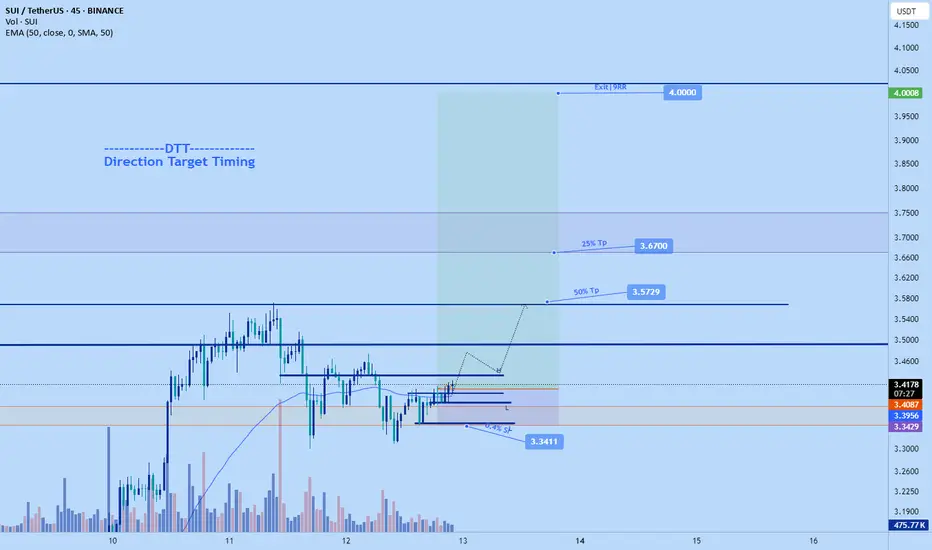
Sui long to $4.00Just opened a long position on sui. Its not the usual time for a long on the weekend but I got a few confirmations so while it feels weird am taking a risk on it.
Btc recently made ATH and it keeps going. So...expect anything.
See tp targets on chart.
stop: $3.3411 - wide and conservative
DTT strategy applied
Direction, Target and Timing
$SUI breakout incoming?Looks like SUI is having strength IMO. I wonder if the breakout confirms and holds :O
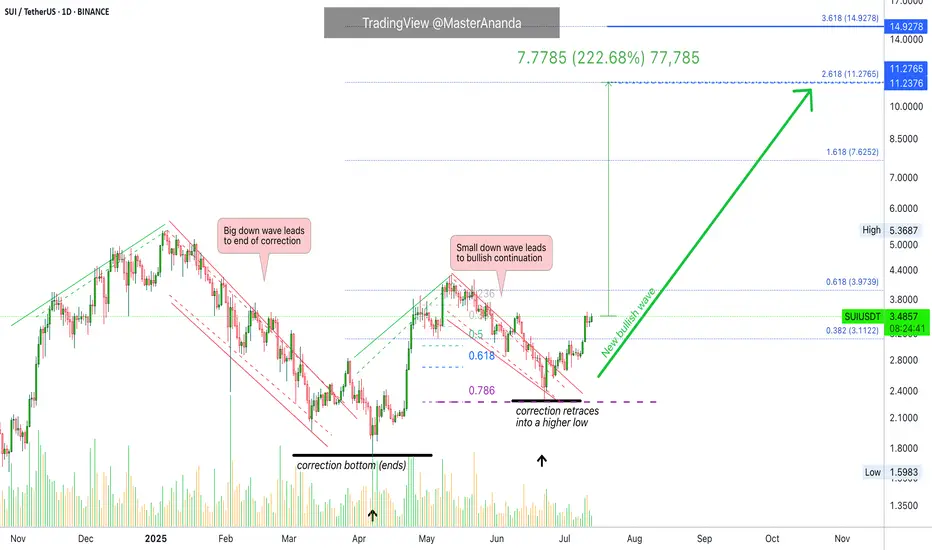
Sui Update · Clearly Moving Towards $7.62, $11.3 & $15The SUIUSDT chart looks great and just today we are witnessing a bullish continuation. Resistance was found 11-July but the market didn't produce any significant retrace. This is obviously because we are ultra-bullish and ultra-bullish can only mean sustained growth.
After the 11-July resistance, one day neutral and now resistance is being challenged again. Based on how Bitcoin is doing, a new all-time high; based on how the market is doing, great; we can expect higher prices in the coming weeks and months.
There will always be swings. Retraces and corrections but the bigger picture is a strong bullish dynamic for months. Think of 4-8 months of prices rising non-stop. That is what you are about to experience. Keeping in mind that the start date is 7-April and not today. So 6-8 months starting early April, growth long-term.
We will have a new all-time high for on this pair. There is huge potential for growth. The target on the chart is an easy one based on the short-term (within 1 month/30 days). After $7.62 we have $11.27 followed by $15. As you can see, it is still early within this bullish wave.
Thanks a lot for your altcoin choice, a great pick.
Your support is appreciated.
Namaste.