SUI NEW UPDATE (4H)This analysis is an update of the analysis that you see at the bottom, in the "Related Ideas" section.
The momentum of the fall has decreased and we have signs that the SW has formed. Therefore, we will look for buy/long positions above SW L.
The purpose of this correction was time, not price.
We are looking for buy/long positions in the green range.
The targets are clear on the chart.
Closing a daily candle below the invalidation level will violate the analysis.
For risk management, please don't forget stop loss and capital management
Comment if you have any questions
Thank You
SUIUSDT trade ideas

Phemex Analysis #22: SUI _ A Tale of Potential and Uncertainty!PHEMEX:SUIUSDT.P , the Layer 1 blockchain backed by industry giants like a16z and Samsung Next, has emerged as a promising contender in the cryptocurrency landscape. With its impressive speed and efficiency, SUI offers a compelling alternative to established platforms like Ethereum and Solana.
Price Structure
The token's journey has been marked by both highs and lows. From its initial launch price of $1.4038 in April 2023 to its all-time high of $2.1841 in March 2024, SUI has demonstrated significant growth potential. However, the cryptocurrency market's volatile nature has also seen SUI experience downturns, with its recent low reaching $0.4631 in August 2024.
As we analyze SUI's price structure, it becomes evident that certain levels act as pivotal points. The initial support level at $1.00 serves as a crucial barrier to prevent further declines. If SUI were to break below this level, it could signal a potential downward trend reversal. On the other hand, the initial resistance level at $1.43 represents a hurdle that, if breached, could indicate a bullish uptrend.
Intermediate support and resistance levels at $0.86, $0.78, $1.72, and $2.00 provide additional insights into potential price movements. These levels can act as temporary points of support or resistance, influencing the token's short-term trajectory.
Possible Scenarios:
Given SUI's strong backing and technical capabilities, it is reasonable to anticipate a potential upward trend. However, the cryptocurrency market is subject to various factors, including broader economic conditions, regulatory developments, and market sentiment. Therefore, it is essential to approach investments in SUI with caution and consider both potential gains and risks.
1. Upward Trend Continuation: If SUI consistently breaks above resistance levels, accompanied by increasing trading volume and positive technical indicators, it could signal a continuation of the upward trend. Investors might consider buying SUI near the intermediate support levels or after a pullback from the initial resistance level.
2. Downward Trend Reversal : If SUI breaks below support levels, with decreasing trading volume and negative technical indicators, it could indicate a potential downward trend reversal. Investors might consider shorting SUI near the intermediate resistance levels or after a breakout below the initial support level.
Conclusion
SUI, with its strong backing and promising technical capabilities, presents an intriguing opportunity for investors. While its future price movement is influenced by various factors, including market sentiment and overall economic conditions, the potential for significant growth remains. However, it is crucial to approach investments in SUI with a cautious and informed mindset, considering both the potential rewards and risks involved.
Tips:
Trade Smarter, Not Harder with Phemex. Benefit from cutting-edge features like multiple watchlists, basket orders, and real-time strategy adjustments. Our unique scaled order system and iceberg order functionality give you a competitive edge.
Disclaimer: This is NOT financial or investment advice. Please conduct your own research (DYOR). Phemex is not responsible, directly or indirectly, for any damage or loss incurred or claimed to be caused by or in association with the use of or reliance on any content, goods, or services mentioned in this article.

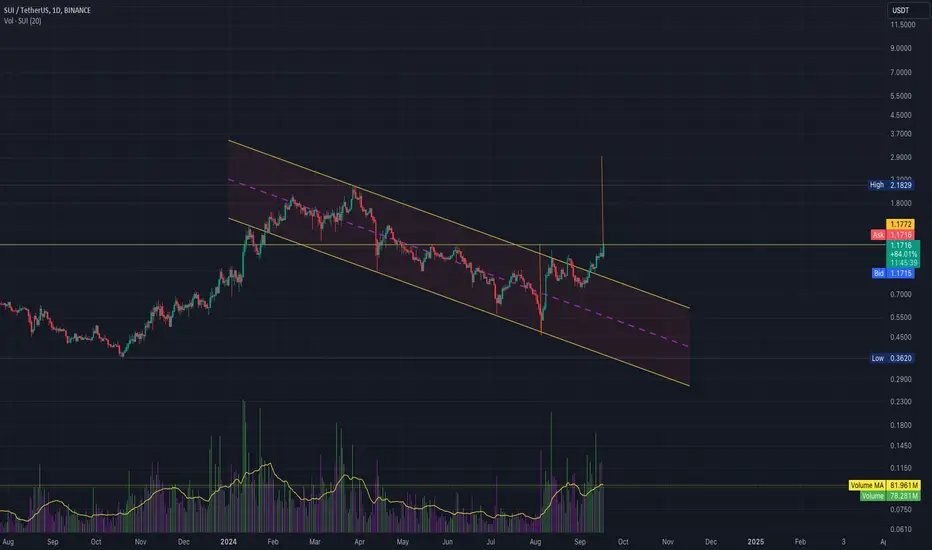
SUI, the poseidon of the seas SUI, SUI, it falls like a water-fall and trend up like a tsunami.
Breakout successful of the recent downtrend from $2
Aggressive recovery after an 80% drop
If we break $1.17 we should be looking north of $2.5 somewhere close to or $3
Will the earthquake break $1.17 and a tsunami induces taking us to $3 ? let's see !
Team behind = Ex meta engineers
Tokenomics are not the best but we can live with that
22 million holder !
Solid project with potential
See you up there, somewhere !
"That's it, that's the idea" - Good night !
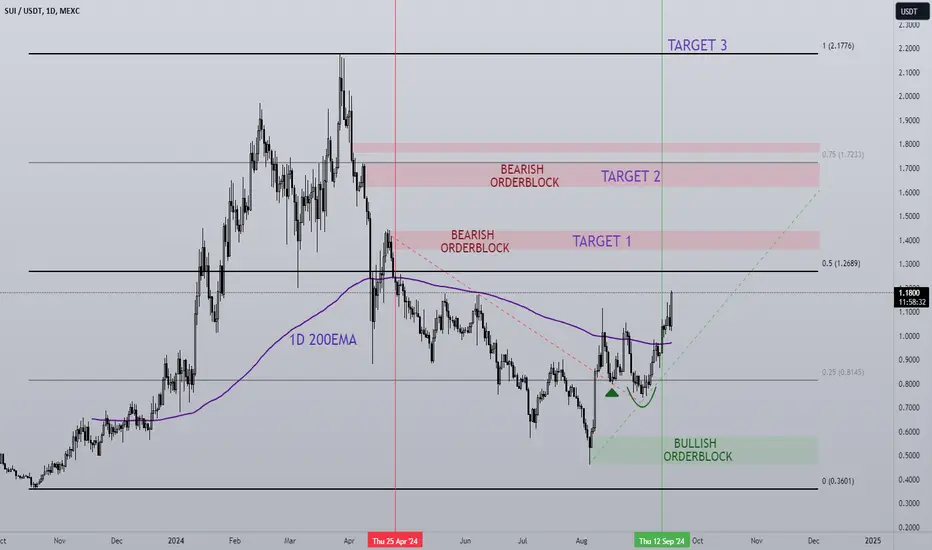
SUI/USDT 1D SUI has been one of the better performing L1's and altcoins in general in the last 6 months that BTC has been chopping/ranging.
There are a few key points on the SUI chart that catch my eye:
- 1D 200EMA is now flipped bullish with a strong reaction after flipping the level, this shows buyers are confident in the project and happier to buy at higher levels, instead of waiting for a pullback for example.
- Clear Higher high and higher low structure indicating a bullish trend on the daily. Invalidations are more obvious when a structure like this is broken.
- Plenty of room to grow going into Q4, the range is clearly mapped out with key Orderblock levels that will more than likely be resistance levels and so they are the targets to take profits, hedge or de-risk while assessing where SUI will go.
With this being SUI's first Bullrun history shows the newer projects do better off in terms of ROI that's if they survive, from what we have seen so far this cycle I believe SUI will be a strong project going forward.
$SUI/USDT Bullish scenarioNYSE:SUI is demonstrating solid momentum as it nears a key resistance point. A confirmed breakout might propel NYSE:SUI into a price discovery phase.
Cryptocurrency prices can change a lot, sometimes very quickly. It's important to be mentally prepared for these ups and downs. It's best to think long-term and not make impulsive decisions based on short-term changes.

Sui (SUI) may be poised for long-term gainsIn a recent update, the Circle is announcing native USDC on SUI, which has kept up the bullish momentum. Moreover, yet another big announcement is expected to happen shortly, which may bring a huge retail brand onto the platform. The SUI price has risen back into a technical HTF uptrend again, forming consecutive higher highs and lows while the key level has been taken out already. Hence, the price is expected to surprise many in the next few weeks or months.
The latest upswing has triggered a breakout from the descending parallel channel and the bulls are successfully holding the rally above the gains. The price has failed to break the crucial resistance at the 200-day MA at $1.099 over the past couple of days. However, after testing multiple times, the resistance could have become slightly brittle. As the volume has gained some momentum, the bullish continuation appears to be imminent. Moreover, the DMI is approaching a bullish crossover as the ADX initiates a bullish rebound.
Therefore, the price remains consolidated for a while, which may bring the +Di & -Di closer to each other for a bullish crossover. Once this move materializes, the SUI price rally may gear up and secure a rise above $1.5, confirming a rise in bullish dominance. The current trade setup does not show a bearish possibility and if it occurs, the resistance of the channel may offer strong support & push prices towards $2.

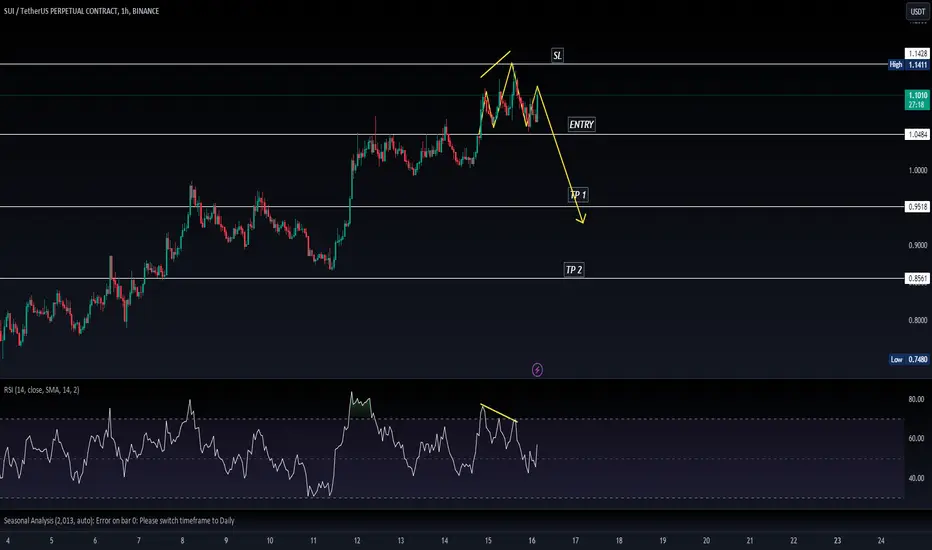
#SUI/USDT#SUI
We have an uptrend pattern on the 4-hour frame, the price is moving within it and adhering to its limits well and heading to touch you again
We have a resistance area in green at a price of 1.12 if the price touches it and rebounds from it
We have a trend to touch the moving average 100
We have an uptrend on the RSI indicator that supports further decline
Entry price 1.09
First target 1.062
Second target 0.9757

SUI Resistance and ascending wedgeAscending Wedge: It's bearish formation and there is ascending wedge in price for the last 3 months.
Also $1.14 - $1.23 range working well as a resistance since May 2024. The price just touched there yesterday and getting rejection normally.
Personally targetting $0.57 - $0.6 range for good support area because of these reasons for now.

SUI price gains 139% in 42 Days: can it reach $2.07? Becoming one of the top-performing cryptos last week, the SUI price continued a bullish trend for two weeks. As the demand for altcoins grows and the broader market recovery chances improve with the rate cut possibilities, buyers are lining up for SUI.
Will a new breakout run and the price jump of 50% Fibonacci level result in a new all-time high for SUI this year? Let’s find out.
With a falling channel pattern in the daily chart, the SUI price is on a bullish recovery rally. Following the channel breakout, the SUI consolidated between the 23.60% and 50% Fibonacci level, ranging from $0.73 to $1.05.
With broader market crypto recovery last week, the SUI price reclaims the $1.00 psychological mark and surpasses the 50% Fibonacci level. Further, the SUI recovery creates a rounding bottom in the daily chart with a neckline at the 50% Fibonacci level.
Currently, the SUI price is trading at $1.1079 with an intraday gain of 2.73%. From its recent bottom at $0.46 on 5th August, the SUI price is up by 139% in just 42 days.
As the recovery rally gains momentum with the recent rounding bottom reversal, the channel breakout rally is likely to exceed the 61.80% Fibonacci level at $1.2371.
With three consecutive bullish candles and the breakout rally gaining momentum, the SUI price is just 49.20% away from its previous swing high at $2.1816. Based on the Fibonacci levels, the upcoming target levels for the SUI token are $1.55 and $2.07.
Optimistically, the logarithmic price chart and the Fibonacci levels present $4.8051 as an ideal year-end target. Hence, with a massive upside potential of more than 300% and an ongoing recovery crossing $1, the SUI token is one of the fastest altcoins to watch in the crypto market.

SUIUSDT.PSUIUSDT.P is in bullish trend.
Bearish divergence also shown in RSI.
Head and should reversal pattern seems to be formed.
strong sign of reversal .
We wait and watch for the breakout of last LL.
SUI Bearish correctionafter a huge bullish jump in last days, now the resistance key level is reject the power of buyers to have a bearish correction.
next days are very very important for cryptocurrency market, FED issues are on the way. be smart

$SUI (#SuiNetwork)🔻 Current Situation: expect a breakout in either direction.
🔻 Priority Target: $1.2 is the initial goal. The situation will need reassessment after that level.
🔻 Trend Break Point: A reversal pattern will be confirmed with price holding above $1.2 after a retest. Ideally, the price shouldn’t fall below $1 afterward.
🔻 Support Levels: In case of a downside breakout, the nearest support is $0.5 - $0.56.
🔻 Fundamentals: Strong downward pressure due to token unlocks. Large FDV market cap, weak ecosystem. However, there’s positive news emerging around #Grayscale, #SuiPlay0x1, offline transactions, etc.
🟢 Green zone = buying opportunities. 🔴 Red zone = selling or profit-taking zones. Watch for setups and price action in these key areas.

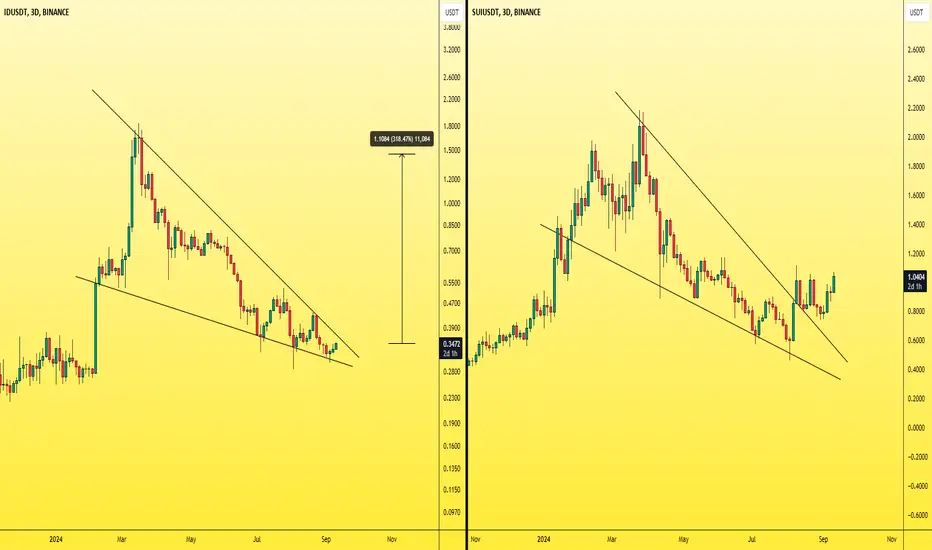
[IDUSDT] - worthy to buyadd BME:ID to the coins which are worth collecting
chart is very similar to NYSE:SUI and it always follows it after few weeks in the same way of rising
Project ✅️
The chart✅️
our target is: 1.45$
buy now u than me later
best regards ceciliones🎯
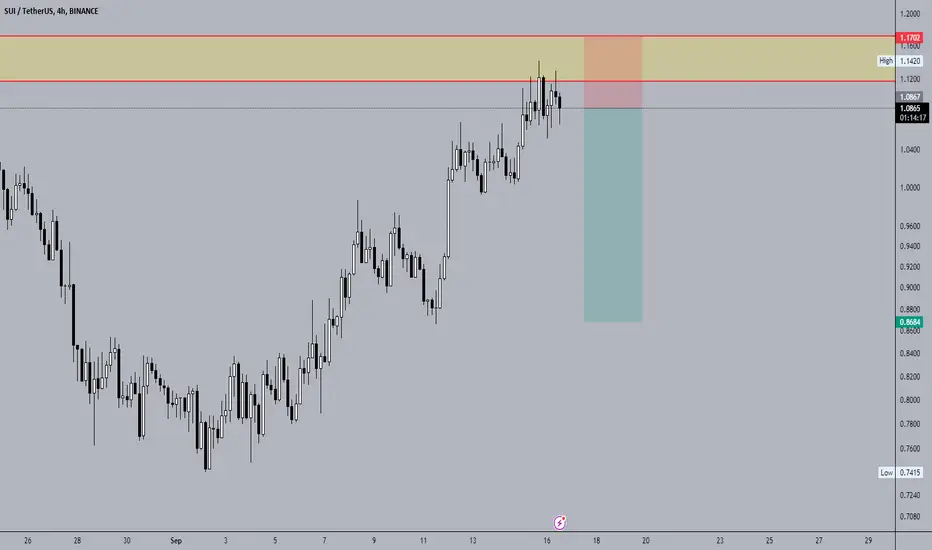
$SUI - 4h Intraday Trade Idea- Set an alert for top of H4 POB at around 0.974, inside the H4 FVG.
- Enter after MSB on M15 chart.
- Target Weekly S/R

SUIUSDT(SUI) Updated till 12-09-24SUIUSDT(SUI) Daily timeframe range. PA been stuck between 0.7659-1.0158 for a while now. its trying to break through 1.0158 but a clean break needs market stability and retail interest. it got a open space above 1.0158. recent support at 0.7659.
