SUIUST trade ideas

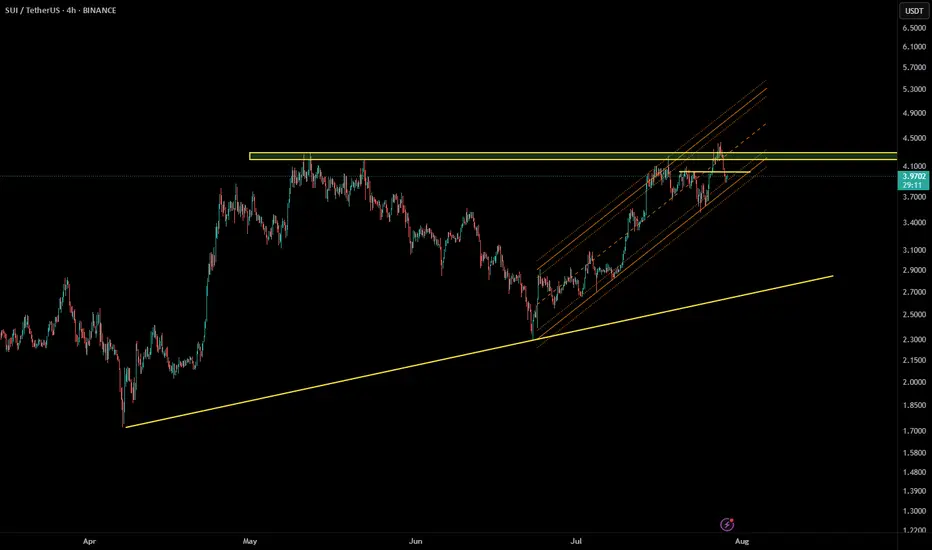
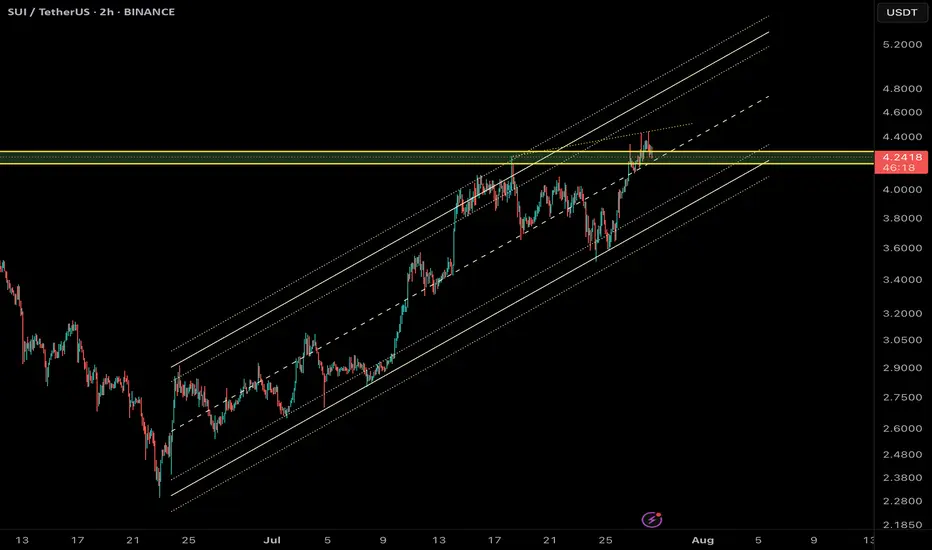
SUI/USDT Update – Bearish Structure Confirmed📉 SUI/USDT Update – Bearish Structure Confirmed
Yesterday, we shared a bearish outlook for SUI from the $4.2 region, anticipating a potential rejection from that key supply zone. Since then, price has respected the resistance and shown early signs of weakness.
Here’s what we’re seeing now:
🔹 Elliott Wave Perspective
Price seems to be completing a Wave C of a larger Zigzag structure.
This upward move is forming an Ending Diagonal (ED)—a terminal pattern usually marking exhaustion.
The diagonal is weakening near the top of a multi-month resistance, adding confluence to the bearish setup.
A break below the lower channel could trigger a deeper correction toward:
$3.35 (first support)
$3.00 (major structural demand)
🔸 ICT / Smart Money Outlook
Price swept the liquidity above previous highs (~$4.2), creating a buy-side liquidity grab.
A Bearish Order Block is active around $4.05–$4.15.
📊 Analysis by @CryptoPilotAI
🔔 Follow for more smart market updates.
Signs of a Market Structure Shift are emerging as lower highs begin forming.
Watch for price to revisit the Fair Value Gap (FVG) near $3.65–$3.35, a likely target for rebalancing inefficiency.
✅ Conclusion
Unless bulls reclaim $4.15 with strength, this looks like a distribution phase with downside continuation expected.
📌 Short Bias Active – Waiting for channel break and confirmation.
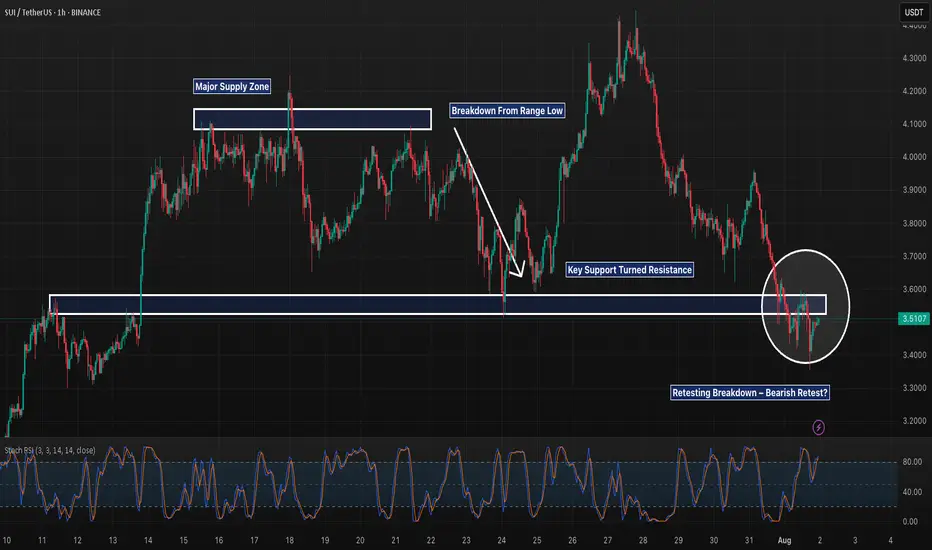
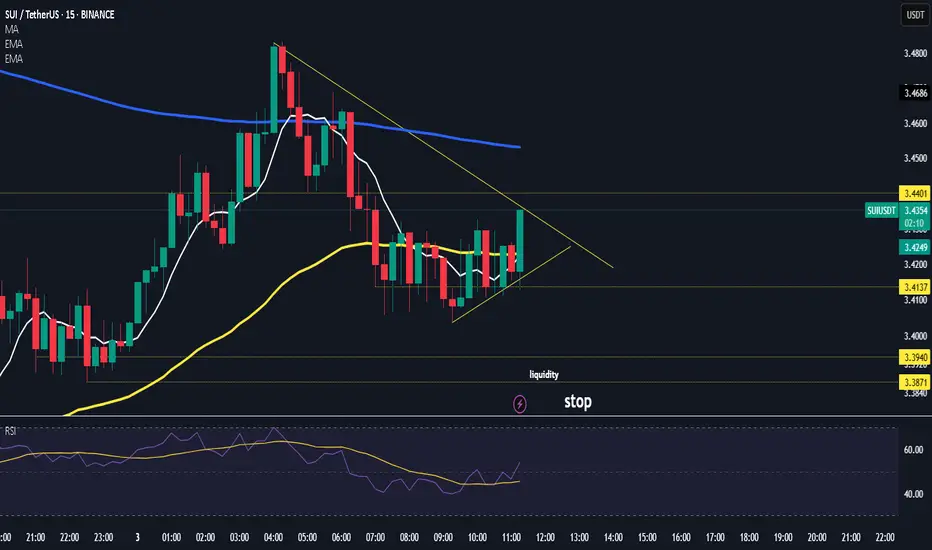
SUI 1H – Breakdown & Retest of Key Support, But Will It Reject?SUI 1H – Breakdown & Retest of Key Support, But Will It Reject or Reclaim?
Description:
SUI just completed a textbook range breakdown after weeks of sideways chop between ~$3.60–$4.10. The prior support floor has now flipped into resistance, and the recent bounce appears to be retesting that structure. If this retest gets rejected, continuation toward lower support zones (potentially $3.30 and below) becomes likely.
However, reclaiming and holding above $3.60 could trap late shorts and fuel a squeeze. Structure still favors bears for now, but it’s decision time.
📌 Breakdown structure
📌 Bearish retest
📌 Eyes on confirmation or invalidation
This is the battle zone — stay sharp.
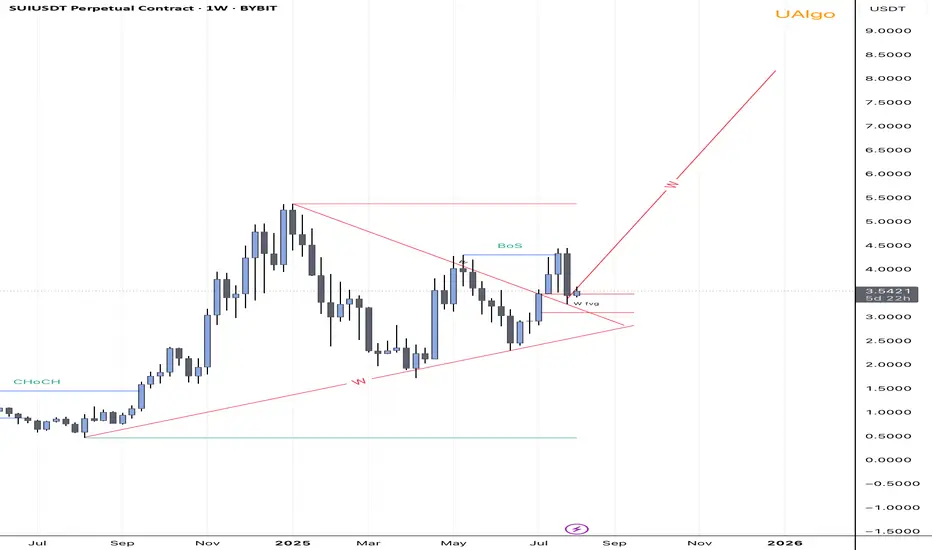
SUI Bullish Breakout Confirmed- $8 Target In sight! Hey everyone,
Today marks an important moment for SUI. We’ve just witnessed a clean breakout from a long-term symmetrical triangle on the weekly timeframe, supported by a confirmed Break of Structure (BoS) and a weekly Fair Value Gap (FVG) acting as strong support.
Price respected the FVG zone and bounced, showing clear bullish intent. With strong structure forming and momentum building, I’m targeting the $8 region as the next major level of interest. Market structure is bullish, and the confluence of trendline support, FVG, and the breakout gives me confidence in this move.
Key Highlights:
• Weekly CHoCH followed by BoS 🚀
• Price broke out of triangle and retested FVG🚀
• Bullish continuation structure (W formation)🚀
• Targeting $5.5 → $8 range if momentum holds🚀
#SUI Update #2 – July 31, 2025#SUI Update #2 – July 31, 2025
SUI has completed the correction of its last impulsive move and has started another upward movement. Although it currently appears to be a weak move, I believe it will provide around a 10% profit. As shown in the chart, I have opened a long position.
$suilong this bubba
weekly close might sweep liquidity so keeping some for there
targeting ATH
shall post HTF chart
Sui Works To Break Resistance · Play To Win · No StressA flat bottom is bullish because support can be confirmed as found when sellers (bears) fail to move prices past a certain point. A flat bottom produces the double-bottom and triple-bottom reversal signals. When the bottom is flat, depending on the phase the market is going through, we can easily say bullish. A flat top is not bearish, it is a completely different story.
A flat top does not confirm resistance being found and thus a new bearish wave. We need context, it all depends on the phase of the market cycle. A flat top with a rising bottom is bullish. Resistance has been found and is being challenged. It is getting weaker because the action is converging towards the resistance point based on the rising bottom.
Here we have a flat top with a rising bottom (higher lows). The market is bullish. SUIUSDT has been bullish and growing since late 2024. This is the content we need. A bullish tendency, a rising market and resistance being challenged more than once starts to reveal a picture. Next this resistance won't have enough strength to hold. Next time SUI moves up it will continue rising to produce a new all-time high and this will unleash a price discovery phase.
SUIUSDT is trading above EMA55 and EMA89. The last challenge of resistance produced a rejection but this rejection did not lead to a test of the above mentioned support. Another signal of strength.
Sellers cannot push prices lower because buyers are active, or simply put, there are not enough sellers to start and thus the retraces become smaller and shorter. Price dynamics favoring the bulls.
The lows are getting higher, the top remains the same. When the low meets the top that is when resistance breaks. Sui is going up, it will continue to grow; the targets on the chart can be hit short-term.
There is no sense of urgency, but a major advance can be happening within days.
Are you ready to trade and hold? Prices going up aiming high trading requires no effort.
The effort is mental, the mind can be trained to succeed and avoid stress. Mental stress = lack of knowledge. If you know prices are going up and you feel certain about it, no effort is required to win because the mind doesn't have to struggle with questions relating to the strength of your position. The mind does not need to answer, should I buy or should I hold? Since you know prices are going up based on the chart, you can sit back and relax watching your profits grow. Reading relaxes the mind. Knowledge is food for the soul. The more you learn, the more you know the wiser you become. Wise means effortless. Trading can be effortless if you read the right stuff. Play to win. Plan before trading and you already won.
Answer the question before the situation shows up. That's it, you've just removed the complexity out of the game. When there is no complexity, there is no mental stress. Since you are sitting on a chair in front of a device, trading becomes effortless. To trade with peace in your mind you just need the right knowledge and that is what you are getting here. No stress.
Continue reading and watch your profits grow. Increase your peace, free up your time and enjoy better results.
Namaste.

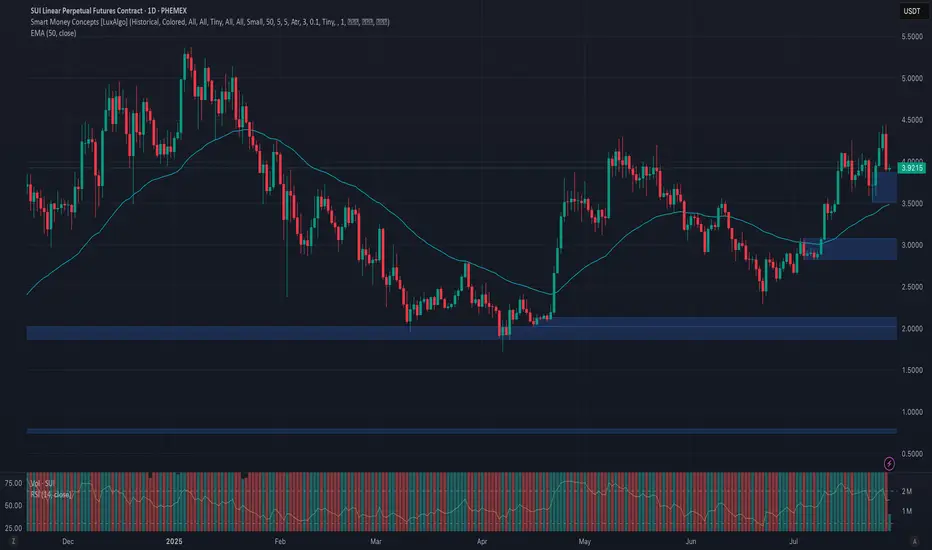
Phemex Analysis #100: Pro Tips for Trading Sui (SUI)Sui ( PHEMEX:SUIUSDT.P ) has swiftly emerged as one of the most promising Layer 1 blockchains, well-known for its focus on scalability, high throughput, and developer-friendly infrastructure. Recently, Sui has attracted significant attention thanks to its growing DeFi ecosystem, strategic partnerships, and community enthusiasm.
Over the past 2 weeks, SUI showed robust bullish activity, rising more than 30% to break key resistance around $4.3, and it’s now trading at around $3.9. The current price action indicates a potential continuation of bullish momentum, yet traders remain cautious about possible retracements and volatility.
Let’s carefully examine a few likely scenarios for SUI and determine how traders can capitalize strategically.
Possible Scenarios
1. Short-term Retracement (Healthy Pullback)
Following the recent rapid price rise, SUI might experience a short-term correction toward previous resistance-turned-support near $3.6. A low-volume retracement to this level could represent a healthy pause before the next bullish leg.
Pro Tips:
Buying the Dip: Closely watch support around $3.6; a successful retest on lower volume could present an ideal buying opportunity.
Volume Monitoring: Pay close attention to volume levels during the pullback—a low-volume dip indicates healthy profit-taking rather than bearish reversal.
2. Bullish Breakout (Pushing Higher!)
If SUI maintains bullish momentum and successfully holds above recent support around $3.8, it may continue to target higher resistance levels. Strong buying volume accompanying further gains could send SUI towards key resistance zones around $5.0 and potentially breaking previous all-time-high $5.37.
Pro Tips:
Entry Signals: Consider buying positions on a high-volume breakout confirmation above $4.45, signaling bullish continuation.
Profit Targets: Plan partial profit-taking around $5.0 and $5.37 resistance zones to lock in gains.
3. Bearish Scenario (Deeper Correction)
If broader market sentiment turns negative or if buying volume significantly weakens, SUI could break below $3.6, signaling bearish pressure. In this scenario, deeper corrections towards support levels at $2.8 or potentially $2.3 may occur.
Pro Tips:
Short Opportunities: Experienced traders could consider shorting or reducing exposure if SUI decisively breaks below the key $3.6 support level on increased selling volume.
Accumulation Strategy: Long-term investors can strategically accumulate positions near stronger support zones around $2.8 and $2.3 after confirming price stabilization.
Conclusion
Sui (SUI) currently offers compelling trading opportunities driven by recent bullish activity and increasing ecosystem growth. Traders should stay alert for critical breakout levels ($4.45) and monitor essential support areas ($3.6) closely. By applying disciplined trading approaches, setting clear profit targets, and managing risk prudently, traders can navigate SUI’s volatility with greater confidence and potentially maximize gains.
🔥 Tips:
Armed Your Trading Arsenal with advanced tools like multiple watchlists, basket orders, and real-time strategy adjustments at Phemex. Our USDT-based scaled orders give you precise control over your risk, while iceberg orders provide stealthy execution.
Disclaimer: This is NOT financial or investment advice. Please conduct your own research (DYOR). Phemex is not responsible, directly or indirectly, for any damage or loss incurred or claimed to be caused by or in association with the use of or reliance on any content, goods, or services mentioned in this article.

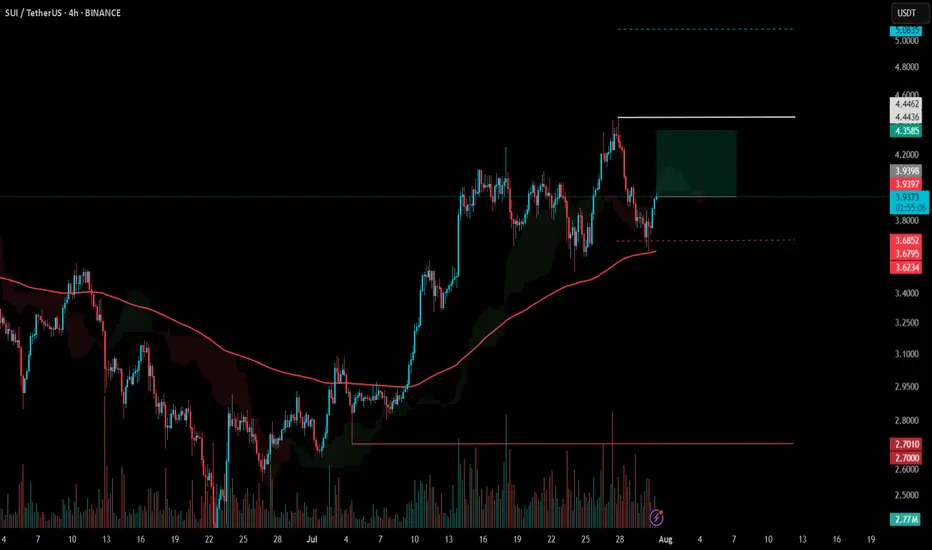
SUI to $5.31? Chart Says It’s 22% Away!SUI is shaping up beautifully on the daily chart. After spending weeks in a consolidation zone, the price has finally broken out with strong momentum and reclaimed bullish territory. The CM_EMA TrendBars are showing green, which confirms a positive directional shift. This indicates the bulls are now back in control.
The most recent breakout has pushed SUI above a key structure level near $3.93, turning previous resistance into new support. What’s impressive is that price didn’t just break this level — it retested it and bounced sharply, suggesting strong buyer interest. This kind of price action is typically seen before continuation moves.
Currently, the setup shows a clean bullish structure. Price is holding firmly above the moving average and is supported by recent higher highs and higher lows. If this momentum continues, SUI could be on its way toward the next major resistance zones, clearly marked on your chart as Profit Target 1 ($5.014) and Profit Target 2 ($5.312).
Volume seems steady, not explosive, but enough to support a sustainable climb — which is ideal for swing setups. This gives the chart a healthy look, especially in the context of the wider altcoin recovery theme.
Now, let's talk about risk. The Stop-Loss is logically placed at $3.602, just below the most recent breakout level and the prior base structure. If the price breaks below this zone, it would likely invalidate the current bullish setup.
🎯 Trading Idea Based on Chart Setup:
• Entry: $4.213 (current zone)
• Stop-Loss: $3.602
• TP1: $5.014 — near-term resistance
• TP2: $5.312 — full extension target
• Risk-to-Reward: ~2.36 on TP2 💹
This is a favorable setup for swing traders with clear levels and a clean chart structure. The EMAs are aligned bullishly, and the breakout has followed a strong trend resumption. If the market conditions continue supporting altcoins, SUI has the potential to outperform in the coming weeks.
In summary, SUI is in a confirmed uptrend, riding strong momentum after a clean breakout. As long as price holds above $3.93 and especially above the stop at $3.60, the path of least resistance remains upward.

SUI RETESTING THIRD IMPULSE HIGH - 2 SCENARIOSSUI could come back down to retest the trendline break. It has just retested the third impulse high. Set up is still valid. Respecting the trendline(s) for the time being. 2 scenarios could play out - higher or lower...hahaha.

$SUI breaks out with strength!CRYPTOCAP:SUI breaks out with strength, now watching for retest!
SUI has broken above its consolidation range and key resistance zone.
Price is now pulling back slightly, and a retest of the breakout area around $4.00–$4.10 could offer a good continuation setup.
If this level holds, the next leg up toward $5.20–$5.30 is likely.
Breakdown below $3.95 would invalidate the breakout structure.
DYOR, NFA
#SUI #Altseason2025
SUI/USDT Massive Cup and Handle Pattern Unfolding Is a Breakout?🧠 Technical Overview:
The daily chart of SUI/USDT showcases a textbook formation of the Cup and Handle pattern — a powerful bullish continuation signal that often precedes explosive upside moves.
The “Cup” took shape between January and July 2025, reflecting a deep rounding bottom. This indicates a long-term accumulation phase where bears gradually lose control.
The “Handle” is currently forming as a downward-sloping consolidation channel, often known as a bullish flag, which is typically the final pause before a breakout.
🔍 Key Technical Levels:
Current Price: $3.9661
Support Zone: $3.96
Major Resistance Levels to Watch:
$4.10 (handle resistance & breakout trigger)
$4.40 (local structural high)
$4.77 (previous high & fib extension zone)
$5.00 (psychological level)
$5.36 (measured move target from cup breakout)
---
🟢 Bullish Scenario: Breakout Incoming
If price breaks and closes above the handle resistance around $4.10, backed by increasing volume:
This confirms the Cup and Handle breakout.
Expect a rapid move toward $4.77 – $5.36 in the short to mid term.
The height of the cup projected upward gives a target of approximately +35% gain from breakout point.
🔔 Watch for:
Bullish engulfing candles
Volume spike during breakout
Break of upper trendline from the handle
---
🔴 Bearish Scenario: Breakdown Risk
If the price fails to hold the $3.96 support and breaks down from the handle channel:
Price may retest lower support zones near $3.60 or even $3.20
However, as long as the cup’s base at ~$2.50 holds, the macro bullish structure remains valid.
⚠️ Invalidation: A daily close below $3.60 would invalidate the short-term bullish setup.
---
📊 Pattern Psychology:
The Cup and Handle pattern reflects investor accumulation, shakeout, and renewed confidence. This is often seen in strong uptrending markets — and the current structure suggests that bulls are quietly preparing for a potential breakout.
---
📅 Timing Outlook:
Handle formations typically last between 1–3 weeks. If this timeline holds, a breakout could occur before mid-August 2025.
---
✅ Conclusion:
The technical setup for SUI/USDT is extremely compelling. With a strong Cup and Handle pattern nearing completion, and key resistance just overhead, traders should prepare for potential breakout conditions. A confirmed move above $4.10 could trigger a bullish wave toward $5.00+.
📌 Set alerts. Manage risk. And don’t ignore the volume.
#SUI #SUIUSDT #CryptoBreakout #CupAndHandle #BullishSetup #CryptoChartPatterns #AltcoinAnalysis #TechnicalAnalysis #BreakoutTrade
SUI Hits Key Liquidity Zone After – Correction Ahead?SUI has been climbing steadily inside a well-structured ascending channel for the past few weeks. The recent breakout above the $4.30 resistance zone – which was a key liquidity level – seems to have swept stop-losses and trapped late buyers.
🔎 Here's what we're watching:
- Price broke out of the ascending channel briefly and rejected from the upper parallel.
- The breakout above $4.30 was likely a liquidity grab (buy-side liquidity taken).
- Price is now pulling back, showing signs of distribution below resistance.
📉 Expecting a correction toward the lower channel line as price seeks rebalancing.
🧠 Strategy Notes:
- No reason to long here unless price reclaims $4.35 with volume.
- Ideal buy zone is near the midline or lower channel.
- A break below the channel could signal deeper correction toward $3.60 or lower.
📊 Always respect risk – don’t chase after price in these zones.
📡 Analysis by CryptoPilot – navigating the market with precision.
#CryptoPilot #SUI #SmartMoney #LiquidityGrab #CryptoTrading #TrendChannel #Altcoins
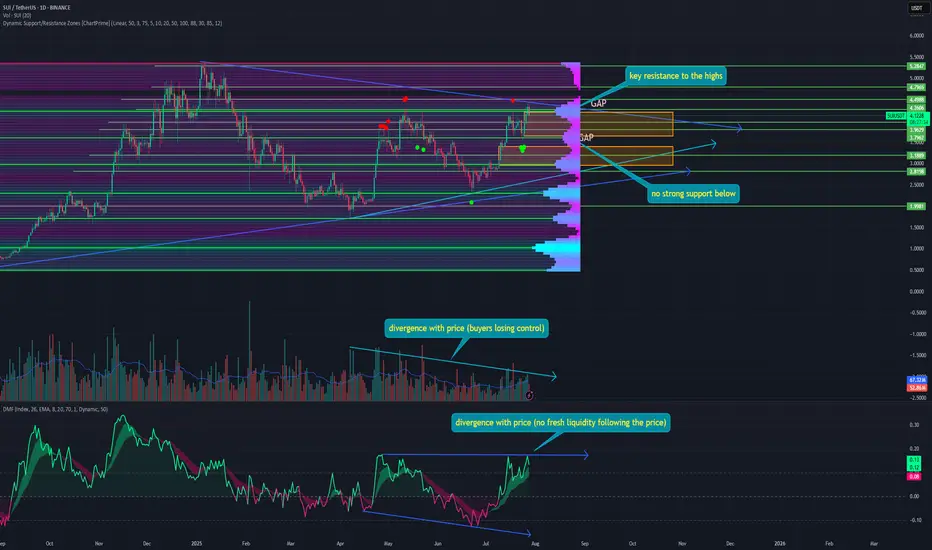
SUI is currently the most overvalued token, and here's whyOne of the main beneficiaries of the cycle is once again close to its highs. However, it does not appear that the token is ready to update them, and here's why:
➡️ The first thing that catches the eye is the divergence in purchase volumes. The higher the growth, the lower the purchase volumes, which signals a depletion of purchasing power as growth continues. This could soon lead to bears taking control.
🔹 Second, this is why even a minor takeover by the bears could be critical. As can be seen from the dynamic support and resistance levels, there are no strong support levels in the immediate range. They only start at $2.29. Meanwhile, right now, the token has hit resistance at $4.25.
🔹 Third, two gaps have formed at the bottom at the levels of $4.20 - $3.64 and $3.39 - $2.95. And as we know, 99% of gaps close sooner or later, pulling the price with them.
🔹 Fourth, the Money Flow indicator also shows divergence with the price. The current high is higher than in May 2025, but the amount of liquidity is the same. So there are not more buyers, just fewer sellers, at least for now.
But with each decline, liquidity is increasingly leaving the token, forming new lows on the indicator.
📌 What is the result?
SUI is currently moving upward purely in line with the overall market movement. But the structure looks very fragile, and when the correction in BTC and, in particular, ETH begins, SUI will be one of the first to fall.
So, I am only considering shorts in the token right now; longs will become attractive no earlier than at the $2.28 level of the market structure.
🔥 Subscribe so you don't miss out on the latest market analysis!
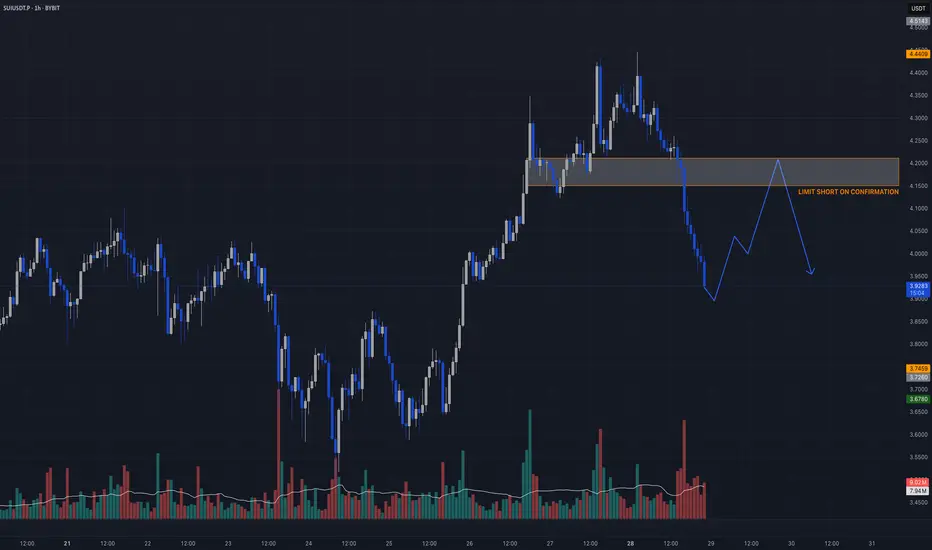
$SUIUSDT.P – INTRADAY SHORT IDEAAfter the impulsive sell-off, we’re eyeing a short entry on a potential rally into the FVG + prior support zone between $4.10–$4.20. No need to chase — let price return to our level of interest and confirm weakness.
🎯 Direction: Short
📍 Entry Zone: $4.15–$4.20
🩸 Stop Loss: $4.50
💸 Take Profits:
TP1: $3.20
TP2: $2.80
🧠 Setup Logic:
– Price broke down impulsively, leaving inefficiency behind
– $4.10–$4.20 = prior support + fair value gap
– Watching for M5–M15 CHoCH/BOS on retest
– Funding spike on bounce = ideal short trigger
This is not a blind short — wait for structure shift confirmation on the LTFs.
Candle Craft | Signal. Structure. Execution.
SUI Price Idea
Be Carefull and Full Patient on SUI today because if the price break and closing under Choch Line the probability to go down is possible, but if break the line without closing below the line we can wait for the choch on the low Time Frame for buy opportunity
#staysafu

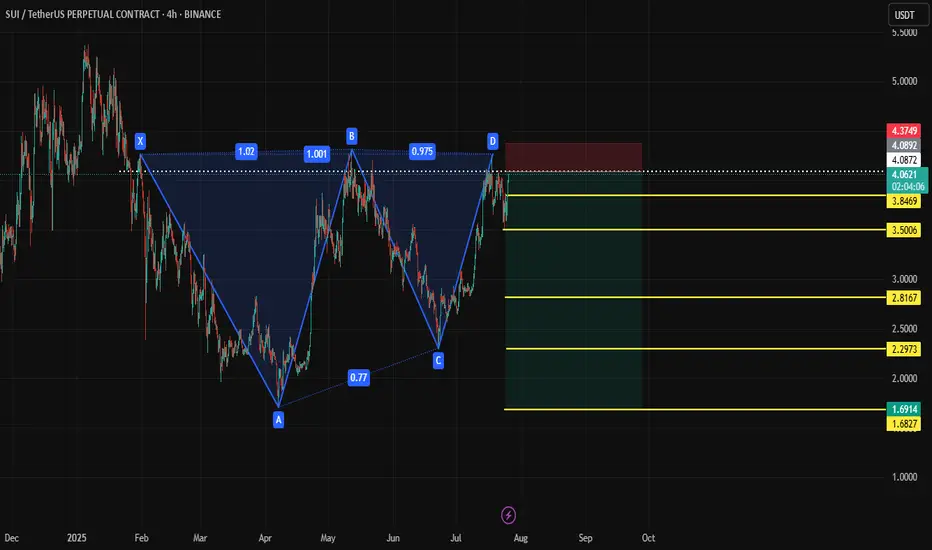
SUI Shortanalysis for sui bearish pattern
Short Entry: $4.10 – $4.20
Stop-Loss: $4.35+
Target 1: $3.60
Target 2: $3.10
Target 3 (Full XA move): ~$1.75 (aggressive)
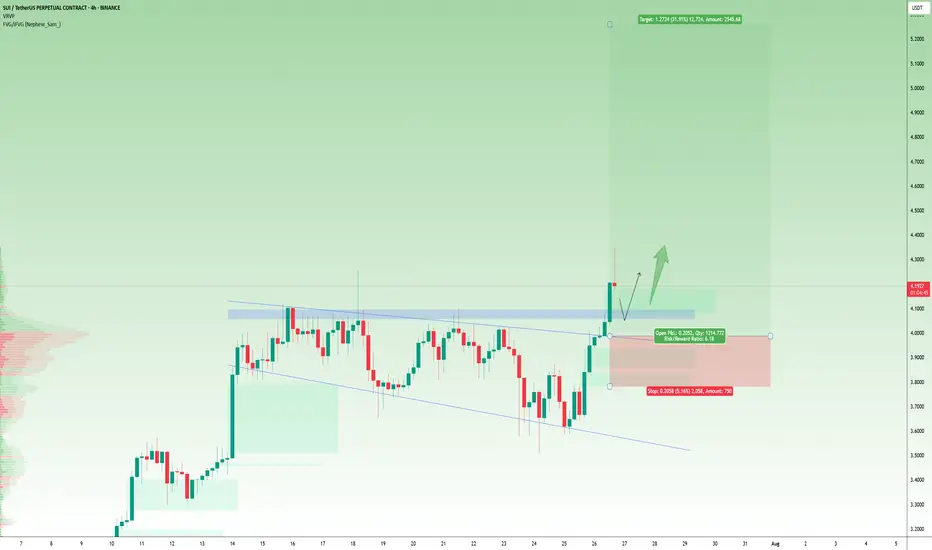
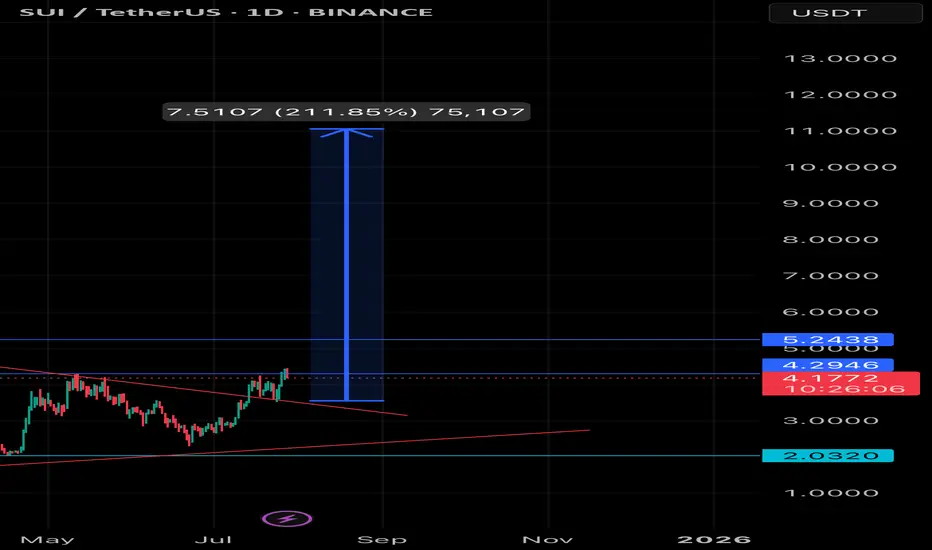
SUI/USDT – Ready for a Major Breakout (211% Potential🚀 SUI/USDT – Ready for a Major Breakout (211% Potential)
🔍 Analysis:
SUI is testing the upper resistance of a long-term symmetrical triangle.
• Price broke above descending trendline
• Strong bullish momentum and volume
• Next resistance zone: $4.29 – $5.24
• Measured move suggests a target near $12
Trade Setup:
• Entry: $3.54-$4
• Stop-Loss: $3.45 (below structure)
• Target: $7.50–$12 (based on pattern projection)
Conclusion:
This breakout could lead to a 211% rally if confirmed. Watching for continuation above $5.25.
📌 Bias: Strongly Bullish ✅
#SUIUSDT #CryptoBreakout #Altcoins #TechnicalAnalysis #SUI
Tension Builds on SUI Chart — Eyes on $3.85CRYPTOCAP:SUI is moving inside a symmetrical triangle pattern.
The price is getting tighter, forming higher lows and lower highs.
This usually means a breakout is coming soon.
If it breaks above the triangle with strong volume, SUI could jump to the $4.60–$4.70 range.
For now, it’s a wait-and-watch setup.
Key support is just below $3.85, staying above that keeps the bullish trend alive.
#Altseason2025

#SUI HTF Update Major update on #SUI after 6 months or so...
We have been tracking this idea since 2024, i am still biased with entire market & not looking at 2026 for ONE MORE run up, we just have few months left now & with august coming up i believe we will see one final dip before blasting everything in September. Majors topping around September & other alts like sui probably in October.
I have already updated about my positions before do check if you haven't yet.

SUI / USDT : Looking bullish SUI/USDT chart shows a breakout from a descending trendline, confirming upward momentum. Current price tests the resistance zone around $4.00. BTC is receiving support from the FVG, indicating short-term bullish potential.
Bullish Scenario: If price breaks above the resistance zone, a rally towards $4.50 to $5.00 is possible. Watch for confirmation of higher highs on shorter timeframes.
Invalid Setup: If price fails to break the resistance and falls back below $3.50, the bullish setup would be invalidated.
Pro Tip: Always wait for a clear confirmation candle above the resistance zone before entering a trade to minimize risk.

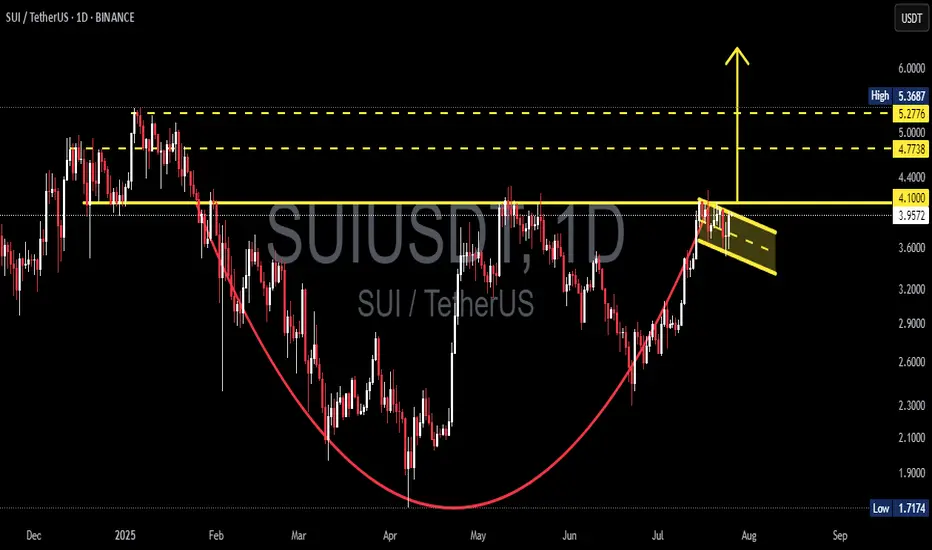
SUI Trendline Broken
➡️ SUI has broken the green descending trendline originated on the early 2025 high.
➡️ Price is also being held by the gray support zone around 3.60.
➡️ Next target is the blue supply zone at 5.00 round number.
➡️ Invalidation is at 2.2937 (pink line), so be wary of liquidity hunts below gray support.
