#SUI/USDT#SUI
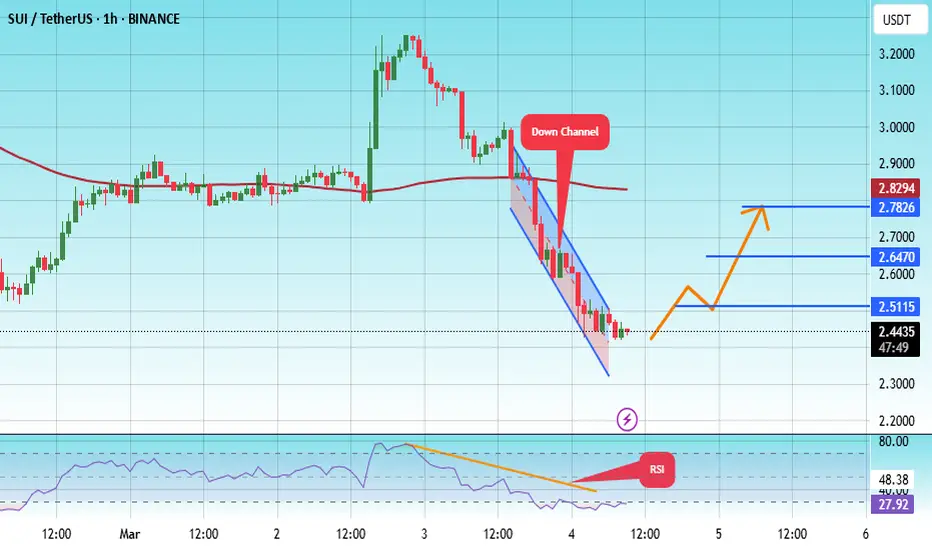
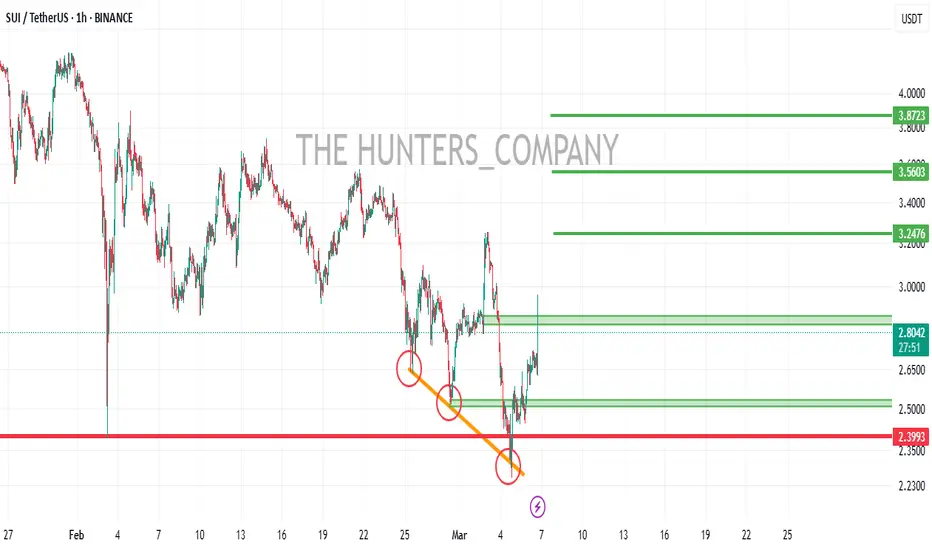
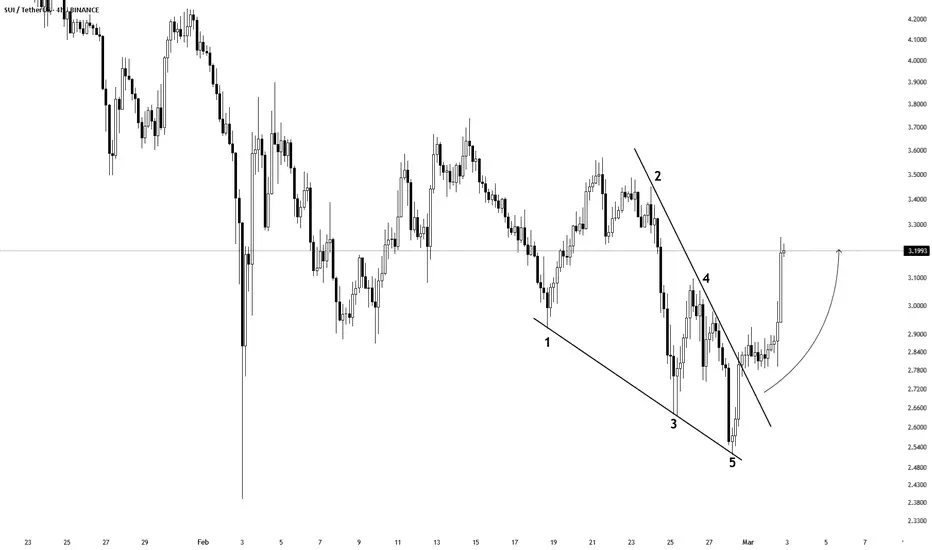
The price is moving in a descending channel on the 1-hour frame and is adhering to it well and is heading to break it upwards strongly and retest it
We have a bounce from the lower limit of the descending channel, this support is at a price of 2.36
We have a downtrend on the RSI indicator that is about to break and retest, which supports the rise
We have a trend to stabilize above the Moving Average 100
Entry price 2.44
First target 2.51
Second target 2.64
Third target 2.78
SUIUST trade ideas
#SUI/USDT#SUI
The price is moving in a descending channel on the 1-hour frame and is adhering to it well and is heading to break it strongly upwards and retest it
We have a bounce from the lower limit of the descending channel, this support is at a price of 2.40
We have a downtrend on the RSI indicator that is about to be broken and retested, which supports the rise
We have a trend to stabilize above the moving average 100
Entry price 2.48
First target 2.59
Second target 2.76
Third target 2.90

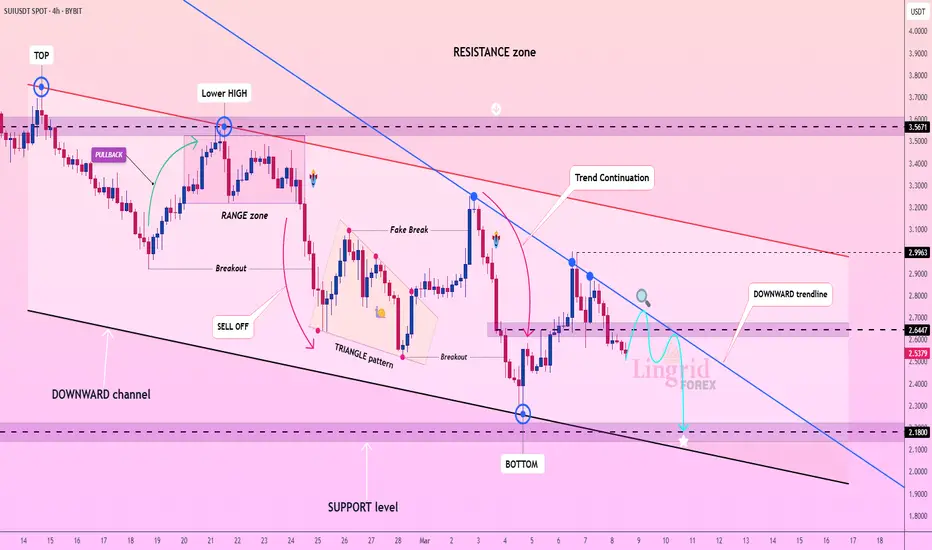
Lingrid | SUIUSDT continued DOWNTREND with NEW Lower LowsBINANCE:SUIUSDT is currently showing lower lows, indicating a selling trend in the market. Although it seems to have stabilized around the 2.50 level, a closer look at the price action reveals the formation of bearish long-tailed bars, suggesting potential for further declines. Given the prevailing bearish dominance, I think there is a possibility that the price may retest the support area above 2.00. I expect it to be a critical point for the market in the near future. The bearish sentiment suggests that we may look for opportunities to short the asset as it approaches this support level. My goal is support zone around 2.18
Traders, if you liked this idea or if you have your own opinion about it, write in the comments. I will be glad 👩💻
Sui new ranges for scalping - Currently making lower High lower Sui has been constantly forming lower low and lower high and it looks like its about to hit another lower low range marked and i will be aping in small from that range.
SUI DAILY TIMEFRAME UPDATE (ON DEMAND) ❤️ THIS POST AND I WILL SHARE NEXT 10X GEM COIN
Sui is a groundbreaking layer-1 blockchain platform designed to support the needs of global adoption by offering a secure, and scalable development platform
ANY THOUGHTS ON CRYPTOCAP:SUI ?
Sui: Mixed Signals With A Hard Chart (Bullish Later)I don't like it when there is too much empty space below the active candles, you what I mean? Below support here on the chart, there is just too much room for prices to move lower. But, when we are looking at a strong project things can be different but I still don't like it.
SUIUSDT. The level that worked as resistance in October 2024 is now working as support, March 2025. This is a good signal.
The action is still weak and there can be lower prices but, I bet there is some bullishness coming from the RSI and this indicator is what we will consider next.
The RSI bottomed 7-Feb. while SUIUSDT hit its lowest price 4-March. So we have a small bullish divergence, an early bullish signal.
The down-wave first bounced perfectly off 0.618 Fib. retracement, on a wick. Now there was a wick below this level but two close above. This is another positive signal but still early and still weak. So it is mixed.
It is possible that SUIUSDT can start to reverse, but the fact is that it is moving lower and there is now volume, yet, to support a bullish wave.
It will recover soon enough near support. It will recover very soon... That's for sure.
Allow for some swings but it won't be too long. The Cryptocurrency market as a whole will grow.
I am betting up.
Namaste.

SUI is hitting support can it pivot?SUI hit a good level of support but we need evidence of a reversal. A pivot point structure would give us the confidence that we are no longer in a downtrend.
Full TA: Link in the BIO

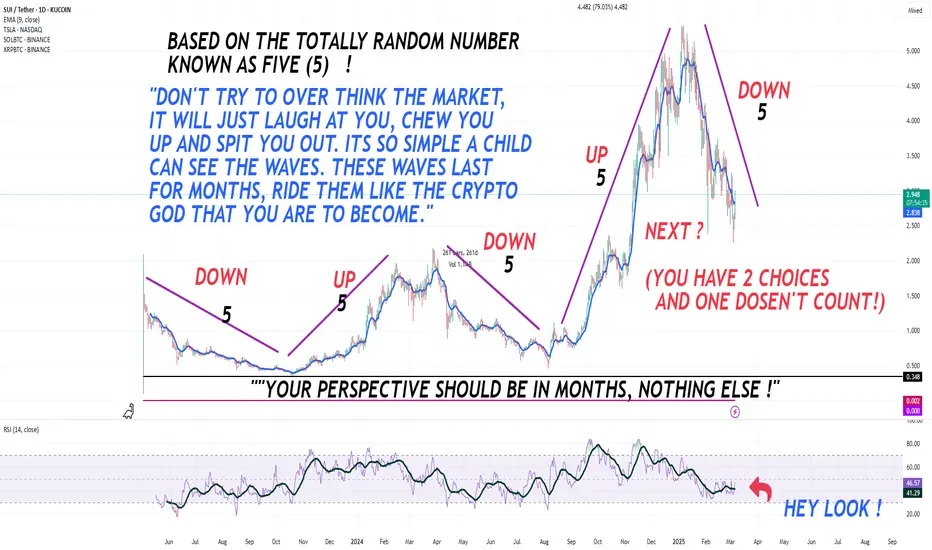
bASED ON THE SCIENTIFICALLY PROVEN NUMBER KNOWN AS FIVE (5) Now, don't blame me if this financial advice works. It is highly scientific and has a record of generating a staggering amount of wealth to the most undeserving of individuals leaving them in a drunken stuppor and awash in a really indecent amount cash. I want no part of this.
You would be far better off getting yourself a nice girlfriend who owns sensible shoes and has an interest in sheep farming rather then leading the crypto life.
See you in 5 months and bring cash.
wmw
President Trump's World Liberty Financial partners with SUIPresident Trump's World Liberty Financial partners with SUI to launch a Strategic SUI Reserve a move that saw SUI surged 13% today with a speculated 100% surge in the short term should CRYPTOCAP:SUI break the $4 resistant zone, a 100% surge is inevitable.
The layer-1 blockchain platform designed to support the needs of global adoption by offering a secure, powerful, and scalable development platform had a great start of the year as it broke out surging to $5 early the start of the year.
Sui Price Live Data
The live Sui price today is $2.96 USD with a 24-hour trading volume of $1,481,325,553 USD. We update our SUI to USD price in real-time. Sui is up 18.74% in the last 24 hours, with a live market cap of $9,373,175,223 USD. It has a circulating supply of 3,169,845,047 SUI coins and a max. supply of 10,000,000,000 SUI coins.

SUI/USDT UPDATE Hello friends
Given the floor that the price has made, we now see the power of buyers in the price reversal, and given the power of buyers, we can make purchases, of course, in stages and with capital management and move with it to the specified goals.
*Trade safely with us*
A 1:5 Trade Setup? SUI’s Chart Looks Interesting
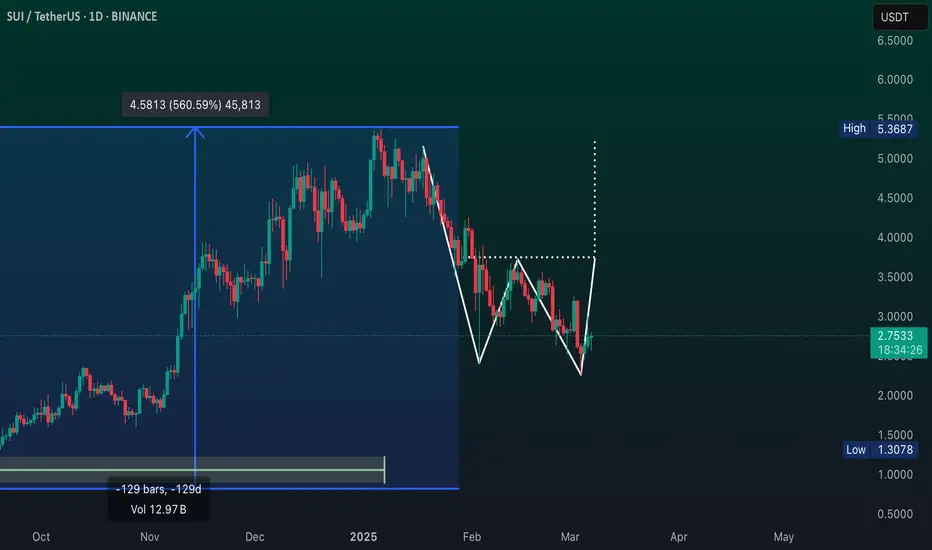
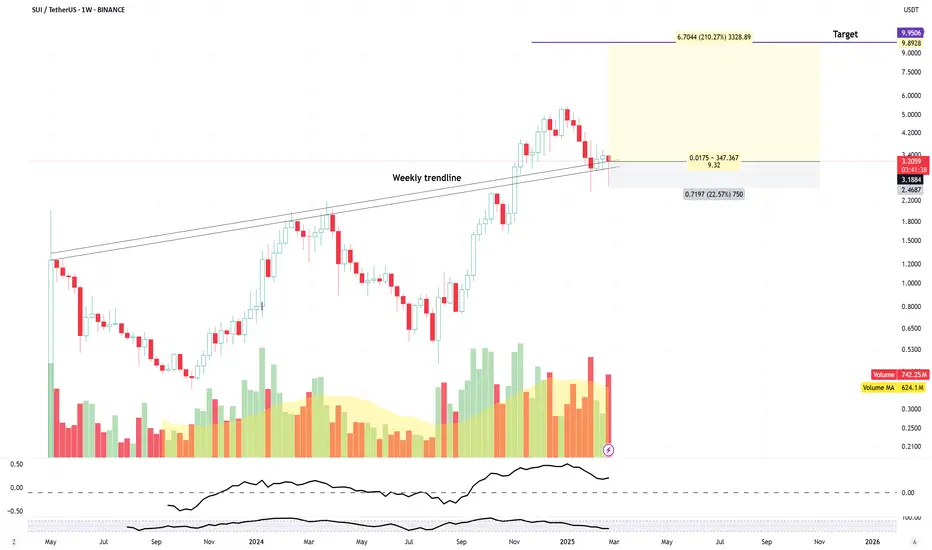
The BINANCE:SUIUSDT COINBASE:SUIUSD chart on the 1W timeframe presents a bullish structure despite the recent 70% retracement. The EMA ribbon remains upward-sloping, indicating that the long-term trend is still intact.
Currently, price is rejecting the $2.3680 support level, making this an area of interest for potential buyers. However, a deeper retracement toward $2.1349 could offer an even better entry opportunity, aligning with key historical price reactions.
A long position from $2.1349, targeting the previous all-time high at $5.3687, presents an attractive risk-to-reward ratio exceeding 1:5, making this a high-probability setup for traders looking to capitalize on a potential recovery.
The key confirmation for upside continuation would be a break of a recent swing high, signaling renewed bullish momentum.
👨🏻💻💭 Will SUI bounce from support and reclaim $5.36, or is there more downside ahead? Share your thoughts and let’s discuss the next move!
__
The information and publications within the 3Commas TradingView account are not meant to be and do not constitute financial, investment, trading, or other types of advice or recommendations supplied or endorsed by 3Commas and any of the parties acting on behalf of 3Commas, including its employees, contractors, ambassadors, etc.

SPOT SUI LONG 5.03.2025Pinning after exhaustion of sales.
💰I enter at the market price.
I'll let you know when I record it manually.
‼️Risk per trade: 1% of the allocated funds for spot trading.
Thank you!
Univers Of Signals | SUI👋 Welcome to Univers Of Signals Channel!
Let's analyze and review one of the most popular coins in the market, sui, and update our previous analysis and find new triggers
🌐 Bitcoin Overview
Before starting today's altcoin analysis, let's look at Bitcoin on the 1-hour timeframe. Since yesterday, Bitcoin experienced a correction, which was necessary for the market, and it pulled back to the 102135 range. The next trigger for a long position will be a breakout above 104714.
Yesterday's correction, coupled with an increase in Bitcoin dominance, caused noticeable declines in some altcoins. This highlights the importance of monitoring BTC pairs in your checklist these days.
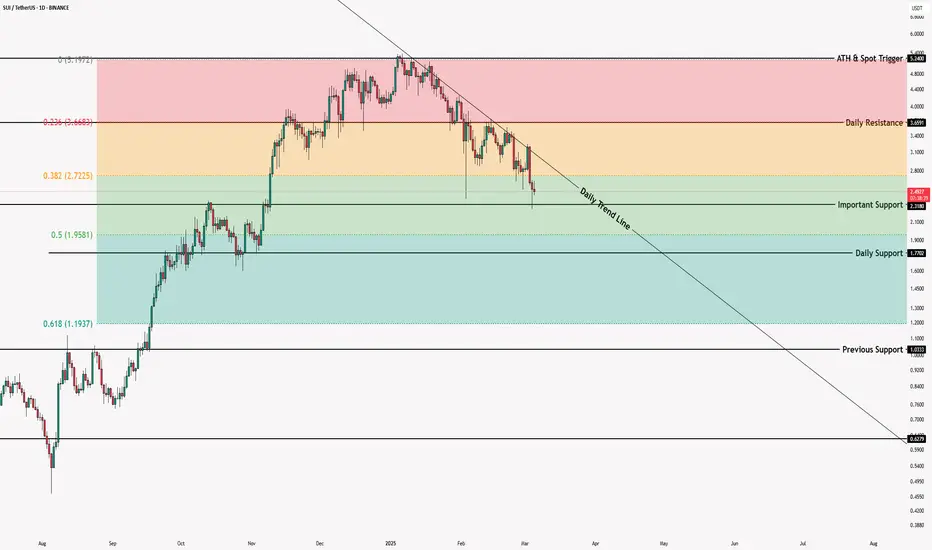
📊 Weekly Timeframe
In the weekly time frame, it is one of the coins that is in good condition, it is really in the market and is still fluctuating on the high support levels.
After hitting 5.24, we made a new ceiling or ATH, and after that, due to recent market news, we experienced some drops, and this has also caused the price correction of this coin.
For re-buying, if we make a good support candle at this level 2.4, it will be a good trigger and the main trend will start again after we break 5.24. Also, after breaking 1.77, we can temporarily exit this coin and cash out!
📈 Daily Timeframe
In the daily time frame, it has been in relatively good conditions compared to other coins in the market and has experienced fewer declines and still has a lot of support to lose!
After breaking the 1.0333 level, which was our trigger spot, we made our purchase and experienced a move after its failure with the entry of momentum and recorded a new ceiling with this event!
Along with this trend, we can draw our Fibonacci levels, which are currently involved in the important level of 0.382, and after it rises and breaks the ceiling of 5.24, we can experience a powerful move!
If this level is broken, we can also hit the support levels of 1.7702 and 1.3859 and we need to form a structure to buy now, but after breaking the trend line and the 3.65 trigger, it can be a good point! For selling, I will continue to hold for now!
📝 Final Thoughts
Stay calm, trade wisely, and let's capture the market's best opportunities!
This analysis reflects our opinions and is not financial advice.
Share your thoughts in the comments, and don’t forget to share this analysis with your friends! ❤️
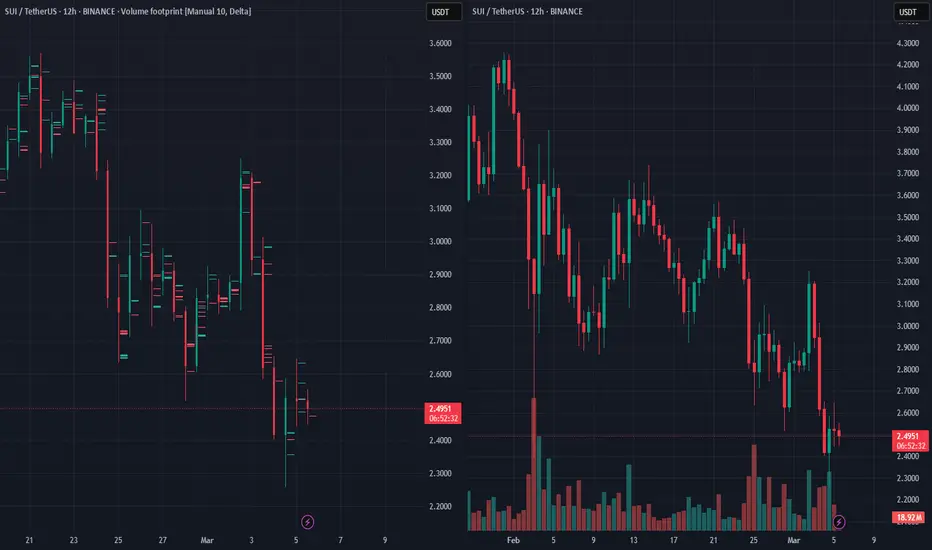
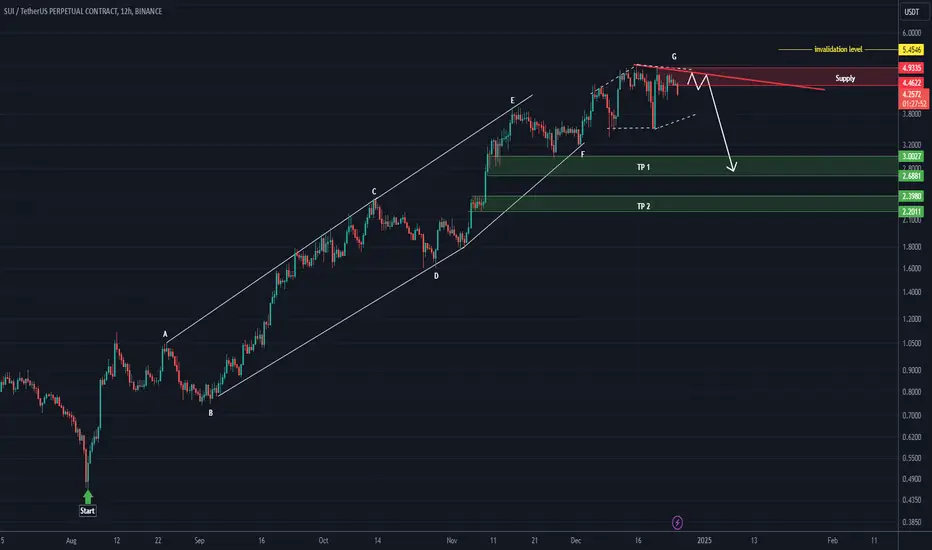
SUI looks Bearish (12H)It seems that SUI is completing a large structure.
A diametric pattern appears to be forming at the end of wave G.
By maintaining the red descending trendline, it could drop toward the two specified TP levels marked on the chart.
Note that TP 1 is a strong support level.
A daily candle closing below the invalidation level will invalidate this analysis.
For risk management, please don't forget stop loss and capital management
When we reach the first target, save some profit and then change the stop to entry
Comment if you have any questions
Thank You
TradeCityPro | SUIUSDT Is the best time to buy ?👋 Welcome to TradeCityPro Channel!
Let's analyze and review one of the most popular coins in the market, sui, and update our previous analysis and find new triggers
🌐 Bitcoin Overview
Before starting today's altcoin analysis, let's look at Bitcoin on the 1-hour timeframe. Since yesterday, Bitcoin experienced a correction, which was necessary for the market, and it pulled back to the 102135 range. The next trigger for a long position will be a breakout above 104714.
Yesterday's correction, coupled with an increase in Bitcoin dominance, caused noticeable declines in some altcoins. This highlights the importance of monitoring BTC pairs in your checklist these days.
📊 Weekly Timeframe
In the weekly time frame, it is one of the coins that is in good condition, it is really in the market and is still fluctuating on the high support levels.
After hitting 5.24, we made a new ceiling or ATH, and after that, due to recent market news, we experienced some drops, and this has also caused the price correction of this coin.
For re-buying, if we make a good support candle at this level 2.4, it will be a good trigger and the main trend will start again after we break 5.24. Also, after breaking 1.77, we can temporarily exit this coin and cash out!
📈 Daily Timeframe
In the daily time frame, it has been in relatively good conditions compared to other coins in the market and has experienced fewer declines and still has a lot of support to lose!
After breaking the 1.0333 level, which was our trigger spot, we made our purchase and experienced a move after its failure with the entry of momentum and recorded a new ceiling with this event!
Along with this trend, we can draw our Fibonacci levels, which are currently involved in the important level of 0.382, and after it rises and breaks the ceiling of 5.24, we can experience a powerful move!
If this level is broken, we can also hit the support levels of 1.7702 and 1.3859 and we need to form a structure to buy now, but after breaking the trend line and the 3.65 trigger, it can be a good point! For selling, I will continue to hold for now!
📝 Final Thoughts
Stay calm, trade wisely, and let's capture the market's best opportunities!
This analysis reflects our opinions and is not financial advice.
Share your thoughts in the comments, and don’t forget to share this analysis with your friends! ❤️

LONG SUIDisclaimer
This is not investing recomendation. This is my public Notebook
It like SOL can be more 50$ in next year
$SUI/USDT Trading IdeaSUI is printing a strong bullish candle, potentially setting up a new demand zone. Would love to see the momentum hold and a clean retest before the next move.
Now there’s a high probability of retesting $5.3610 (70% rally) once again. Send it!

SUI update#SUI i made an analysis last night which i told that this coin can fly due its perfect pattern check this out
i think the bullish trend will continue to the next supply zones
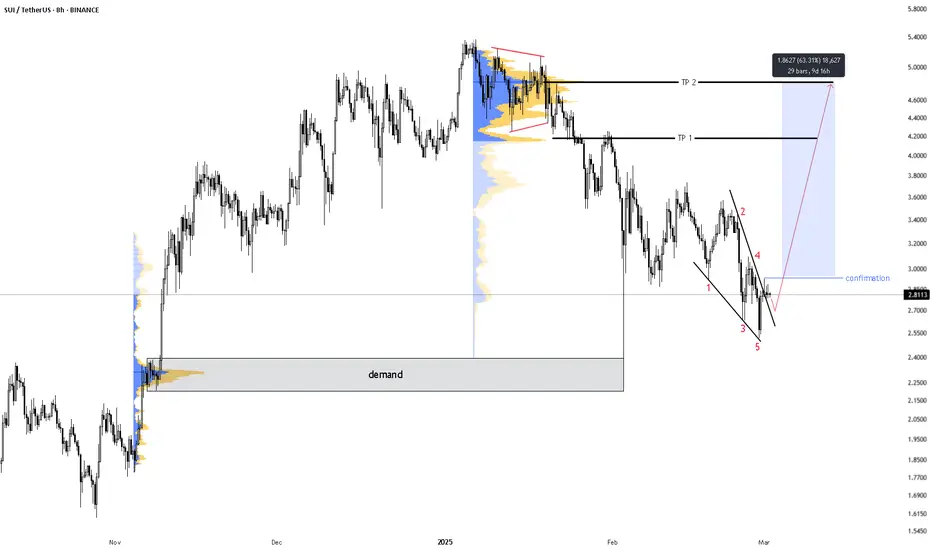
Buy SUISUI had successfully broken the weekly resistance level, and the retest is on-going.
Buy setup is outlined in the chart with take-profit and stop-loss.
Disclaimer:
This analysis is based on my personnal views and is not a financial advice. Risk is under your control.
SUI update#SUI the market made a clear pattern of descending wedge which can make the price jump !
check out our last post for other coins for free signals on crypto currencies !
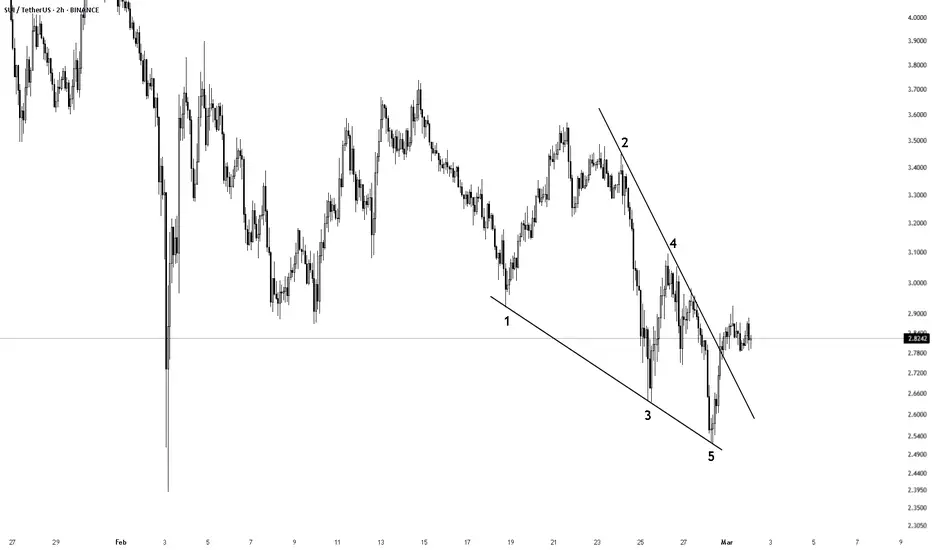
63% PROFIT !#SUI is making a perfect pattern for a big rise just check out how its making a descending wedge as a correction structure i think that if the price crosses the confirmation line there will be nothing to stop the price from touching our targets !
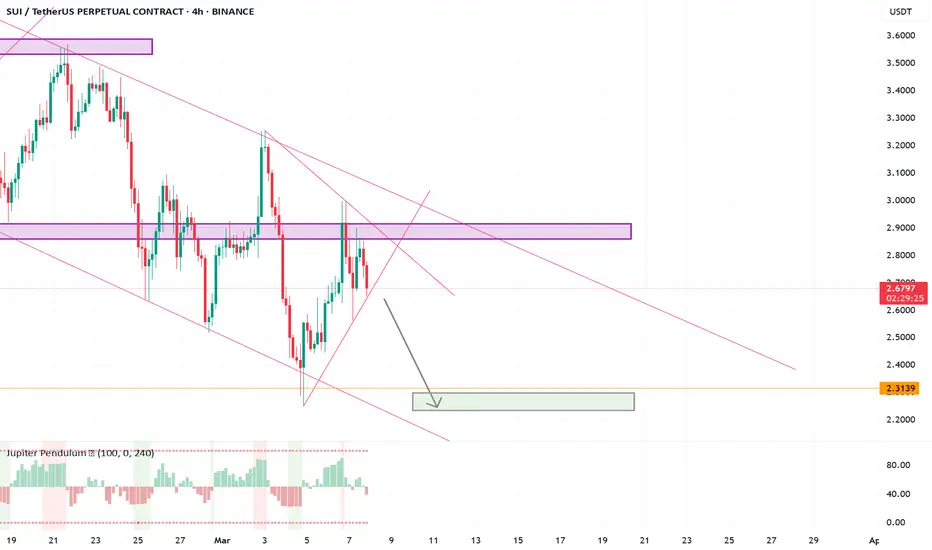
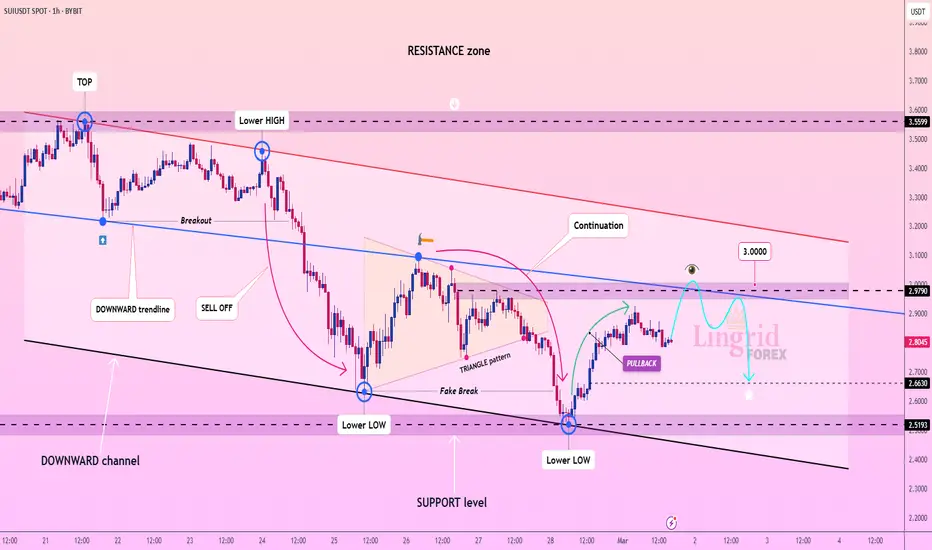
Lingrid | SUIUSDT continues to CONSOLIDATE after SELL OFFBINANCE:SUIUSDT is currently consolidating below the round number of 3.00, and it may continue to move sideways following the recent fake breakout of the support level. The price is still trading within the weekly range, indicating a lack of strong directional momentum. There is a possibility that the price may retest the 2.00 support area, which corresponds to the highs from October, especially since the market has broken below the 3.00 level. Given the sideways movement, I expect the market to retest the recent support level from the psychological level at 3.00 before potentially making further moves downward. My goal is support zone around 2.6630
Traders, if you liked this idea or if you have your own opinion about it, write in the comments. I will be glad 👩💻
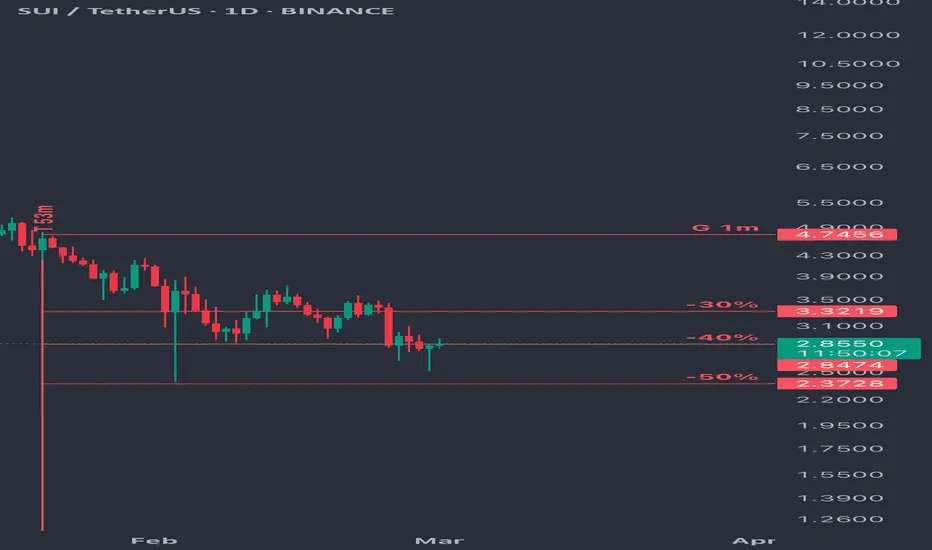
SUIUSDT - Buy Cycle (spot)SUIUSDT
Spot
Buy cycle
Tp@4.7456
% bubble
Sui is in negative bubble and its midterm fair value is 4.7556.
Trading plan:
Entry 1: 3.3219
Entry 2: 2.8474
Entry 3: 2.3728
TP: 4.7456