SUI Breaks Out on Hype Surge — Momentum Cooling After Sharp PumpSUIUSDT 1H chart showing a clean breakout following renewed hype around SUI’s DeFi/NFT expansion. Over the past 48 hours, SUI gained ~15% as social buzz and bullish sentiment picked up — driven by strong ecosystem growth and analysts labeling it “ready for a second wave.”
Price broke above recent consolidation around the $3.95–$4.10 zone and surged to new local highs near $4.40. However, the first test of that high was immediately rejected, with the current candle showing signs of a minor cooldown. Stochastic RSI confirms this — hinting at potential for a short retracement or consolidation before continuation.
Key levels to watch:
$4.10–$4.00 zone (potential retest support)
$4.40 high as breakout resistance
Stoch RSI reset for a second leg
If buyers step in quickly on a retest, this breakout could extend into new territory. If not, we may see a revisit to the $4 zone before any further upside.
SUIUST trade ideas

SUIUSDT – A Setup Worth WatchingThe blue box isn't just a zone, it’s a place where value and timing intersect.
🟦 Context
If price enters this area with control:
It aligns with past volume cluster support
A clean 1H break and confirmation may unlock high R:R potential
Structure + patience = confidence
📌 Execution Plan
🧭 No need to predict.
Just observe:
✅ Does the blue box hold with absorption or slowdown?
✅ Does CDV remain constructive?
✅ Does the 1H chart break and confirm direction?
If yes, there’s asymmetry on your side.
And that’s when smart trades happen.
"It’s not about being early. It’s about being right when it matters."
— And that starts with a prepared eye and a defined plan.
📌I keep my charts clean and simple because I believe clarity leads to better decisions.
📌My approach is built on years of experience and a solid track record. I don’t claim to know it all but I’m confident in my ability to spot high-probability setups.
📌If you would like to learn how to use the heatmap, cumulative volume delta and volume footprint techniques that I use below to determine very accurate demand regions, you can send me a private message. I help anyone who wants it completely free of charge.
🔑I have a long list of my proven technique below:
🎯 ZENUSDT.P: Patience & Profitability | %230 Reaction from the Sniper Entry
🐶 DOGEUSDT.P: Next Move
🎨 RENDERUSDT.P: Opportunity of the Month
💎 ETHUSDT.P: Where to Retrace
🟢 BNBUSDT.P: Potential Surge
📊 BTC Dominance: Reaction Zone
🌊 WAVESUSDT.P: Demand Zone Potential
🟣 UNIUSDT.P: Long-Term Trade
🔵 XRPUSDT.P: Entry Zones
🔗 LINKUSDT.P: Follow The River
📈 BTCUSDT.P: Two Key Demand Zones
🟩 POLUSDT: Bullish Momentum
🌟 PENDLEUSDT.P: Where Opportunity Meets Precision
🔥 BTCUSDT.P: Liquidation of Highly Leveraged Longs
🌊 SOLUSDT.P: SOL's Dip - Your Opportunity
🐸 1000PEPEUSDT.P: Prime Bounce Zone Unlocked
🚀 ETHUSDT.P: Set to Explode - Don't Miss This Game Changer
🤖 IQUSDT: Smart Plan
⚡️ PONDUSDT: A Trade Not Taken Is Better Than a Losing One
💼 STMXUSDT: 2 Buying Areas
🐢 TURBOUSDT: Buy Zones and Buyer Presence
🌍 ICPUSDT.P: Massive Upside Potential | Check the Trade Update For Seeing Results
🟠 IDEXUSDT: Spot Buy Area | %26 Profit if You Trade with MSB
📌 USUALUSDT: Buyers Are Active + %70 Profit in Total
🌟 FORTHUSDT: Sniper Entry +%26 Reaction
🐳 QKCUSDT: Sniper Entry +%57 Reaction
📊 BTC.D: Retest of Key Area Highly Likely
📊 XNOUSDT %80 Reaction with a Simple Blue Box!
📊 BELUSDT Amazing %120 Reaction!
📊 Simple Red Box, Extraordinary Results
📊 TIAUSDT | Still No Buyers—Maintaining a Bearish Outlook
📊 OGNUSDT | One of Today’s Highest Volume Gainers – +32.44%
📊 TRXUSDT - I Do My Thing Again
📊 FLOKIUSDT - +%100 From Blue Box!
📊 SFP/USDT - Perfect Entry %80 Profit!
📊 AAVEUSDT - WE DID IT AGAIN!
I stopped adding to the list because it's kinda tiring to add 5-10 charts in every move but you can check my profile and see that it goes on..
SUI 99 RR COULD IT BE???SUI 99 RR COULD IT BE??? - massive multiplier. Relative strength. Big time frame HVF. SUI Could be ready to pop.


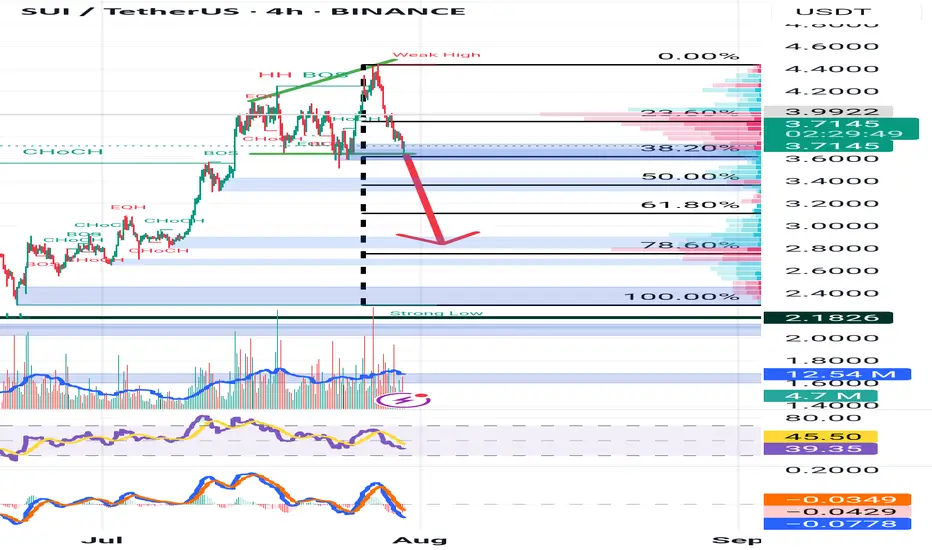
I went Short here's why...First of all, I know that this is a risky position to be in, but I decided short anyway.
It is easy to locate past final highs; so, we safely can say that the point of analysis is to find highs in the future.
I might be wrong, but for the period of this week, and maybe the week after, I've decided to go short. But I don't know about after next week.
Shift your Stop-loss according to movements.
Don't put a Take-profit until you're concrete and, don't look back.
Stay responsible and, stay relaxed. 👍🏻

Tension Builds on SUI Chart — Eyes on $3.85CRYPTOCAP:SUI is moving inside a symmetrical triangle pattern.
The price is getting tighter, forming higher lows and lower highs.
This usually means a breakout is coming soon.
If it breaks above the triangle with strong volume, SUI could jump to the $4.60–$4.70 range.
For now, it’s a wait-and-watch setup.
Key support is just below $3.85, staying above that keeps the bullish trend alive.
#Altseason2025

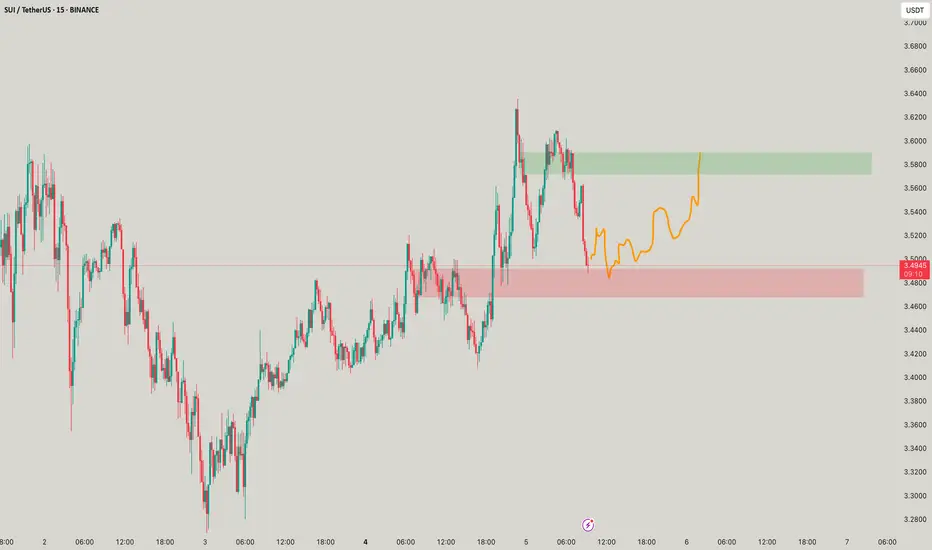
Sui long to $4.2953Just recently opened a long on sui
Stop: $3.9346
Tps on chart
Time sensitive
DTT strategy applied

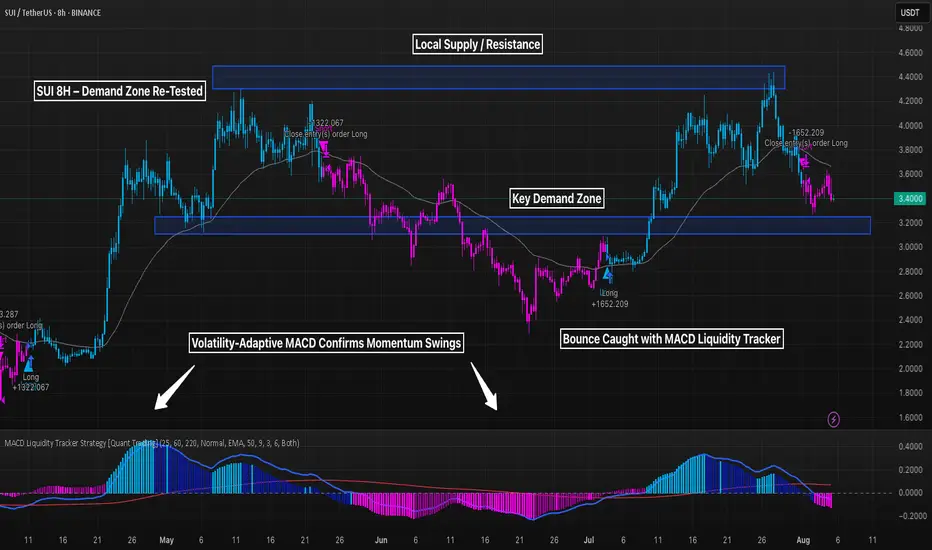
SUI 8H – Demand Zone Re-Tested, Will Strategy Fire Again Soon?SUI is approaching a major demand zone after rejecting from local highs near $4.60 — and the MACD Liquidity Tracker Strategy just closed its most recent long position. With momentum fading and price nearing structure, the next signal could be pivotal.
🔹 Strategy Settings
MACD: 25 / 60 / 220
System Type: Normal
MA Filter: EMA 50, VIDYA smoothing (9)
This configuration has historically excelled on volatile pairs like SUI — catching high-RR reversals from demand zones.
🔹 Price Structure
Key support sits between $3.10–$3.30 — a previous breakout base.
If price retests this zone and MACD curls, we may get another high-conviction entry.
Resistance remains at $4.50+, where the last major exit was triggered.
🔹 Momentum Check
MACD histogram flipped bearish, but flattening — suggesting weakening downside.
Strategy will likely stay flat until a new trend forms, giving traders time to prep.
Will the bot strike again at support — or is SUI setting up for something deeper?
Let’s analyze 👇
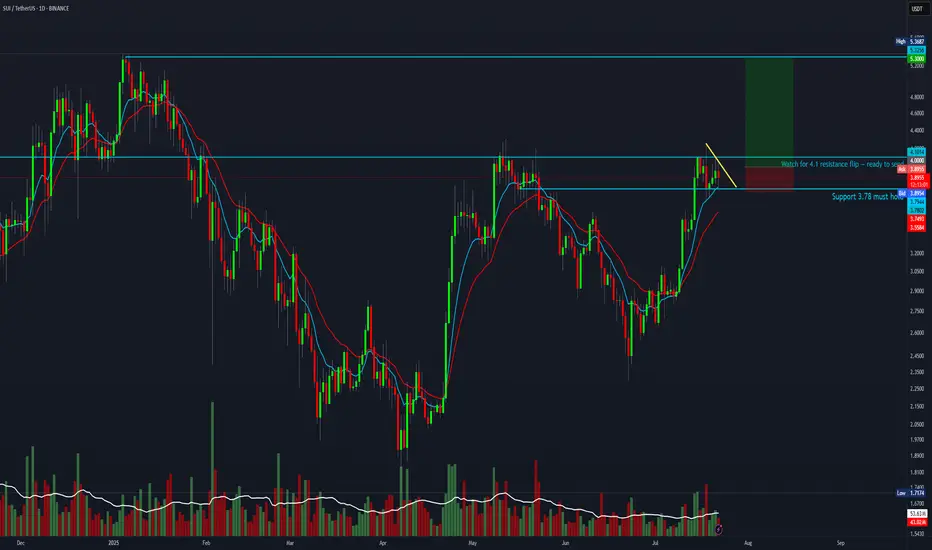
SUI - Retest in ProgressPlease refer to our previous post:
What we stated in this post from over three weeks ago was "If we get a retest and hold of that yellow trendline that will be the confirmation we need for a full blown breakout for SUI."
Current day we just got that retest! As you can see (green circle) both daily candles held the body above the yellow line giving us our first confirmation of a successful retest. If this retest remains successful we should see a continued move to around $5.50.
However due to BTC's current state we cant rule out the bearish scenario. If BTC starts to close below $112k then most likely SUI will fall below our triangle pattern. If SUI falls below and starts closing below the yellow line that would signal a false break. At the moment this is the less likely scenario given the market structure built, but something to watch closely.

Back-to-Back Calls MACD Liquidity Strat-> Bear to Bull on SUIWhen the market flips, most traders get stuck holding bags.
Not here.
The MACD Liquidity Tracker Strategy flipped short near the top and long near the bottom — catching a clean -37.28% drop followed by a +52.07% rally on SUI 8H.
Here’s how it works:
– EMA filter confirms direction
– MACD histogram + crossover signals timing
– Strategy waits for true momentum before flipping
You don’t need to predict the bottom. You need a tool that reacts fast enough to capture moves, but slow enough to ignore noise.
⚙️ Settings Used:
– MACD: 25 / 60 / 220
– EMA Filter: 50 / 9 / 3
– Entry Mode: Both (Histogram + Crossover)
This is what smart automation looks like: fewer trades, more clarity, and real trend capture.

sui/usdt 4h analysis run for 10-15 days soon it will touch golden zone but point of invalidation will be updated soon after btc closing and others.d vs btc.d thats how i analyse but DYOR b4 jump and manage your trades accordingliy its financial ocean

Sui chance for +60% on this zoneSui continue to grap liquidation but on the monthly and weekly timeframe we are still bullish.
I just saw good zone for trade. At 3.15 we have daily EMA + fibonacci 0.64 + Daily FVG.
I will suggest to add some leverage because invalidation is close to 2.9.
In this mid term bull market of altcoins we can see that SUI has good performance.
Ivan

Break down to major support levelHere we have an expanding bearish wedge forming beautifully. My target is based off the 5 minute chart and a bullish order block.
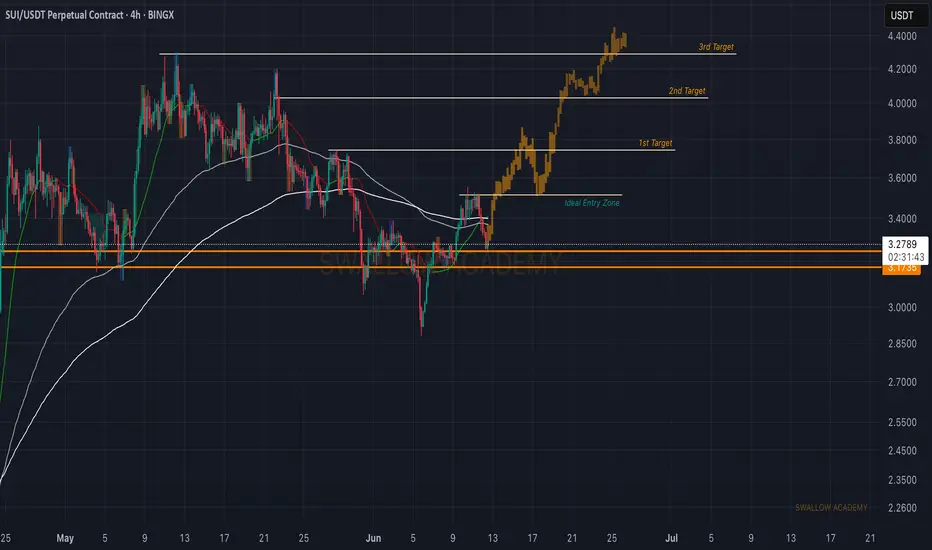
Sui (SUI): Targeting $4.20 | Bullish ScenarioWe are seeing the possibility for upward movement here, which could result in +20% of market price movement from our entry.
As of now it is too early yet to talk about any bullish movement here so we are waiting patiently for a proper breakout from our entry area, which would then give us a proper chance for bullish movement from there.
Swallow Academy
Long SUISUI had broken the 1D resistance of a Cup & Handle pattern.
Long setup is as in chart.
Disclaimer:
This analysis is based on my personnal views and is not a financial advice. Risk is under your control.

SUI 5R setup forming.SUI looks ready to move. Wait for a breakout above $4 — once it flips the $4.10 resistance, it could fully send toward ATH.
Entry: $4
Stop Loss: $3.70
Target: $5.30
Technical Analysis – SUI/USDT long position (4H Timeframe)
🚀 Technical Analysis – SUI/USDT (4H Timeframe)
🗓 Date: July 22, 2025
📌 Suggested Entry:
$4.12
🎯 First Target:
$5.10 – Risk to reward ratio ≈ 1:2 ✅
🛑 Stop-Loss:
$3.60
---
🔍 Entry Conditions:
✅ If there is strong volume and momentum:
Enter on breakout of the $4.12 level in the 1-hour timeframe
🟡 If the move is slow and volume is low:
Only enter after a candle closes and holds above $4.12, preferably in the 4-hour timeframe
---
📊 Macro Structure Analysis:
🟦 SUI/BTC:
Still in an uptrend with higher highs and higher lows ⬆️
But early signs of trend weakness are showing ⚠️
📈 BTC Dominance (BTC.D):
❗ If 61.31 breaks → stop-loss might be triggered
✅ If 60.42 breaks → supports holding the long position
🌐 TOTAL2 (Altcoin Market Cap):
If it breaks above 1.55 → confirms long entry ✅
💵 USDT Dominance (USDT.D):
Currently in a key zone between 4.26 – 4.14
If a red candle breaks 4.14 🔻 → strong bullish sign for altcoins and a good setup for a long on SUI 💥
---
🎯 Final Strategy and Personal Plan:
I will only enter the trade if all of the following are true:
1. Macro indicators are in favor of altcoins ✅
2. Strong volume and momentum come into the market 🔥
3. Breakout of $4.12 happens with strong and sharp candles 🚀
If the move is slow or macro signals are weak ❌,
I will cancel the trade and ignore the setup.
---
📵 Invalidation:
If SUI can’t break above $4.12, even when macro indicators are bullish, and the market lacks momentum.
---
📣 If this style of analysis helped you, don’t forget to follow ❤️
Leave a comment and share your thoughts 💬
And if you found it useful, hit that rocket so we can fly 🚀

TradeCityPro | SUI Eyes Breakout with Bullish Momentum Rising👋 Welcome to TradeCity Pro!
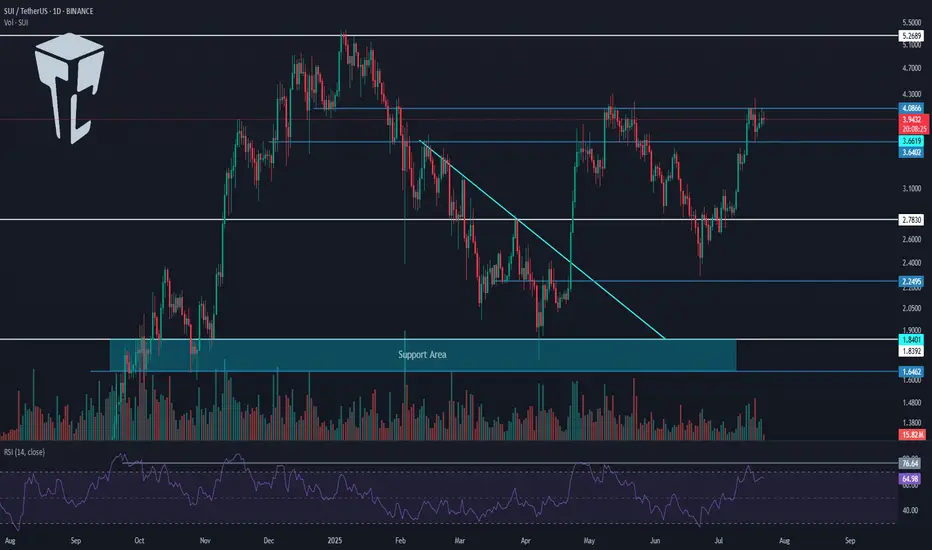
In this analysis, I want to review the SUI coin for you. It’s one of the Layer1 projects in the crypto space, currently ranked 13 on CoinMarketCap with a market cap of $13.66 billion.
📅 Daily Timeframe
On the daily timeframe, a lot has changed for SUI since the previous analysis. After breaking the descending trendline, it has started a new bullish trend.
✔️ In the first bullish leg after breaking the trendline, the price reached the 4.0866 zone, and now after a correction, it’s moving upward again.
📈 The 4.0866 level is a very important resistance. In fact, we can draw a resistance range between 3.6402 and 4.0866, as the price tends to behave erratically within this zone.
⭐ Currently, the price has re-entered this range and if 4.0866 is broken, the bullish wave could continue. The first target for this wave could be 5.2689.
🔼 So, if 4.0866 is broken, I highly recommend opening a long position, because if the price truly breaks this level (and it’s not a fake breakout), then the minimum target would be 5.2689.
📊 If the buying volume continues to increase as it is now, and the RSI breaks above 76.64, the chances of breaking 5.2689 will also rise, and the price may even set a new ATH.
👀 I already have an open position on this coin based on lower timeframe triggers, and I’m currently waiting to see the reaction to 4.0866. Based on my entry, if the price moves toward 5.2689, the risk-to-reward ratio will be very high. That’s why I’ve kept part of my position open to potentially capture that move.
🛒 For spot buying, we can also use a futures strategy — meaning if 4.0866 breaks, we open a futures position targeting 5.2689, and then use the profit from that position to buy SUI in spot, gradually building our spot portfolio.
✨ If you are looking at this coin only for spot, the main trigger is the breakout of 5.2689. But be careful — if the price moves aggressively, it might not give you a proper entry trigger, and entering from that area might be difficult.
📝 Final Thoughts
This analysis reflects our opinions and is not financial advice.
Share your thoughts in the comments, and don’t forget to share this analysis with your friends! ❤️
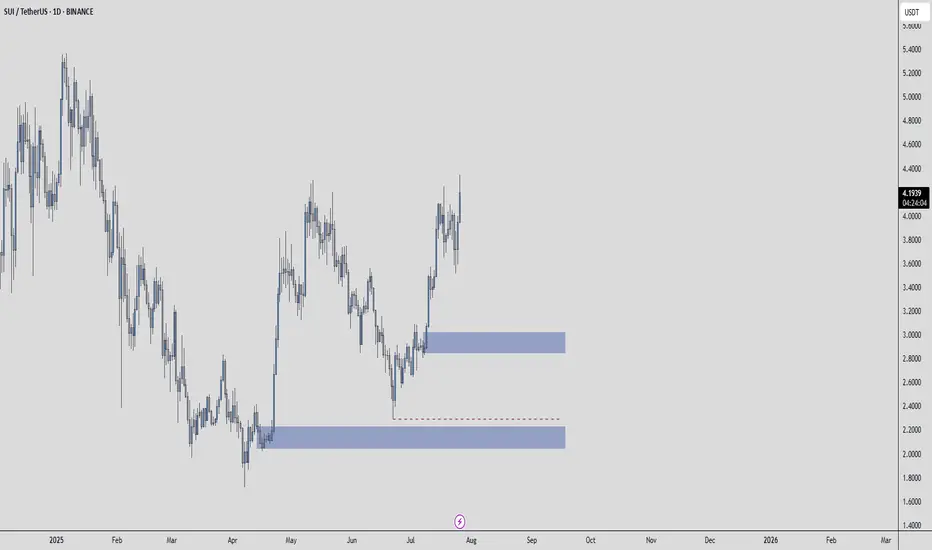
SUI/USDtSUI is looking bullish from here! We might see some consolidation still before we move higher. Great coin to hold for the next 4-6 months!

2.5-4RRI believe this can fill in the next day or 2, RR depends on the lvl taken, Sui is currently in a very bullish move so it makes sense to take the higher red lvl for lower RR IMHO.

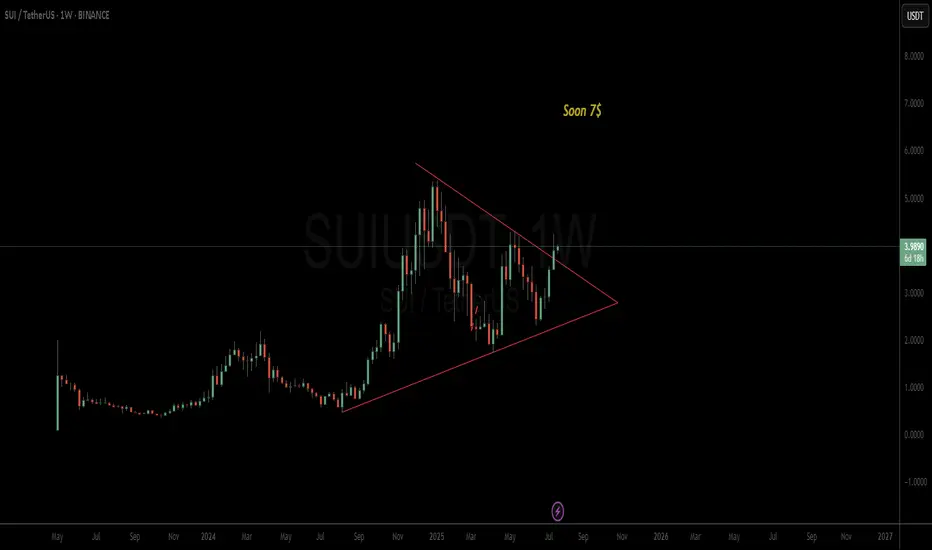
SUI potentail to 7$The chart is clear, folks
The triangle broke, and SUI has the potential to rise to 7$
Good luck
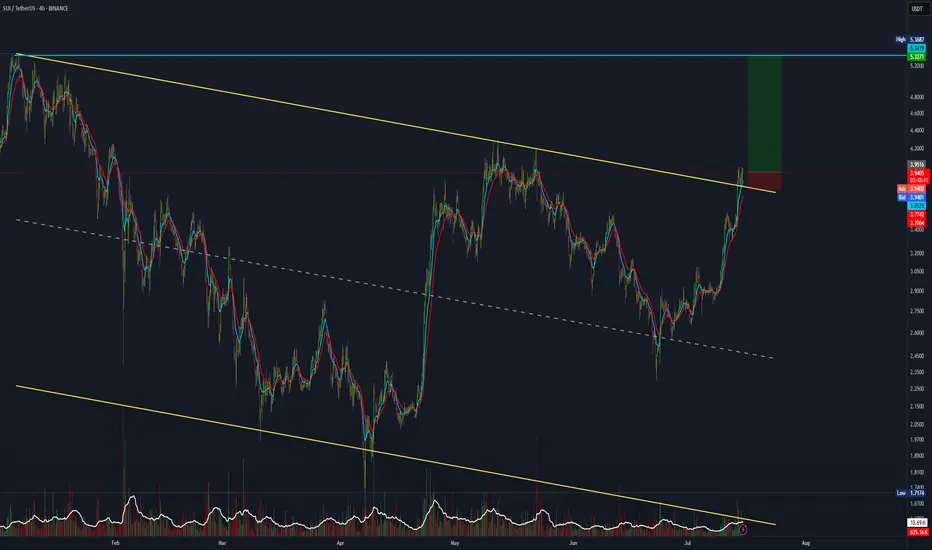
SUI trade setup with a 7:1 risk-to-reward ratio.SUI has broken out and retested the major channel. If you're bullish, this 7:1 R:R setup is worth considering.
Entry: 3.94
Stop Loss: 3.77
Target: 5.30.