Mid-Chop Exit vs Trend Hold — How One Setting Changed EverythingSUI’s trend looked solid — but the strategy didn’t hold.
Using the MACD Liquidity Tracker Strategy with default settings (Signal MA = 220), the system caught the initial move well, but then exited during consolidation. It missed the continuation and had to re-enter late — resulting in more trades and reduced edge.
After running a few backtests, we increased the Signal MA to 550 to reduce early exits. The result:
Strategy held through the mid-trend chop
PNL more than doubled
Drawdown increased slightly, but the trade stayed intact
This is a perfect case study on how signal sensitivity affects trend behavior. Faster MAs respond quicker but tend to exit on noise. Slower MAs smooth it out — at the cost of larger swings.
Both versions are valid — but backtesting revealed which better fit this market structure.
No settings are one-size-fits-all — the key is understanding how each tweak behaves.
—
#SUIUSD #CryptoTrading #Backtesting #MACDStrategy #StrategyTweaks #LiquidityTracker #TradingEdge #QuantTradingPro #TradingView #TechnicalAnalysis
SUIUST trade ideas

fthjgyfghjSUI is currently trading near the resistance line. Price was reject around this resistance line in the previous pump.
- Given the current bullish market, price is expected to breakout from this resistance easily
Entry Price: 4.04
StopLoss: 3.2
TP1: 4.5059
TP2: 5.3810
TP3: 6.5106
TP4: 7.8772
TP5: 10+
Don't forget to set stoploss.
Stay tuned for more updates

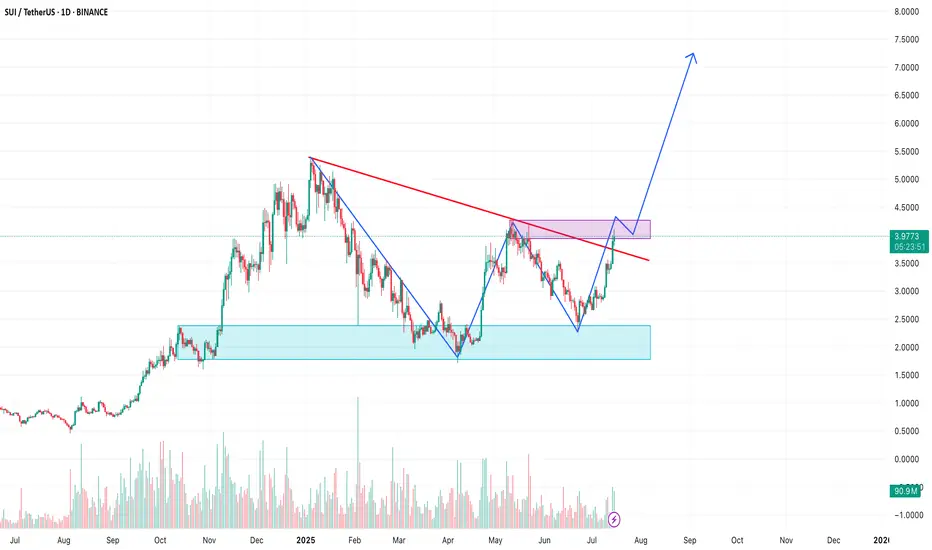
SUI - Breakout of the yearSUI is currently trading near the resistance line. Price was reject around this resistance line in the previous pump.
- Given the current bullish market, price is expected to breakout from this resistance easily
Entry Price: 4.04
StopLoss: 3.2
TP1: 4.5059
TP2: 5.3810
TP3: 6.5106
TP4: 7.8772
TP5: 10+
Don't forget to set stoploss.
Stay tuned for more updates

SUI/USDT - Testing the Top of ValueSUI is back in focus as price pushes into a critical zone of resistance that has capped previous rallies. With key moving averages reclaimed and volume shifting in favour of bulls, the question now is simple - can it break free, or is this another trap before rotation lower?
Let’s break down the current structure and what comes next!
SUI is trading at a critical inflection point after staging a strong recovery off the March and April lows . The broader context shows a market transitioning from a bearish phase into a more constructive accumulation structure. The recent price action has been guided largely by reclaiming key areas of previous acceptance and value.
However, sellers are still active at the upper bounds of this range. The next few sessions will determine whether SUI transitions into full breakout mode or requires further consolidation below resistance.
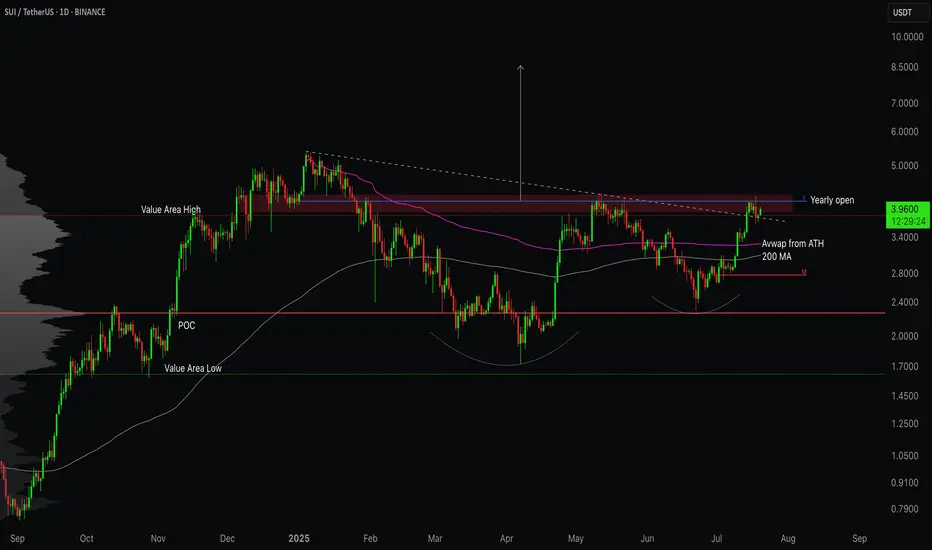
⦿ Volume Profile
The Value Area Low (VAL) is anchored around $1.62 . This area marked the exhaustion point for sellers, triggering the current recovery leg.
The Point of Control (POC), which represents the highest traded volume zone, sits at approximately $2.27 . This zone acted as a magnet for price through May and June and is now firmly reclaimed, reinforcing its importance as a structural support.
The Value Area High (VAH) comes in at $3.82 . Price has recently reclaimed this level, which suggests buyers have shifted control of the auction. Acceptance above the VAH often implies that the previous range is no longer valid and a new range expansion could be underway.
⦿ Key Technical Insights
Several technical levels align with this recovery. The 200-day MA and the anchored VWAP from the all-time high converge between $3.00 and $3.50. This area has been successfully reclaimed and held, adding further conviction to the bullish case.
Above current prices, $4.12 represents the Yearly Open and a clear horizontal supply level. The market has shown hesitation here, as expected. The price action suggests sellers are attempting to defend this zone, but the overall structure remains bullish as long as higher lows are maintained.
Support levels to monitor include $3.82, the Value Area High, and $3.50, where both the VWAP and the 200-day Moving Average provide dynamic support. Below that, the POC at $2.27 remains a crucial level of last defense for bulls.
⦿ Market Structure
Structurally, the market has transitioned from a downtrend into a rounded bottom formation, which typically precedes more sustained uptrends. The higher low structure since the March lows confirms this shift. The recent push above both the POC and VAH further validates the strength of this reversal.
Volume has supported this breakout. We saw clear expansion through the $3.00 handle, suggesting conviction among buyers. The visible consolidation just below $4.12 reflects natural supply pressure but not yet evidence of distribution.
⦿ Scenarios to Consider
1. Bullish Scenario:
If buyers manage to establish acceptance above $4.12, particularly with daily closes through this level, the path higher opens cleanly. The low-volume node between $4.12 and approximately $5.00 suggests limited resistance in this zone. Price could expand swiftly toward $5.36 to $6.00 as a first target.
2. Healthy Pullback Scenario:
Should price reject the $4.12 zone, a pullback toward $3.82 or even $3.50 would be healthy and expected. As long as the structure of higher lows remains intact and price holds above the reclaimed POC at $2.27, this pullback would likely serve as a base for the next leg higher.
3. Bearish Breakdown Scenario:
A sustained loss of $3.00 would be the first real warning sign for bulls. Breaking below the POC at $2.27 would suggest a failed breakout and could see the price cycle back toward the lower end of the volume profile, targeting $2.26 or even the Value Area Low at $1.62. However, given current strength, this scenario looks less likely unless broader market sentiment shifts.
I’m primarily focused on bullish scenarios or potential pullbacks, as the current market looks stronger compared to a few months ago. I believe we’re likely to see some decent long opportunities moving forward.
Let me know your thoughts in the comments! 👇
⚠️ Disclaimer
As always, this post is purely for educational purposes. I am not a financial advisor, and nothing here should be taken as financial advice. Always consult your financial advisor before making any investment or trading decisions. Or at the very least, consult your cat. 🐱
SUI - Upside continuation - with a great R/R of 26SUI has had upside buying pressure since its inception around Jun 23. I have been looking for a chance to get in and this symmetrical triangle shows it is likely to give upside continuation with a great R/R of 26.
Entry - 3.5818
SL - 3.3094
Interval 1 - 3.79
Interval 2 - 6.45
Target - 10.755

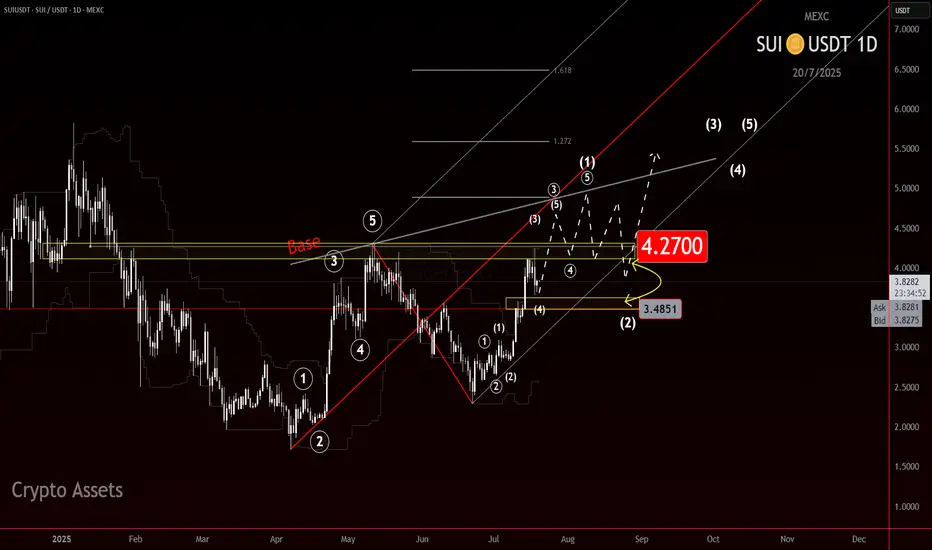
SUI: Calm Before the Wave 3 Surge?CRYPTOCAP:SUI is shaping up to be one of those charts that makes you lean in a little closer.
Right now, it appears to be sitting inside a potential wave 3, but something feels off. It hasn’t exploded yet. And when you’re looking for wave 3 behavior, that’s what you want: speed, commitment, follow-through. A clean surge, ideally in a straight line, that clears doubts and leaves the doubters behind.
We’re not seeing that yet. Right now the move is decipherable at many nested degrees making this move feel cautious.
And that opens the door to some possibilities:
It is a wave 3, just one that hasn’t lit the match yet.
We’re still nesting, multiple wave 1s and 2s stacking before the actual move hits.
Or it's a wave C of a Zig Zag.
As for levels, $4.20 stands out. Whether this turns into a rocket or a reset likely hinges on how price reacts there.
Stay nimble. If this is a true wave 3, it’ll leave no time for hesitation.
Be early, but not reckless.
SUI/USDT Perpetual (BITGET)📊 Chart Overview
Pair: SUI/USDT Perpetual (BITGET)
Timeframe: 4H
Current Price: $3.8063
Key Zones:
Demand Zone: $3.35 – $3.54 (highlighted purple box)
Resistance/TP Zone: ~$4.01
🧠 Technical Breakdown
✅ Structure & Pattern
Price has broken down from recent highs after a sharp impulse.
Now heading into a clear demand zone, with a potential double bottom or liquidity sweep pattern forming inside that zone.
The black arrows suggest a W-shaped recovery, meaning price may:
Dip into the purple demand zone
Bounce slightly
Retest the bottom again (possibly sweep liquidity)
Strong bullish reversal toward $4+
🔍 Reasoning
Demand Zone: Previously respected as a consolidation + breakout base.
Liquidity Grab Possibility: Dips below recent minor support could trap shorts.
Volume Drop + Wicky Action: Shows potential exhaustion in selling pressure.
Reversal Plan: Smart money may reload here before next bullish impulse.
⚠️ Invalidation
Clean break and 4H candle close below $3.34 = setup invalid.
Could lead to further downside into the next lower support area (~$3.00).
"Not Financial Advice"

SUIUSDTSUI has broken out above a long-term descending trendline and reclaimed the key Monthly(2) resistance at $3.71, now acting as support. After a successful retest of this level, I’m entering a long position targeting a move toward $5.00, aligning with prior highs and the next major resistance zone. The breakout is supported by strong bullish momentum, VWAP trend shift, and confluence from Fair Value Gap absorption. My stop is placed below $3.60 to protect against a failed retest, with a favorable risk-reward setup in play.

Possible SellSUI is looking to reprice lower. A buy into the 1hr fvg would most likely see price go lower.

SUI Approaches Key Level Again…SUI has recovered sharply from range lows and is now staring down the same resistance that slapped it twice before. If momentum carries it through this time, there’s very little above. If not, this could be the last squeeze before a reset. Classic inflection point setup.

#SUI Update #1 – July 18, 2025#SUI Update #1 – July 18, 2025
While many major altcoins showed strong upward momentum yesterday, Sui failed to generate a significant volume-driven breakout. One of the primary reasons was the presence of heavy whale sell orders in the $4.20–$4.25 zone. As shown on the chart, price left a wick at the top and pulled back slightly.
Technically, Sui has not yet completed a proper correction following its recent impulsive move. If a correction does occur, the first support level lies around $3.61 — approximately a 10% drop from current levels. This would be a healthy pullback, not a cause for panic.
If you use a stop-loss, honor it. If not, make sure you have sufficient capital to average down in case of a deeper retracement.
If another impulsive leg is to come, $4.25 will again be a critical resistance area, still stacked with whale orders.


SUI Just Broke Its Downtrend — But Can It Hold?SUI just cleared a major downtrend that’s capped every rally for the last 5 months.
Now it’s back to retest the breakout zone — right at former supply and the trendline intersection.
This is the kind of setup that either launches a new trend or gets slapped back into the range.
Keep it on watch.
#SUI #SUIUSDT #CryptoBreakout #TrendlineTest #ChartAnalysis #BacktestEverything #TradingView #QuantTradingPro #CryptoTraders

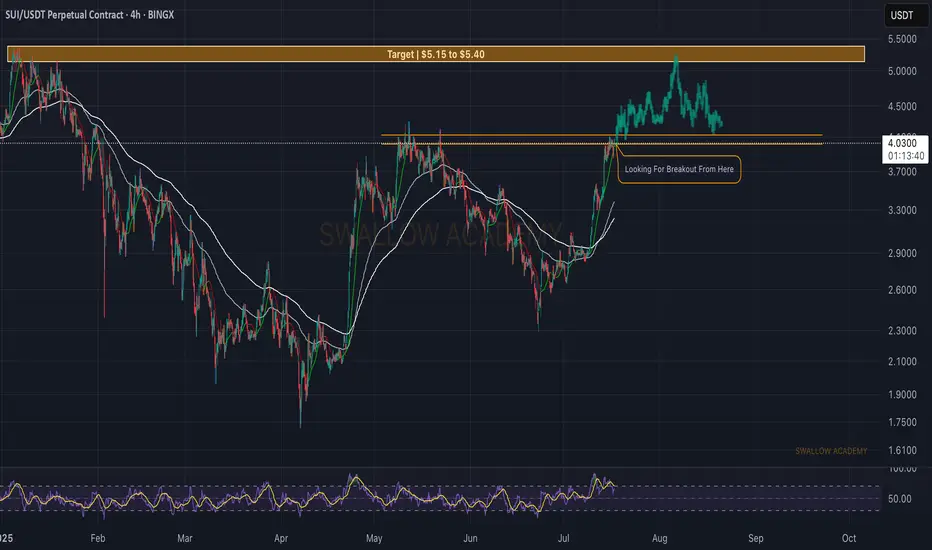
Sui (SUI): Looking For BOS (Break of Structure) Sui coin looks strong, where we are about to get a proper BOS (Break of Structure), which then would give us an ideal opportunity for a long position up until $5.40, where our target is sitting currently.
Once there we expect to see some sort of correction or sideways movement, before next wave of upward movement.
Swallow Academy
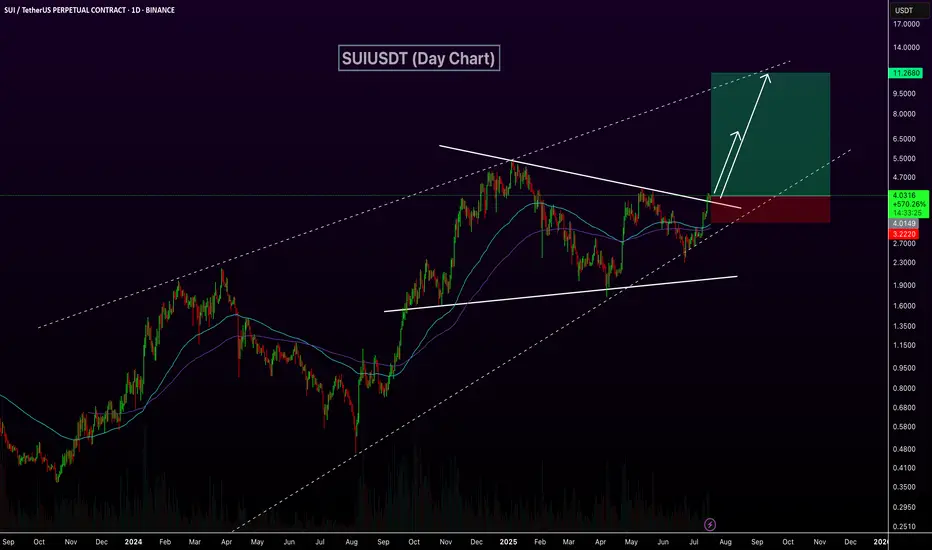
SUIUSDT Breaks Out of Triangle – Eyes on $10BINANCE:SUIUSDT daily chart has confirmed a breakout above a symmetric triangle resistance line within a larger ascending channel, signaling strong bullish momentum. Price has reclaimed the 100 and 200 EMAs, and the breakout is backed by rising volume. This setup opens the door for a potential rally toward the $10.00 level, with price currently holding above key structure support around $4.00. As long as this level holds, continuation toward the upper trendline remains likely. CRYPTOCAP:SUI
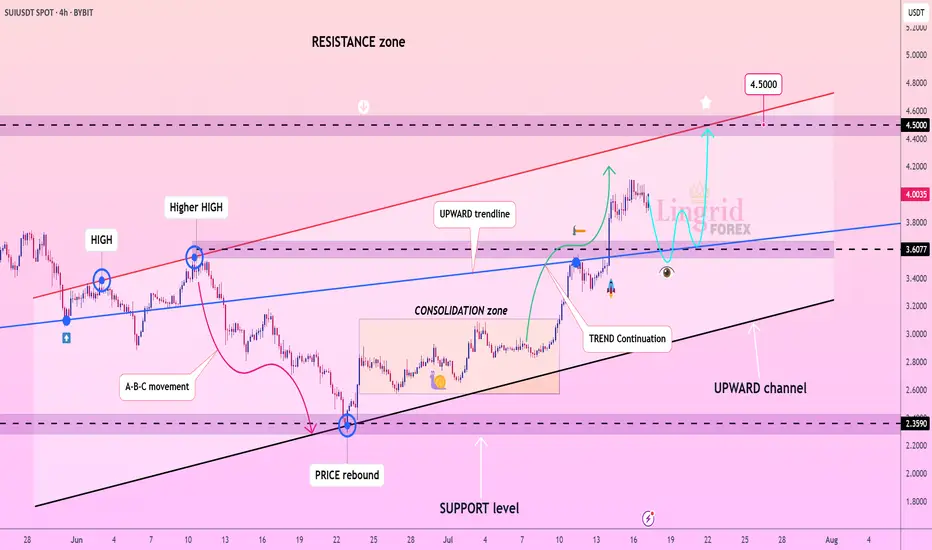
Lingrid | SUIUSDT Pullback and New Higher High PotentialBINANCE:SUIUSDT has rebounded strongly from the support level at $3.60, continuing its bullish sequence of higher highs and higher lows. The price broke out of the consolidation zone and climbed above the blue upward trendline, confirming a continuation of the bullish trend. A retest of the breakout area is likely before a push toward the major resistance zone at $4.50. The structure remains bullish as long as the channel support holds.
📉 Key Levels
Buy trigger: Bounce from $3.60 zone
Buy zone: $3.55–$3.70 (retest range)
Target: $4.50 (red resistance line)
Invalidation: Close below $3.45 trendline support
💡 Risks
Breakdown of the black channel line
Volume divergence or failure to hold the $3.60 support
Broader market weakness across altcoins
If this idea resonates with you or you have your own opinion, traders, hit the comments. I’m excited to read your thoughts!
SUI SELL SETUP , Sold From $3.95SUI SELL SETUP
Currently $3.95
Sold From $3.95
(Trading plan If SUI go up to $4.10
will add more shorts)
Expecting target $3.85 OR DOWN
In the event of an early exit,
this analysis will be updated.
Its not a Financial advice


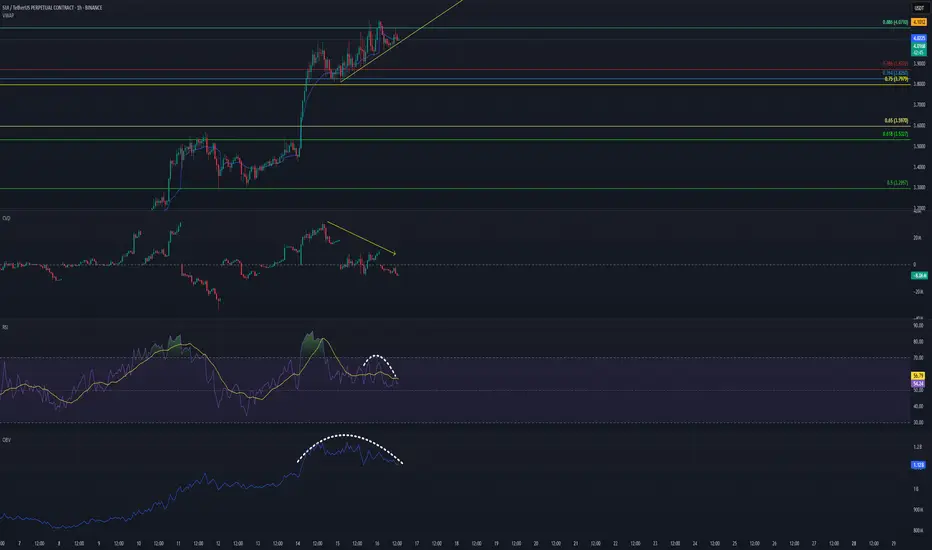
SUI‑USDT – Exhaustion or Extension?1. Why this zone matters
Price has reached the 0.886 Fib retrace of the May -> Jun swing.
Momentum is fading: 1‑hour RSI peaked lower (60 vs. 69 on the prior swing).
OBV and hourly volume both rolling over
2. Order‑flow snapshot (since 14 Jul 00:00 UTC)
Spot CVD → up Retail/FIAT buyers still lifting offers.
Perp CVD → down Aggressive shorts absorbing that demand.
Aggregated OI → up, now stalling Fresh longs trapped; beginning to unwind.
Interpretation: spot bids are being offset by short perps, and the build‑up in leverage is leaking—classic exhaustion.
3. Historical stats to know
The combo Spot CVD ↑ + Perp CVD ↓ + OI roll‑over + RSI bear‑div has produced a ≥ 1 % downside move within 30 minutes about 65 % of the time on tier‑1 alts (Jan 2023 – Apr 2025 sample).
4. Checklist before I short
M5 structure break (lower‑high plus close below the last M5 swing low).
Need a 1H candle CLOSE below the yellow ascending trendline!
Perp CVD flips ≤ 0 and OI prints two consecutive down‑ticks.
TPO sell tail with at least 3 single prints right at the high.
If all three fire → short is live. Otherwise, stand aside.
Bottom line
Momentum is fading; spot buying is being soaked up by stealth perp shorts, and leverage is already leaking out. Wait for the checklist—then look for a mean‑reversion move lower.
And remember: Reaction beats prediction.
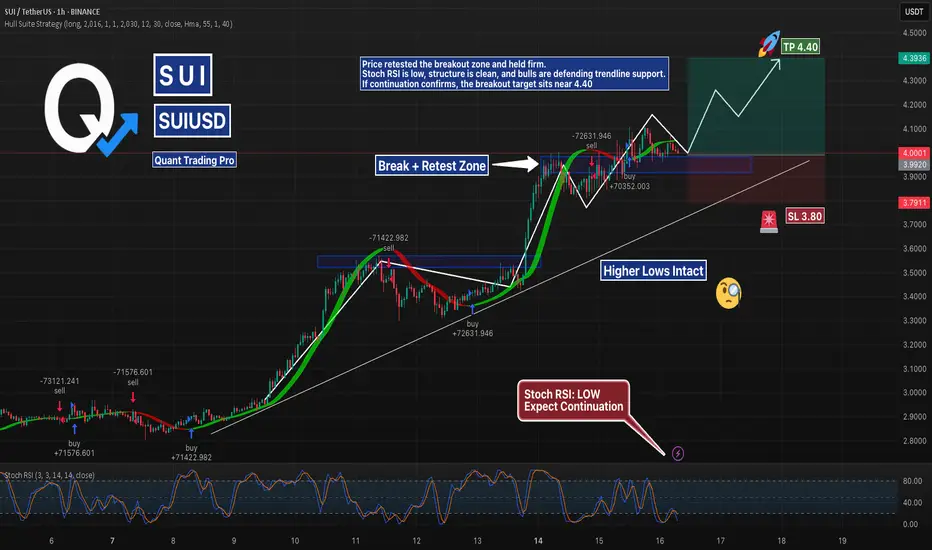
SUIUSD @ Retest Zone | Breakout Setup?SUI is consolidating in a potential bull flag above the previous resistance zone around $4.00.
Stoch RSI is low, trendline support is still intact, and a clean R:R setup presents itself with TP at $4.40 and SL at $3.80.
Watching for volume breakout confirmation before entry.
#SUIUSD #BullFlag #Crypto #SupportResistance #BreakoutSetup #TradingView #QuantTradingPro
SUI Analysis – July 15, 2025
SUI appears to have entered its bullish phase slightly earlier than most other altcoins.
This move seems to be fueled by a number of key partnerships and contracts signed over the past six months — a fundamentally positive signal.
📊 However, based on the current chart structure,
entering at this level may not be the most attractive opportunity.
✅ While a short-term 20% upside could be possible,
it’s more prudent to wait for price to test its previous high,
and observe how investors react to that resistance zone.
Their behavior will offer clearer insight into whether a continuation or correction is likely.

Sui and manipulation.In my opinion, this rally is a manipulation, and we’ll see a sharp correction in the near future.

SUI is breaking out – Time to buy again.SUI is now breaking above the descending trendline. The price is approaching a key resistance zone around $4.10–$4.20. A successful breakout and retest could open the door to a strong bullish continuation.
💬 What do you think?
Drop your thoughts ⬇️
#SUI #CryptoTrading #Breakout #Altcoins #TechnicalAnalysis