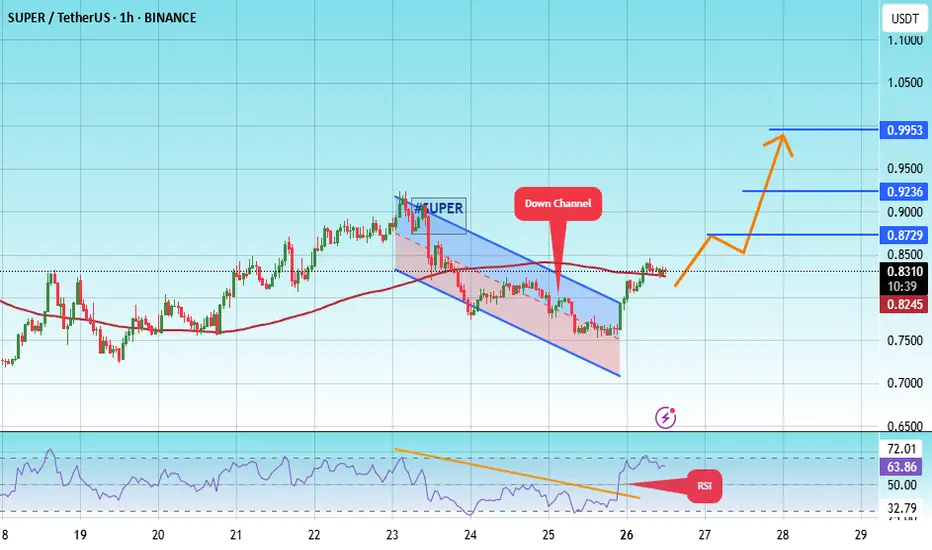
#SUPER/USDT#SUPER
The price is moving within a descending channel on the 1-hour frame, adhering well to it, and is heading for a strong breakout and retest.
We are seeing a bounce from the lower boundary of the descending channel. This support is at 0.7294
We have a downtrend on the RSI indicator that is abo
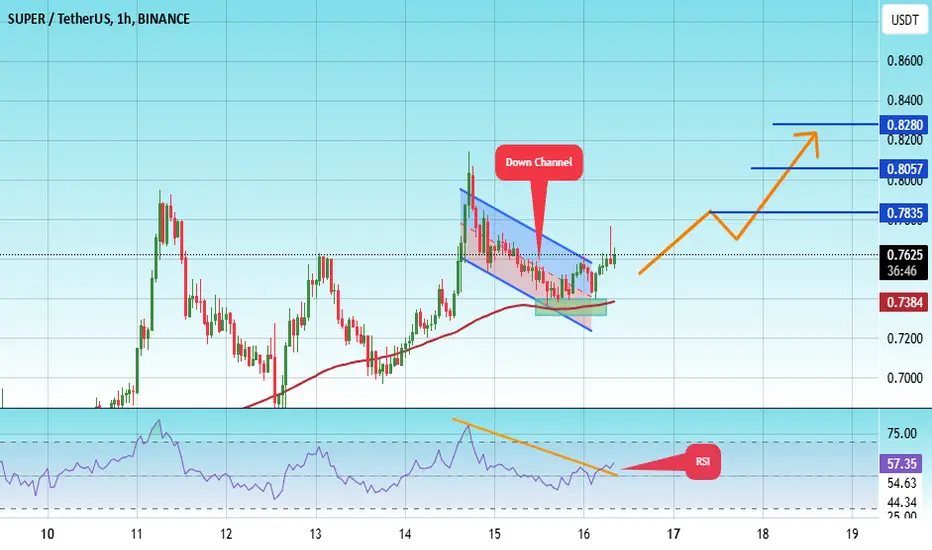
#SUPER/USDT#SUPER
The price is moving in a descending channel on the 1-hour frame and is adhering to it well and is heading to break it strongly upwards and retest it
We have a bounce from the lower limit of the descending channel, this support is at a price of 0.7300
We have a downtrend on the RSI indicato
SUPER about to rip over $1It's ALT SZN baby, Super along with all other alts is about to pump through previous targets, we will be back over 1$ soon then we can revisit other prev targets
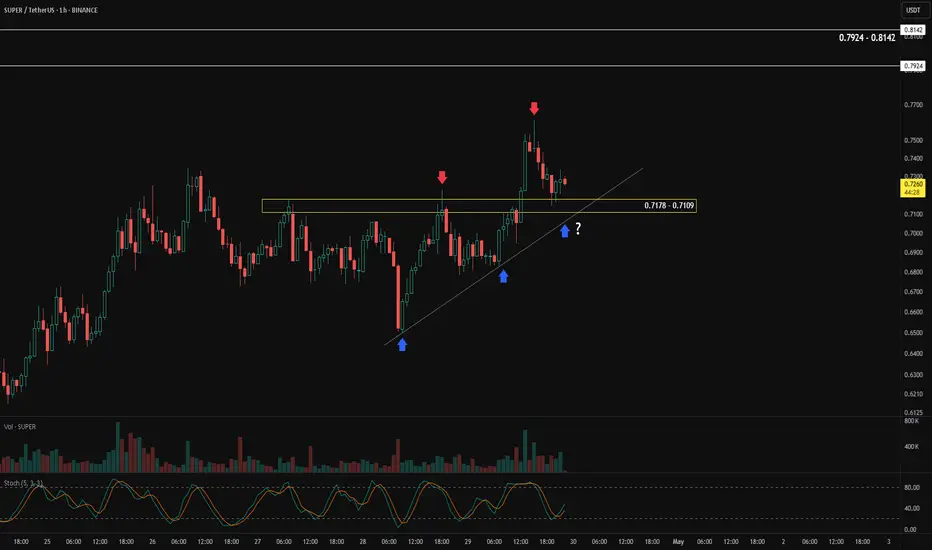
Pullback's Almost Over — Get In Before It RunsThe best time to enter in a bull market is during a pullback — when price temporarily retraces before continuing its upward trend.
In the case of BINANCE:SUPERUSDT , price is currently pulling back into a demand zone between 0.7178 – 0.7109. The overall structure remains bullish, with the blue arr
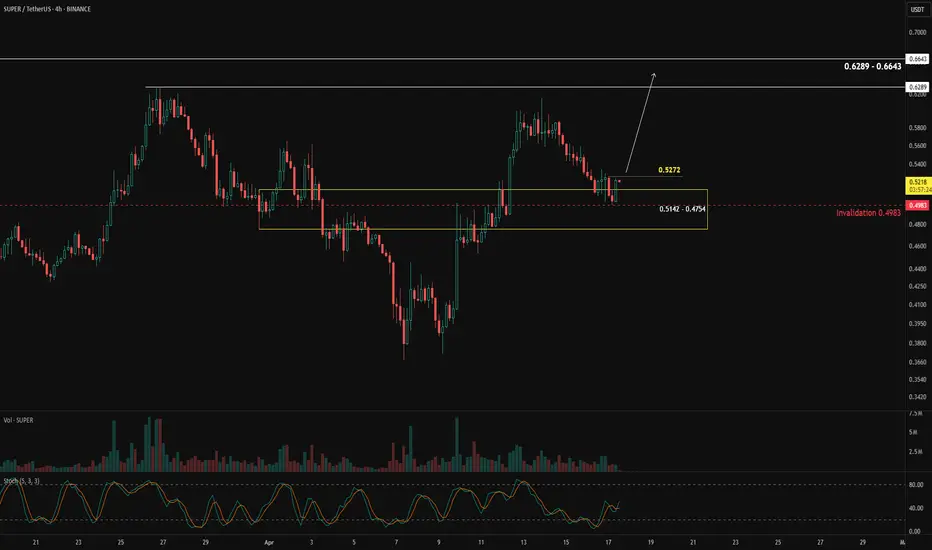
Is This The End of Pullback?BINANCE:SUPERUSDT has entered the support zone between 0.5142 – 0.4754 after a strong impulsive move to the upside.
This support zone is considered valid due to multiple rejections that occurred within this area in the past—indicating strong buyer interest.
Ideally, this is where we expect price
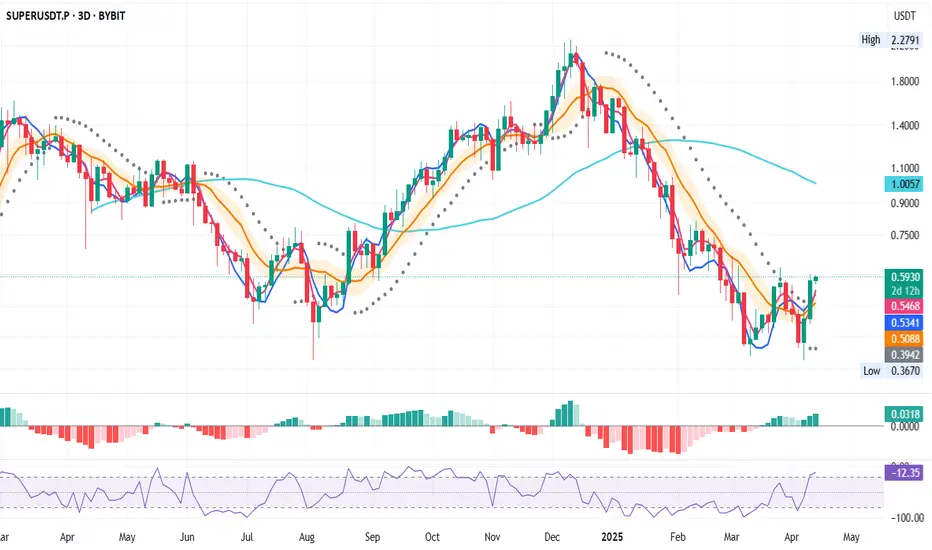
SUPERUSDT – Dual Timeframe Long Signal (1D & 3D)📅 April 13, 2025
So, we have another long system entry — but this one is a bit special.
✅ The long signal is confirmed on both the 1D and 3D timeframes, which adds confidence to the setup.
✅ MLR > SMA > BB Center – strong technical confluence
✅ Price > PSAR – trend shift confirmed on both time
SUPER/USDT Technical Breakdown – Historical Cycle Repeating?🟢 Current Price: $0.5645
📊 Historical Moves (from chart):
🔹 Cycle 1:
🔹 Entry: ~$0.475
🔹 Peak: $1.5192
🔹 % Gain: +236.92%
🔹 Duration: 97 days
🔹 Cycle 2:
🔹 Entry: ~$0.387
🔹 Peak: $2.2603
🔹 % Gain: +361.63%
🔹 Duration: 133 days
🔹 Projected Cycle 3:
🔹 Entry: ~$0.5648
🔹 Peak: $1.6985 - $2.2667

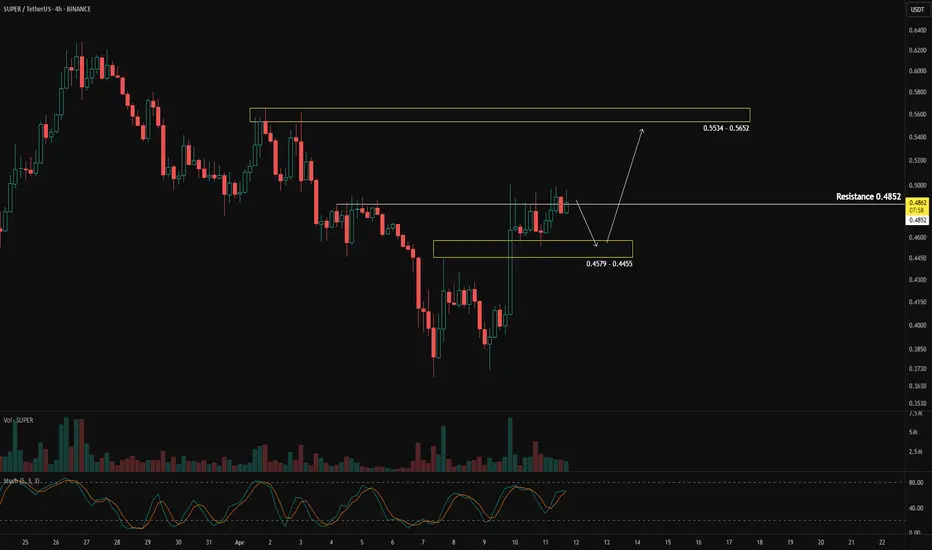
Buyers Still in Control?Price surged from 0.4000, broke the previous high, and reached the 0.4852 resistance level. The current sideways movement around the resistance suggests that sellers lack the strength to push the price lower. Even if a pullback occurs, the 0.4579 – 0.4455 area is expected to act as a support zone, p
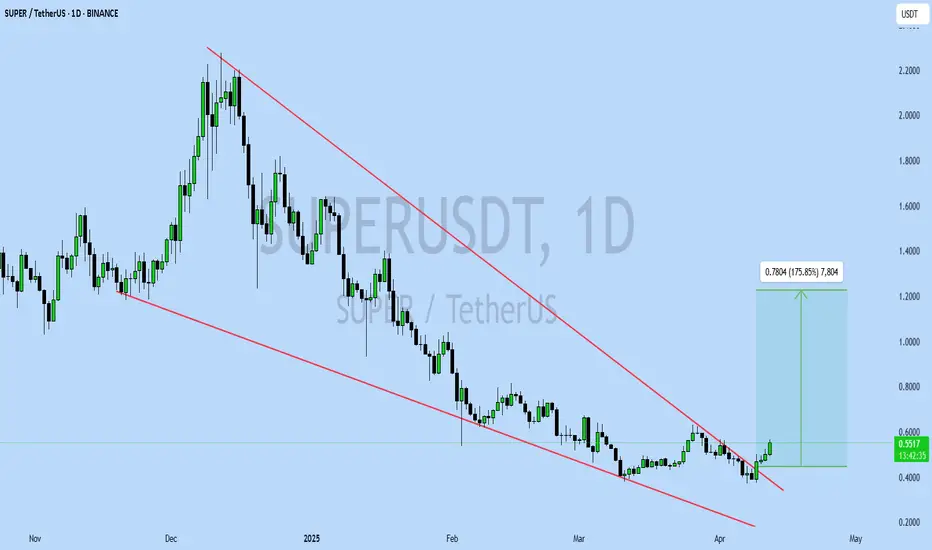
SUPERUSDT UPDATESUPERUSDT is a cryptocurrency trading at $0.5519, with a target price of $1.2000. This represents a potential gain of over 170%. The technical pattern observed is a Bullish Falling Wedge, indicating a possible trend reversal. This pattern suggests that the downward trend may be coming to an end. A b
See all ideas
Summarizing what the indicators are suggesting.
Oscillators
Neutral
SellBuy
Strong sellStrong buy
Strong sellSellNeutralBuyStrong buy
Oscillators
Neutral
SellBuy
Strong sellStrong buy
Strong sellSellNeutralBuyStrong buy
Summary
Neutral
SellBuy
Strong sellStrong buy
Strong sellSellNeutralBuyStrong buy
Summary
Neutral
SellBuy
Strong sellStrong buy
Strong sellSellNeutralBuyStrong buy
Summary
Neutral
SellBuy
Strong sellStrong buy
Strong sellSellNeutralBuyStrong buy
Moving Averages
Neutral
SellBuy
Strong sellStrong buy
Strong sellSellNeutralBuyStrong buy
Moving Averages
Neutral
SellBuy
Strong sellStrong buy
Strong sellSellNeutralBuyStrong buy
Displays a symbol's price movements over previous years to identify recurring trends.