Do you want Easy Money ?!Hi dears .
I can tell you 100% that price will touch 0.7872
short postion in Super recomended extremly
also we got 2000% profit from supper in last 3mouths
You can see the article here
@tradeWithMky More than 91% winrate in TradingView Live 🔥🔥
SUPERUSDT trade ideas
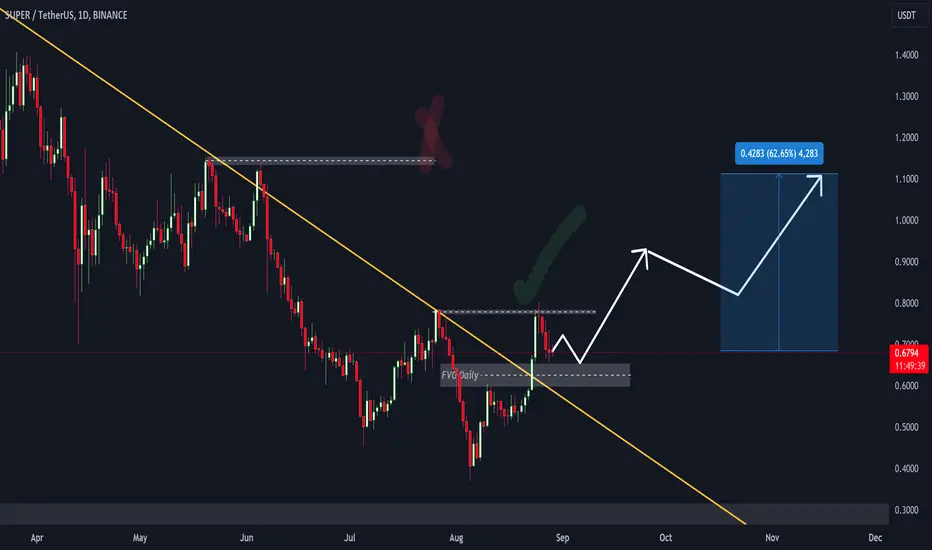
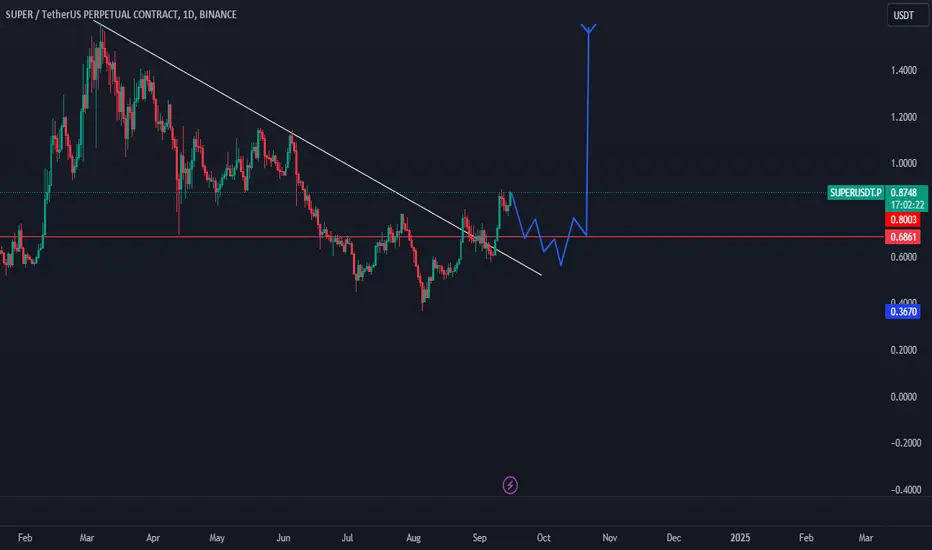
Super or Rocket !! in less than 1 year 3XHi Dears.
Super now touched 4h MovingAverage 50 so This is a Signal to enter 📈
in daily Time frame we have a new FvG that Price can retest it ⌛
in Daily Time frame we passed last lower High and expecting to stand in Uptrend ✅
Long Order Entry : Market -3% ( Market Price : 0.68 )
Target : 2X - 3X Price : 1.22 price 1.77
@TradeWithMky
🔥
#SUPER New ascending large ABC structureAccording to Elliott Wave Theory, in a WXY correction, the X wave may sometimes form a triangular pattern, but this is uncommon. The X wave is typically a corrective wave and, in most cases, takes the form of a zigzag, flat, or another complex correction. Triangles are usually expanding or contracting and are often seen during market consolidation and when a change of direction is expected. Triangles are generally found in the final wave (such as wave B or wave 4).
However, in complex corrections like WXY, a triangular formation within the X wave can occur occasionally, especially when the X wave is undergoing a consolidation phase. In the WXY correction, the X wave typically represents the intermediate correction of the previous move, and a triangular formation may be suitable for this structure, but such a situation requires careful analysis.
In the current rise, the X peak is an entry point for a LONG position. An increase towards the C wave of the large ABC structure is observed.

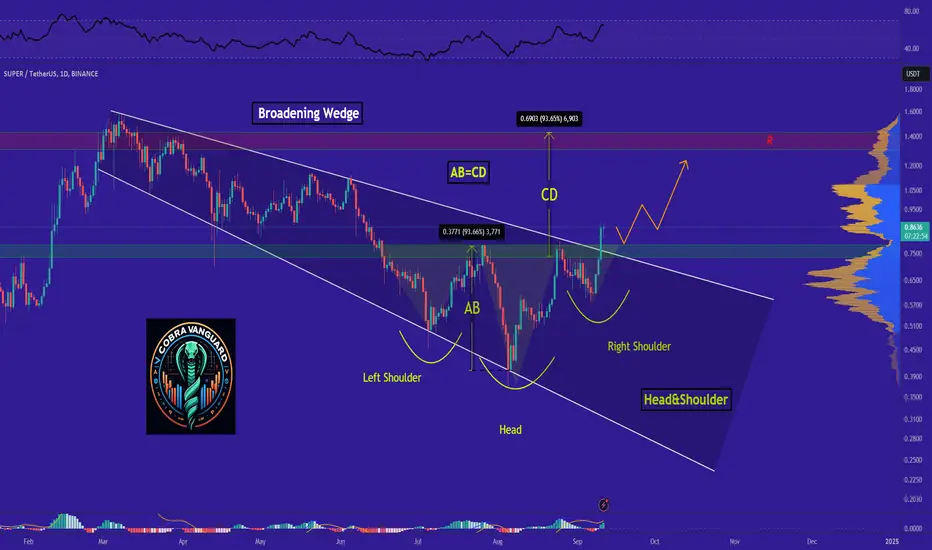
SUPER is Bullish now & many Traders don't see it !!As you can see, the price was able to break both the neckline and the wedge line at the same time, which means that the price can rise as shown in the chart.
✨Traders, if you liked this idea or have your opinion on it, write in the comments, We will be glad.
_ _ _ _ __ _ _ _ _ _ _ _ _ _ _ _ _ _ _ _ _ _ _ _ _ _ _ _ _ _ _ _
✅Thank you, and for more ideas, hit ❤️Like❤️ and 🌟Follow🌟!
⚠️Things can change...
The markets are always changing and even with all these signals, the market changes tend to be strong and fast!!
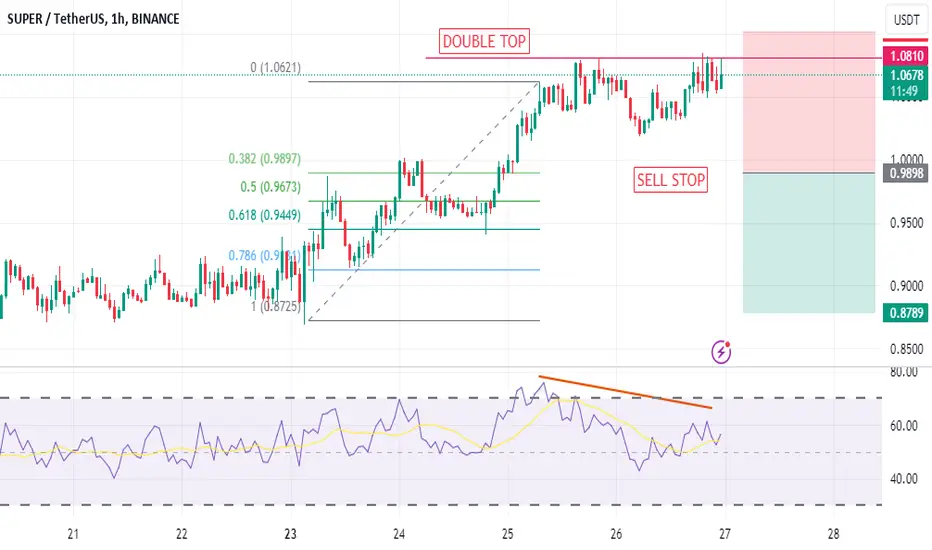
SUPERUSDTWe can attempt to short SUPERUSDT from specified level if it break HL , also there is bearish divergence occur indicate that it moves downward.
SL , TP mention in chart.
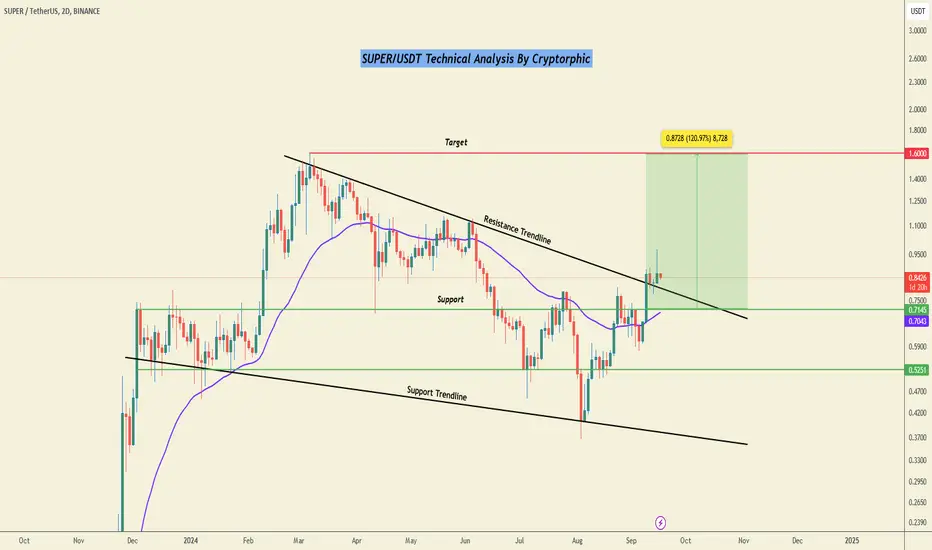
#SUPER Price Update & Analysis in a 2-Day TimeframeAfter an impressive rally of 140% from the lower support, the SUPER token has broken above the resistance trendline. Our upper resistance target was set at $0.918, with the price reaching as high as $0.974.
Currently, SUPER is retesting the resistance trendline, and the support range between $0.714 and $0.78 must hold strong. A rebound from this support range could push the price toward a 120% gain, targeting $1.60 (the previous local high).
However, a daily candle close below this support is likely to trigger a pullback, with the price potentially dropping to $0.52 or even $0.40.
Key levels:
- Crucial Support: $0.714-$0.78.
- Rebound Target: $1.6.
- Lower Support: $0.4-$0.52.
DYOR, NFA.
Please hit the like button to support my content and share your thoughts in the comment section. Feel free to request any chart analysis you’d like to see!
Thank you.
#SUPER #Crypto
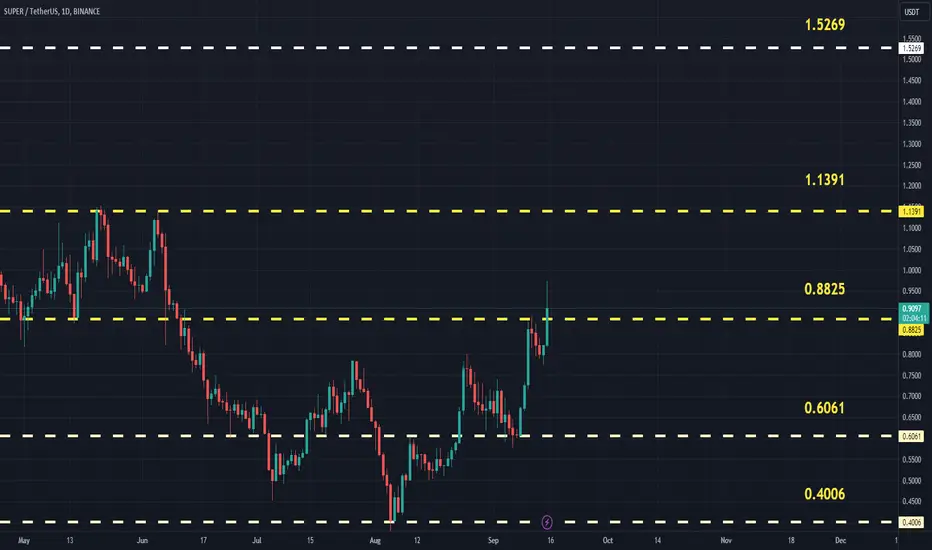
SUPERUSDT(SuperVerse) Updated till 15-09-24SUPERUSDT(SuperVerse) Daily timeframe range. in here PA trying to have a proper close above 0.8825 but seller trying to hold it back. if it gets a valid close above 0.8825 it can push further. local support at 0.6061.
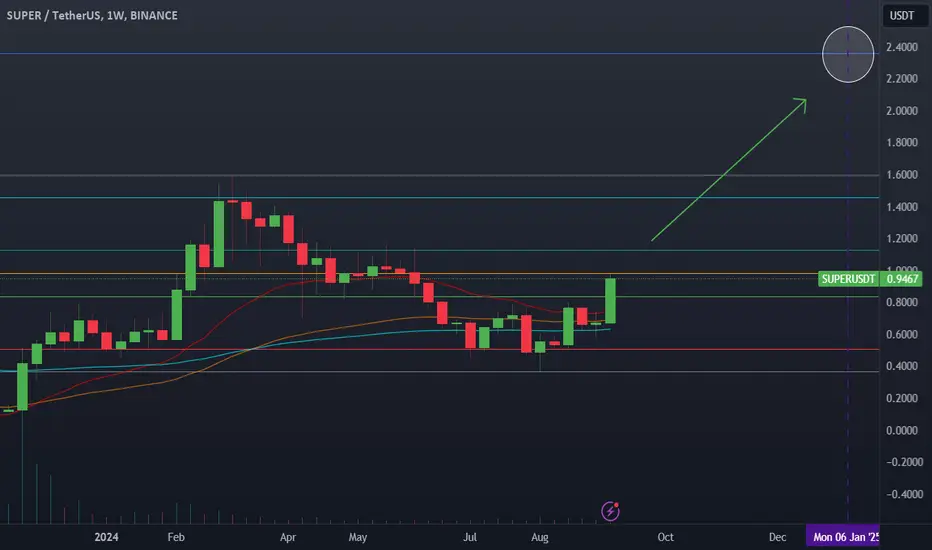
Super tests top of the range and price targetHere is my weekly setup on Super, I have been holding the second 50% of my bags through all of this chop. My target for end of year is 2.36$ assuming the run doesnt get way too crazy. This could completely line up on that golden ratio fib. The token has tremendous momentum so it would not surprise me if Super starts a crypto gaming bullrun.
$SUPERBSE:SUPER is know take retest as CRYPTOCAP:BTC react market is volatile SEP 18th Rate cuts maybe market take some liquidity around 55k now Super is coming downside around .55$ to .60$ then it take pump
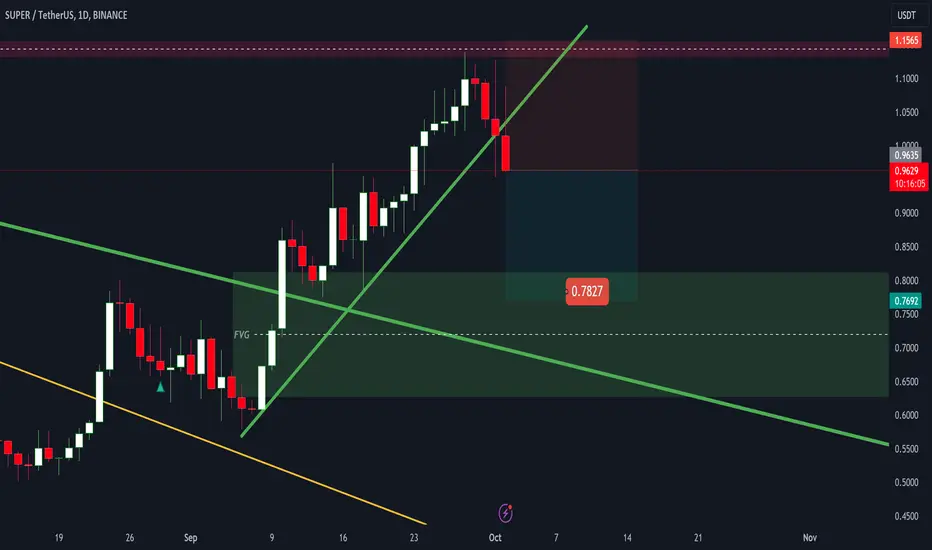
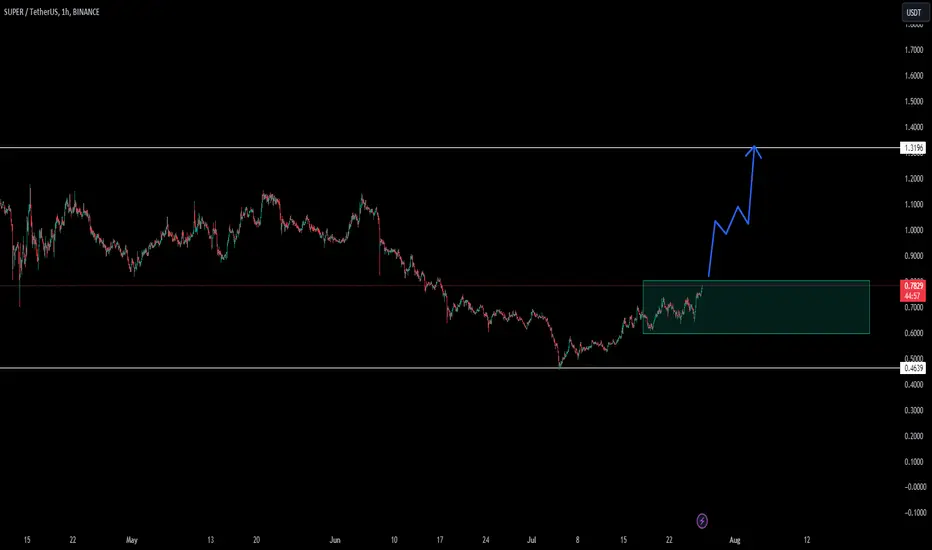
SUPER Long Position (Support Flip Opportunity)Market Context: SUPER has broken through resistance, now acting as support. As long as the price stays above this level, it presents a bullish scenario.
Trade Setup:
Entry: Ladder into a long spot trade once the price retraces into the $0.70 - $0.785 area of support.
Take Profit:
First target: $1.0320 - $1.150
Second target: $1.40 - $1.50
Stop Loss: Just below $0.60
📊 This setup focuses on capitalizing on the bullish momentum with solid risk management. #SUPER #CryptoTrading #SupportFlip
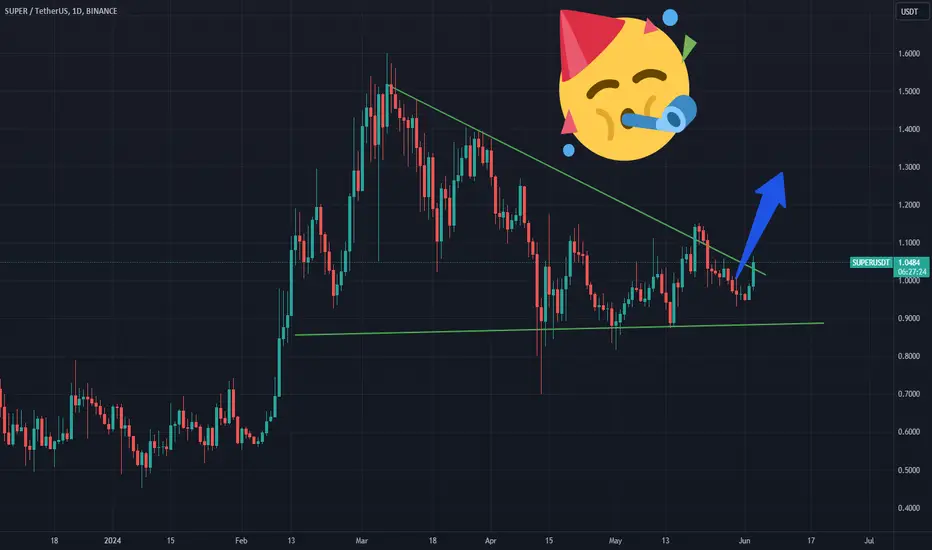
Super Getting Ready For 2x Super Recently Breaks Descending Broadening Wedge + Crucial Horizontal Area & Currently Retesting It Incase Of Successful Retest Expecting Move Move Towards Recent High
Incase Of Successful Retest Expecting almost 110% Profit

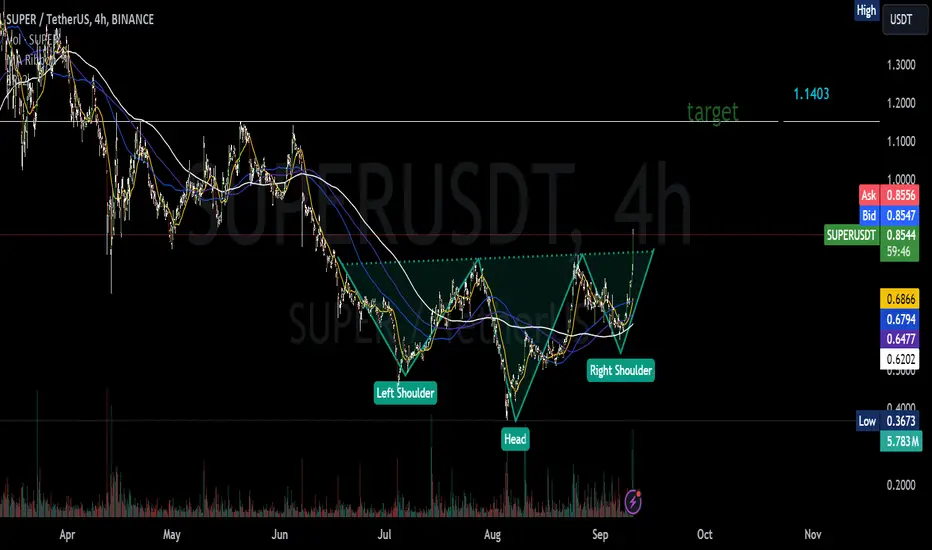
Inverted head and shoulders pattern on 4hr TP-1.14Inverted head and shoulders pattern on 4hr TP-1.14
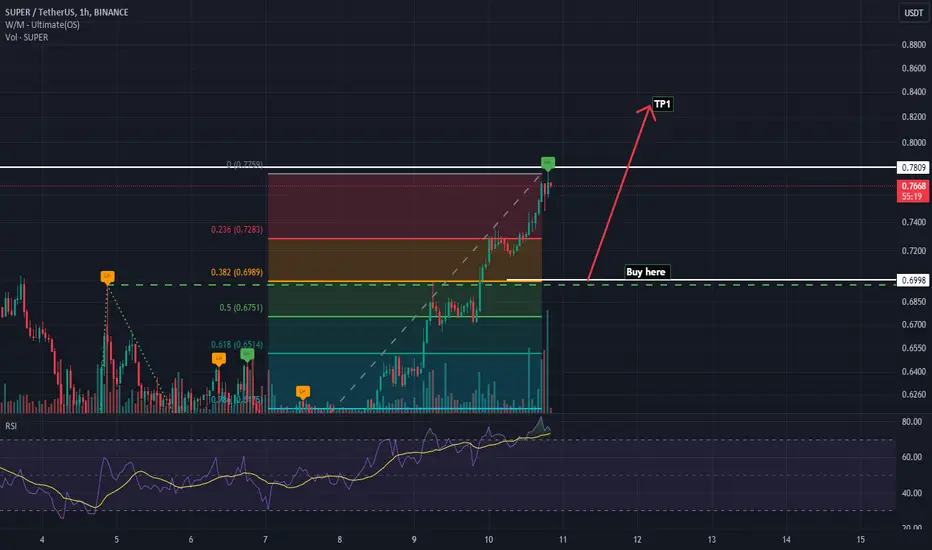
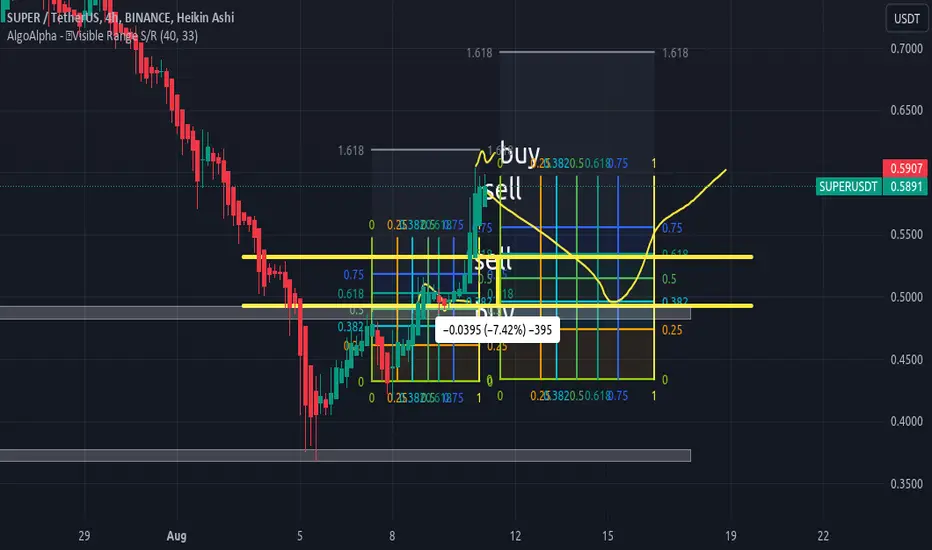
SuperUSDT in Bullish Trent to be accumulated as per the target Superusdt is in the bull Trend making HH and HL to be accumulated at FIBO Level
Plan
Entry: 0.72
Exit"0.68
TP1: 0.8
TP2 :0.9 above
Short position on SUPERUSDT / Which one is correct?BINANCE:SUPERUSDT
COINBASE:SUPERUSD
SL1 ---> Low-risk status: 3x-4x Leverage
SL2 ---> Mid-risk status: 5x-8x Leverage
👾The setup is active but expect the uncertain phase as well.
➡️Entry Area:
Yellow zone
⚡️TP:
0.6712
0.6605
0.6517
0.6408
0.6266
SL:
0.7181
The Alternate scenario:
If the price stabilizes above the trigger zone, the setup will be cancelled.

SUPER Update Still On TrackUpdate from my previous Super idea, we are still on track to get back to $1 and $3 soon. BTC also looks to be slowing down on the sell off we are near the range of reversal back towards 64k. Super is backed by lots of collaborations and is the future of gaming, the target of $3 is very modest I think we can get above $20 easily in the next few months. But who knows? Not financial advice.
$Super how I see it.a bit of retracement of wave 3.. on a short chart.. it can go a bit further up.. but .... good luck..
$SUPER Path Back to $1.6 and $3 SoonThe whole market has been dumping for some time where alts and all coins peaked in March and now after a healthy drop are primed for a run up again. Super has this falling triangle pattern in when it breaks will easily reclaim $1.60 then we do a measured moved up to $2.80 and eventually $3 shortly after. BSE:SUPER this a coin that can easily be around $25-30 by the peak of this bull run. DYOR NOT FINANCIAL ADVICE

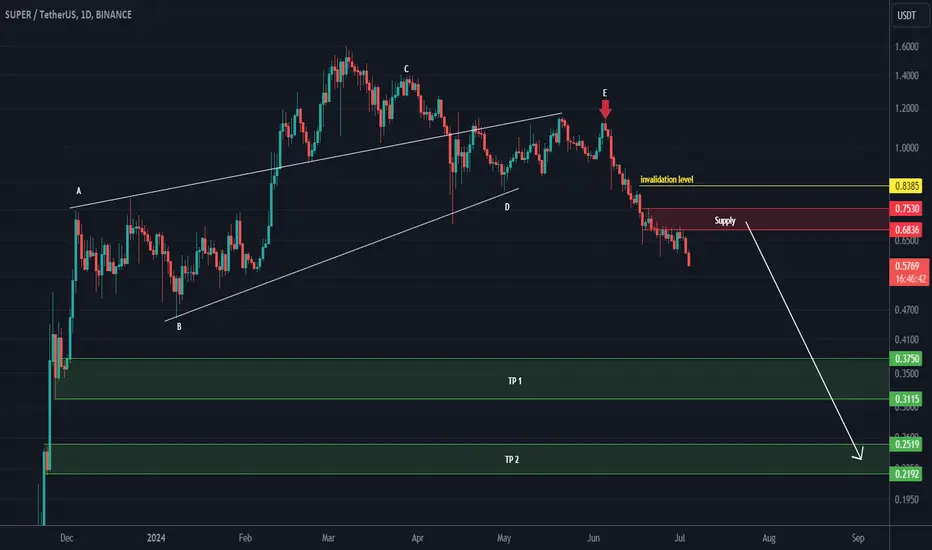
SUPER looks bearishNote: Do not enter a position without trading setup
From where we put the red arrow on the chart, it looks like the SUPER triangle has ended and it has entered a new big wave.
From the specified supply, it can drop towards the targets on the chart.
The targets are clear on the chart.
Closing a daily candle above the invalidation level will violate the analysis.
For risk management, please don't forget stop loss and capital management
Comment if you have any questions
Thank You
SUPER/USDT POSSIBILITY FOR NEW BREAKTrend study shows that this coin has the possibility to get a break in the coming time.
Since the last 2 days, this coin has shown an interesting view.
We will follow this coin for the possibility of the next break
It depends all on the high chance after data info
We follow this coin if it's going to show a super effect with the next confirmations.
confirmation are important before trend continue
SUPER Technical Analysis in Daily TimeframeHello everyone, I’m Cryptorphic.
For the past seven years, I’ve been sharing insightful charts and analysis.
Follow me for:
~ Unbiased analyses on trending altcoins.
~ Identifying altcoins with 10x-50x potential.
~ Futures trade setups.
~ Daily updates on Bitcoin and Ethereum.
~ High time frame (HTF) market bottom and top calls.
~ Short-term market movements.
~ Charts supported by critical fundamentals.
Now, let’s dive into this chart analysis:
SUPER has reached a crucial support range between $0.502 and $0.556. After a heavy 60% fall, SUPER is trying to rebound, with the current market price at $0.556.
If this rebound is successful, we are likely to see the price testing the primary resistance at $0.7145.
On the lower end, if #SUPER breaks down below the primary support level, it is likely to hit the lower support of $0.418.
- Primary Support: $0.502 to $0.556.
- Lower Support: $0.418.
- Primary Resistance: $0.7145.
- Higher Resistance: $0.918.
- Invalidation Point: A breakdown and close below the lower support level.
DYOR, NFA.
Please hit the like button to support my content and share your thoughts in the comment section. Feel free to request any chart analysis you’d like to see!
Thank you!
#PEACE

superusdtBSE:SUPER market analysis
The price action of BSE:SUPER is consolidating in a descending triangle pattern on the daily time frame. After bouncing back from its support level, it is currently testing its resistance trendline area, which is marked between $0.9632 and $0.9189. 📈
Price action has the potential to break above its resistance trendline level, indicating further upside.
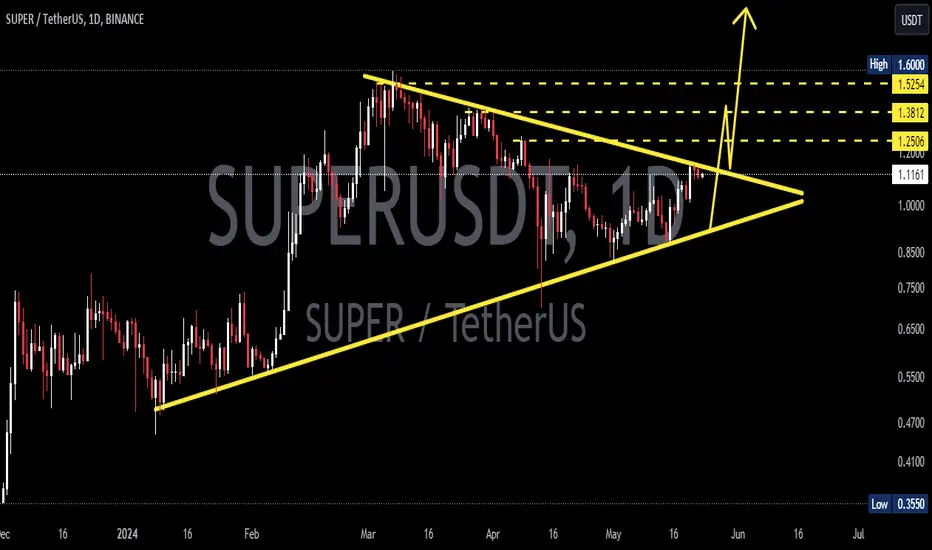
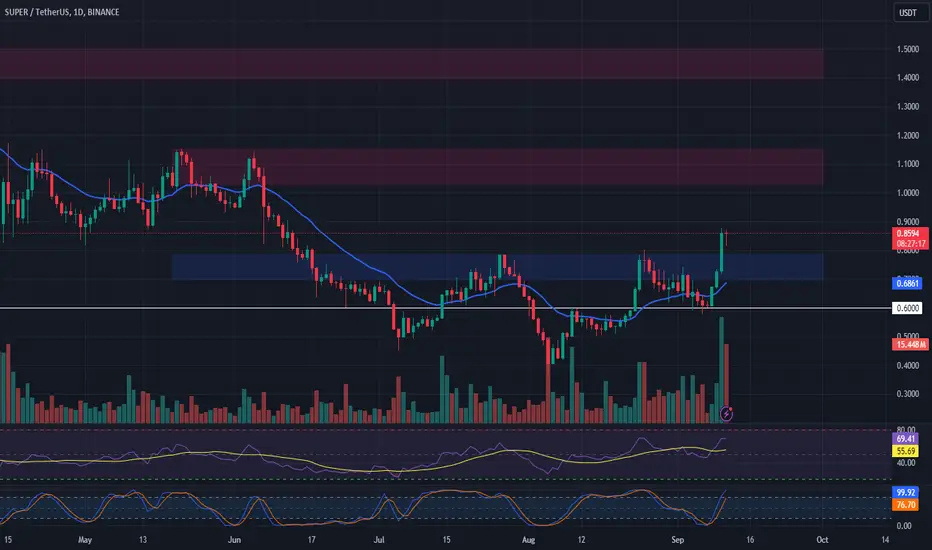
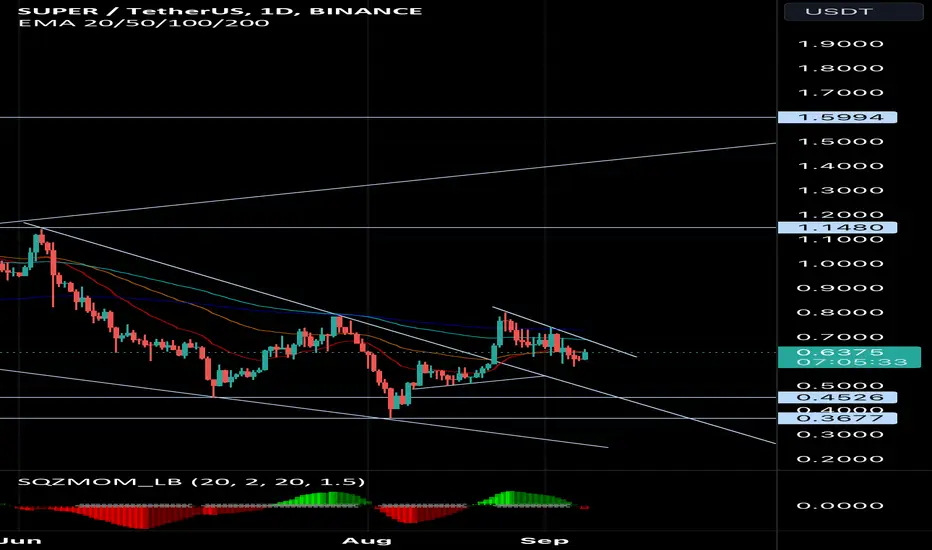
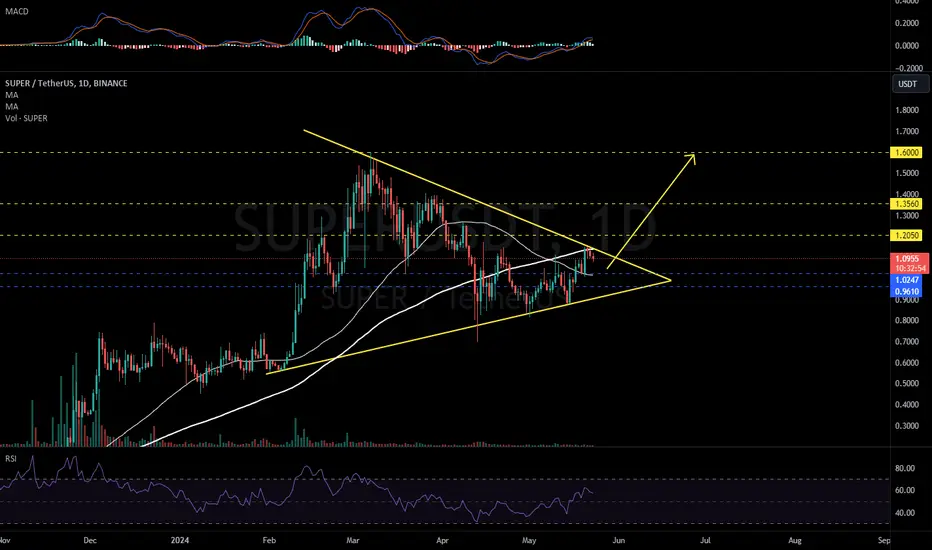
SUPERUSDT 1DSymmetrical triangle on the #SUPER daily chart. Currently, it has been rejected from the triangle resistance and MA100. Buy it on its supports. MA50 is acting as a support. In case of a breakout, the targets are:
$1.2050
$1.3560
$1.6000
SUPERUSD 1DSUPER ~ 1D
#SUPER Make purchases gradually in this pattern. It is only a matter of time until this resistance line is successfully broken. with a minimum target of 15%+