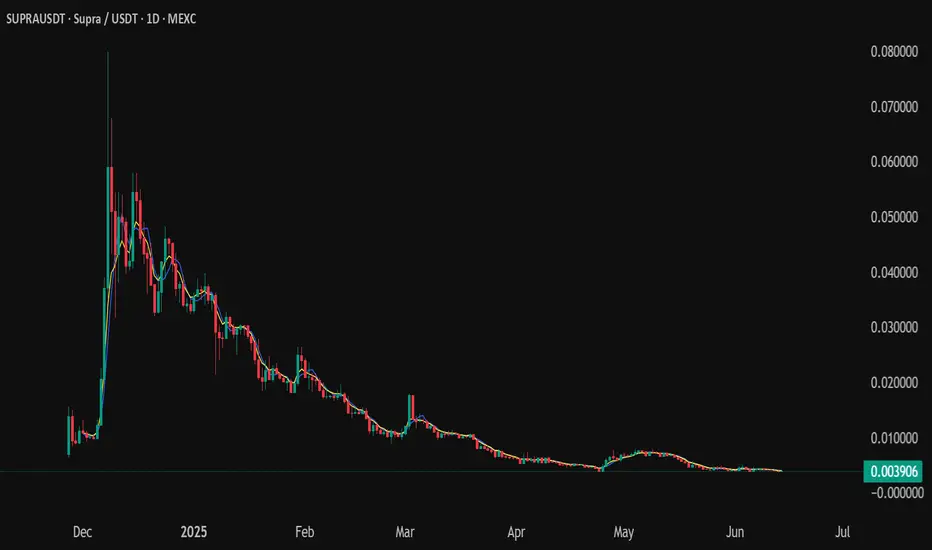
garbage!!!idk why everyone loves this token. 55M market cap and 392M full diluted. thats less than 15% of all tokens. and the chart looks like trash. why would you buy this???
chart pattern is garbage lol
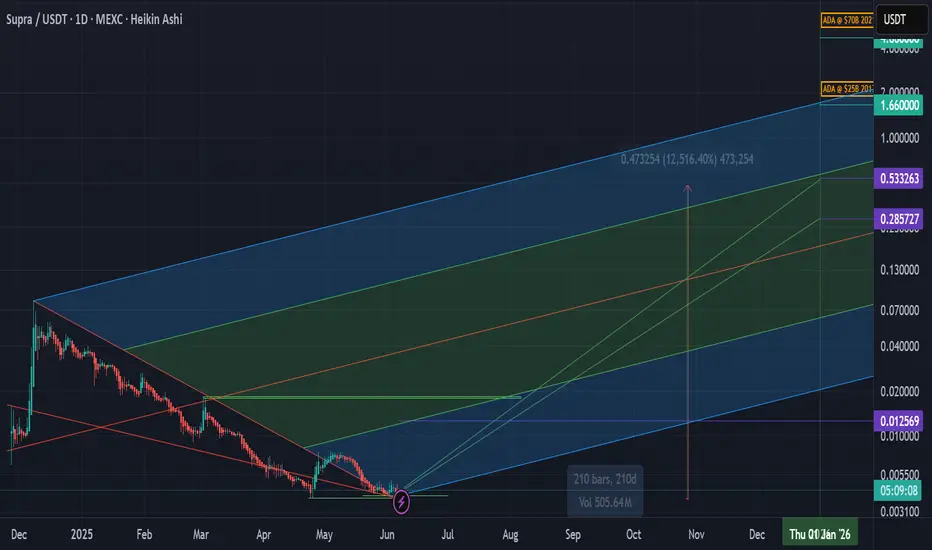
Supra 2025 price predictions for end of yearI have a $0.28 target and a $0.53 target for end of 2025 bull cycle. I am using an extended pitch fork fib extension to help see potential targets. A very promising layer 1 with unique backing plus oracle integration into node network. These price points are extremely conservative in my opinion.
Adam Eve -Double Bottom- Bullish patternIf this not break 0.0039 support the possible breakout is above $0.015.

SUPRA finding its bottom begins with a healthy RRSUPRA RR is really nice. After a strong recovery, a rounded bottom would suggest a healthy accumulation range before we move up. Invalidation is clear while momentum and trend oscillators support a bullish move.
Full TA: Link in the BIO

SUPRA !! Big double bottom setupSupra has potential for double bottom. invalid level if it falls below 0.003591.
DYOR!NFA!
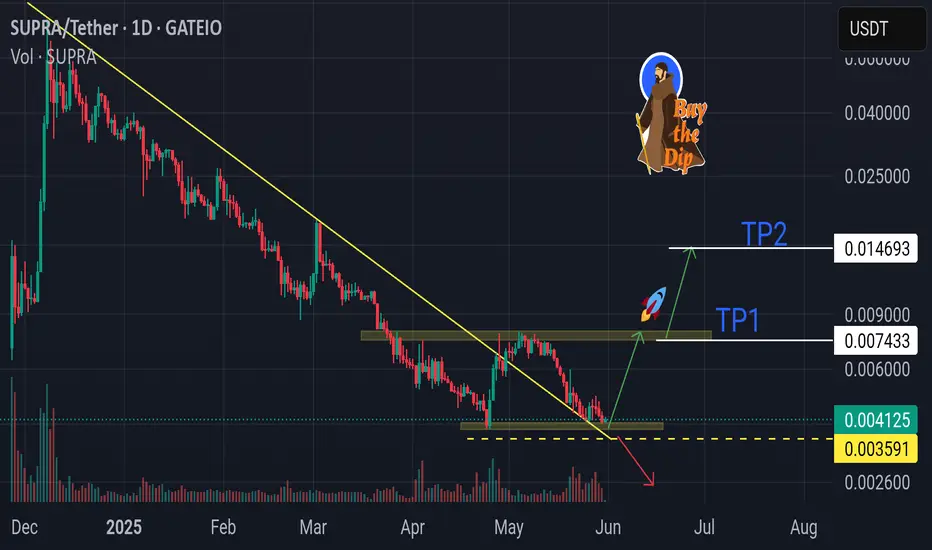
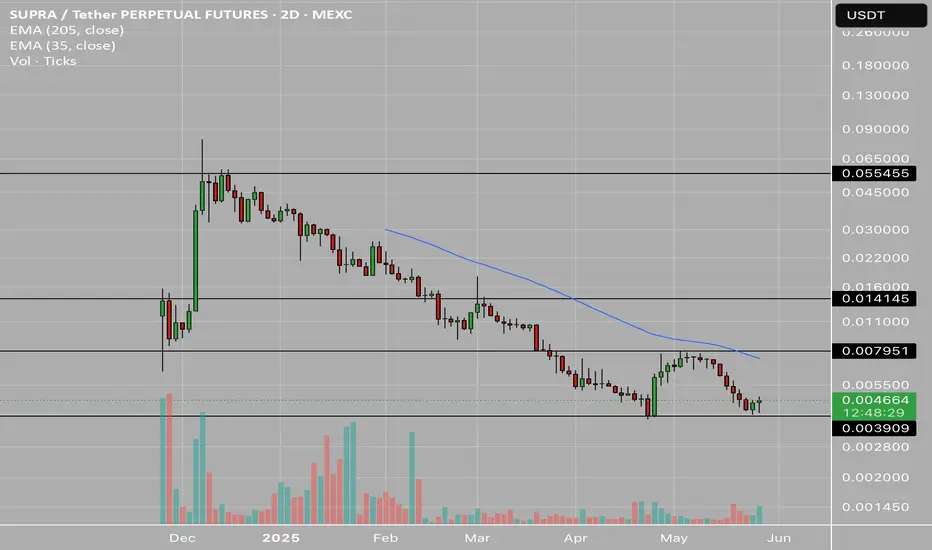
SUPRA Setting Up For Big Move UpThe 2 day chart on Supra looks as if it has bottomed. With some volume we could really see an explosive move to .014 in the short term.
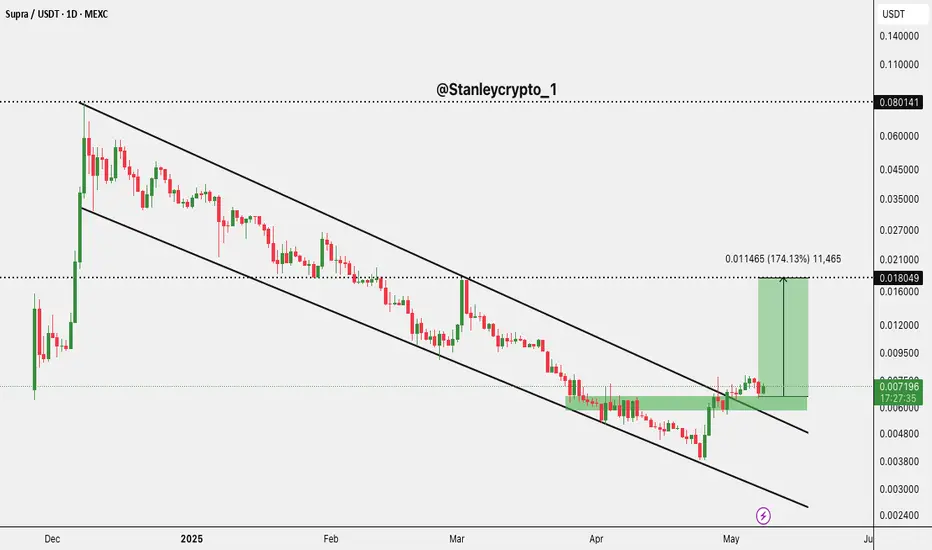
$SUPRA Breakout Alert$SUPRA Breakout Alert
After months in a descending channel, SUPRA has broken out with strong volume.
Price flipped resistance into support and now targets the 0.01805 USDT level, a potential +174% move from the breakout point.
Eyes on 0.01805 📈 DYRO, NFA
$SUPRA Breakout Confirmed — Trend Reversal in Play!$SUPRA just flipped the script!
After months of bleeding under a brutal downtrend, it finally broke out clean and confident.
That long-term resistance? Crushed.
Now it's retesting the breakout zone, a classic reclaim move.
EMAs are curving up, momentum's clearly shifting.
In my opinion, this break

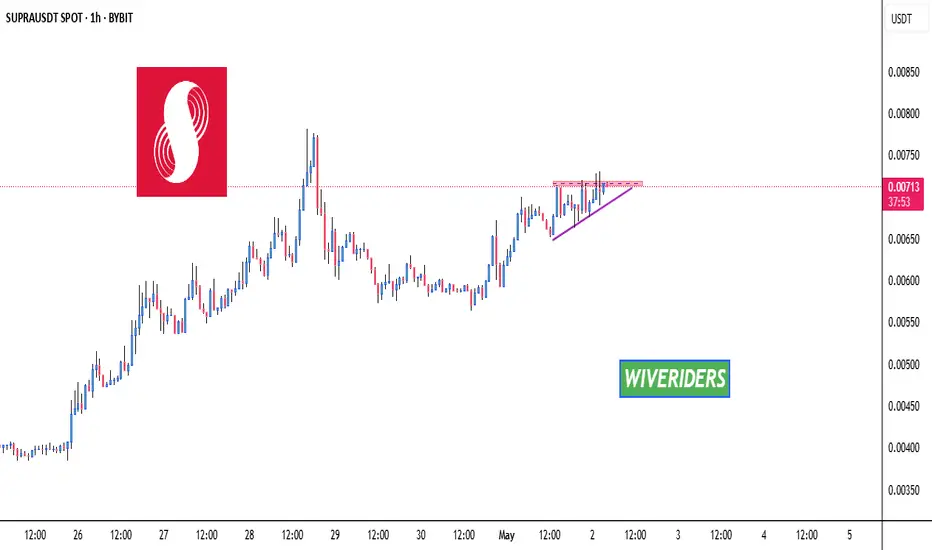
SUPRA is forming an ascending triangle patternSUPRA is forming an ascending triangle pattern and is approaching a key red resistance zone. A breakout above this level could confirm the bullish pattern and signal a strong upward move.
📈 Technical Overview:
Pattern: Ascending Triangle
Resistance Zone: Red area currently being tested.
🎯 Breakou
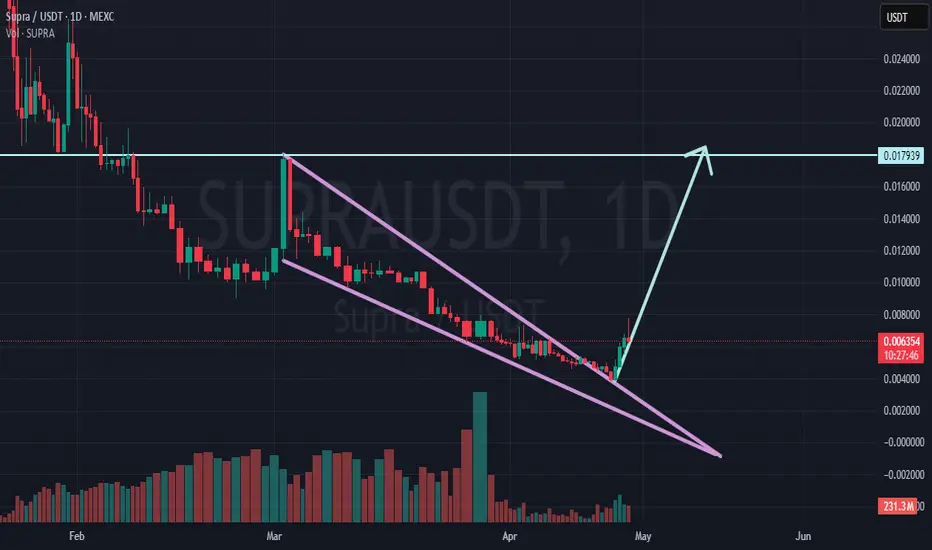
SUPRA: Classic Falling Wedge Breakout/Start of Bullish Uptrend The SUPRA/USDT daily chart highlights a textbook bullish reversal setup, marked by a well-defined falling wedge. Importantly, the extended downtrend within the wedge should not be seen as weakness — rather, it reflects a phase of strength through consolidation, as evidenced by the steady decline in
See all ideas
Summarizing what the indicators are suggesting.
Oscillators
Neutral
SellBuy
Strong sellStrong buy
Strong sellSellNeutralBuyStrong buy
Oscillators
Neutral
SellBuy
Strong sellStrong buy
Strong sellSellNeutralBuyStrong buy
Summary
Neutral
SellBuy
Strong sellStrong buy
Strong sellSellNeutralBuyStrong buy
Summary
Neutral
SellBuy
Strong sellStrong buy
Strong sellSellNeutralBuyStrong buy
Summary
Neutral
SellBuy
Strong sellStrong buy
Strong sellSellNeutralBuyStrong buy
Moving Averages
Neutral
SellBuy
Strong sellStrong buy
Strong sellSellNeutralBuyStrong buy
Moving Averages
Neutral
SellBuy
Strong sellStrong buy
Strong sellSellNeutralBuyStrong buy
Displays a symbol's price movements over previous years to identify recurring trends.