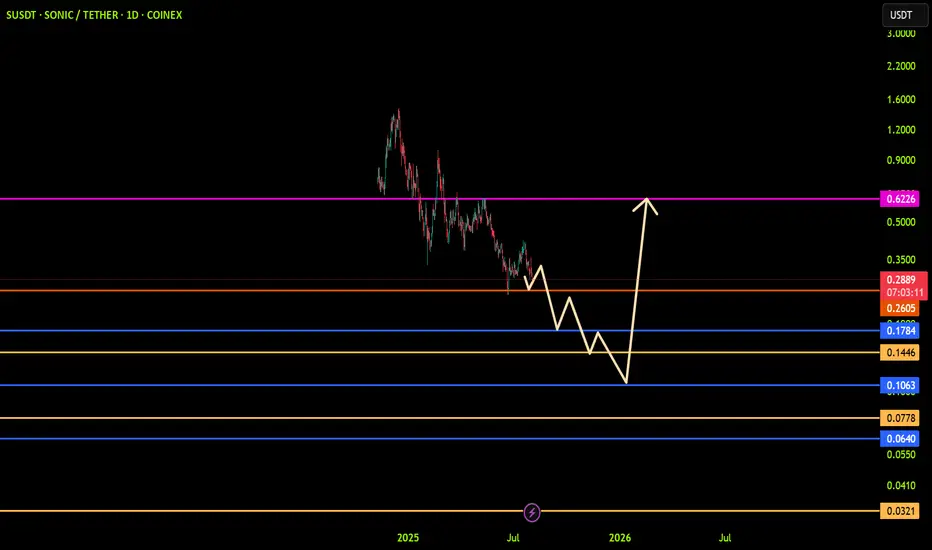
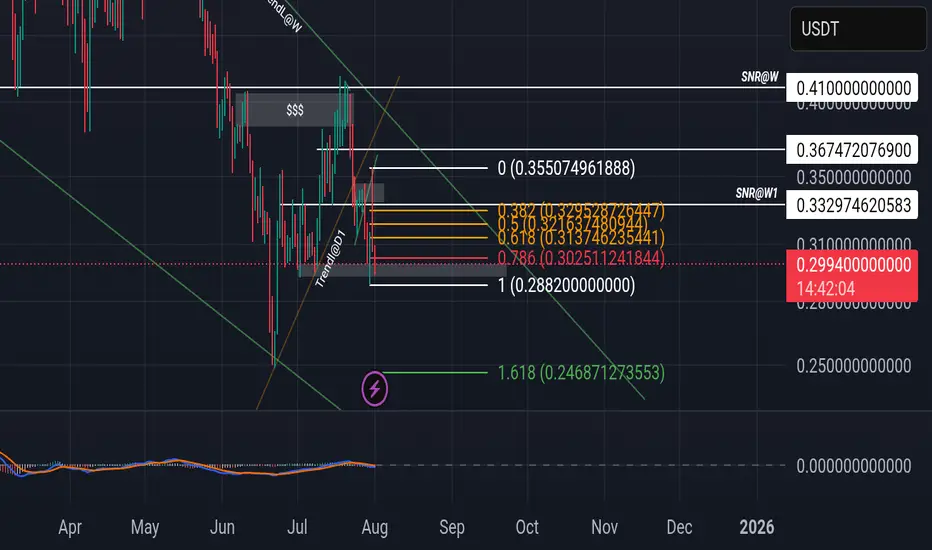
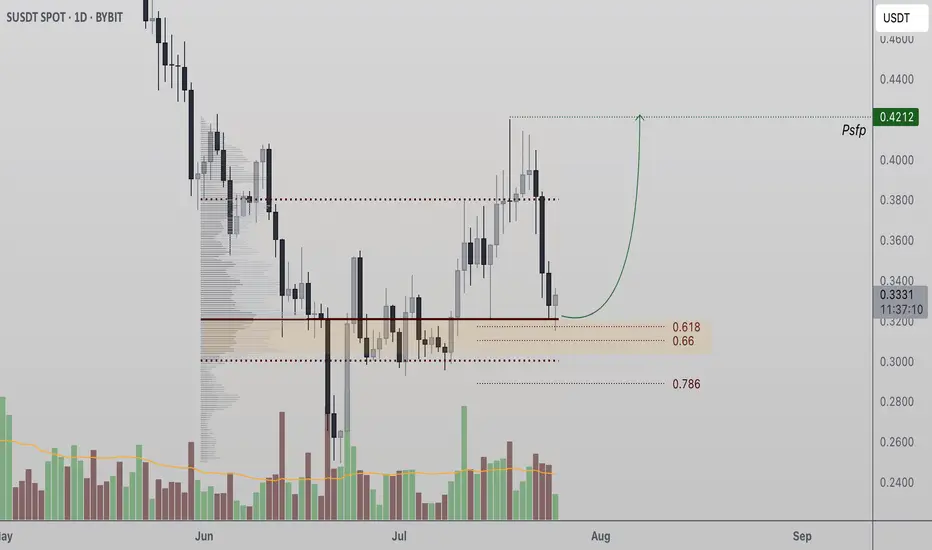
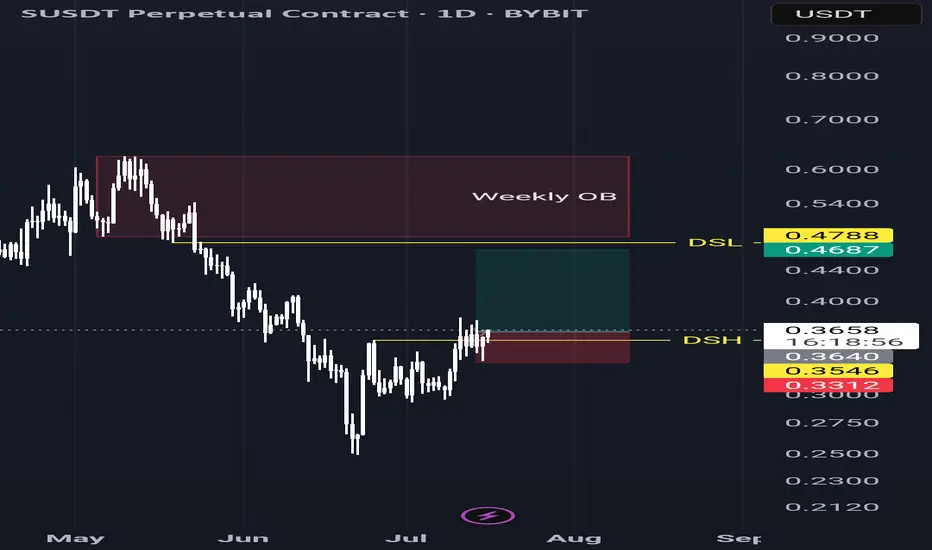
SUSDT: trend in daily time frames ((((( Each of these entries can reach the main TARGET)))))
The color levels are very accurate levels of support and resistance in different time frames, and we have to wait for their reaction in these areas.
So, Please pay special attention to the very accurate trend, colored levels, and you must know that SETUP is very sensitive.
Be careful
BEST
MT
SUSDT trade ideas
Sonic Near Strong Support, Eyes 15% Rally Toward $0.36 TargetHello✌️
Let’s analyze Sonic’s price action both technically and fundamentally 📈.
🔍Fundamental analysis:
Sonic Token’s Fee Monetization lets developers keep up to 90% of fees their apps make, boosting growth by rewarding active builders. This approach helped other projects grow 20-40% TVL early on.🚀
📊Technical analysis:
BINANCE:SUSDT shows solid volume near a strong daily support; if it holds, a 15% upside toward $0.36 looks likely. Watching this level is key for a potential bounce.📊🔍
✨We put love into every post!
Your support inspires us 💛 Drop a comment we’d love to hear from you! Thanks, Mad Whale

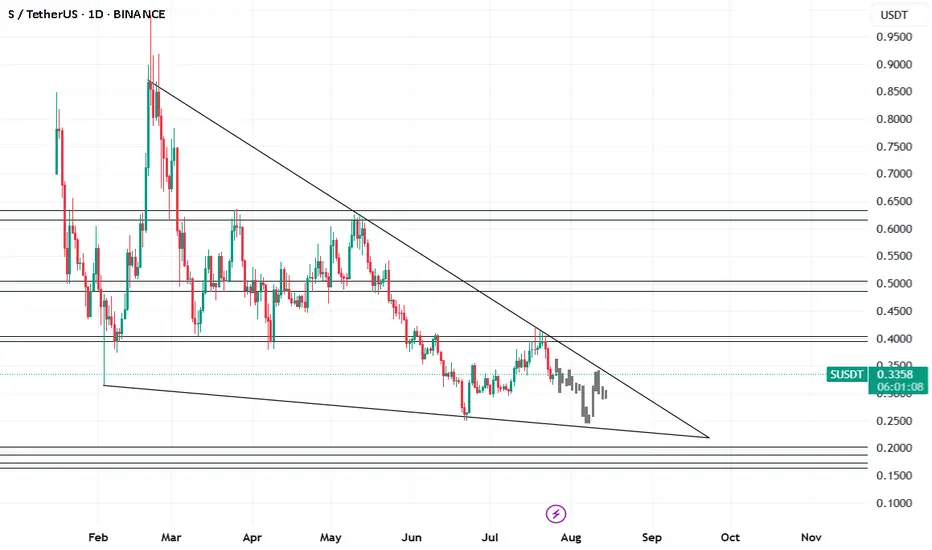
SONIC/USDT — Descending Triangle at Key Support!Overview
The daily chart shows a clear medium-term downtrend (well-defined descending trendline) meeting a strong horizontal support zone around 0.25–0.31 USDT (yellow box). Current price ≈ 0.3059 USDT. This structure forms a descending triangle or accumulation range, signaling that the market is in a decision phase — either a bullish breakout or a bearish continuation.
---
Key Levels
Current Price: 0.3059
Support Zone: 0.2494 – 0.305 (historical low at 0.2494)
Descending Trendline Resistance: ~0.33–0.35 (dynamic)
Next Resistances: 0.3891, 0.5278, 0.6067, 0.7461, 0.8654, 1.0453
Breakdown Measured Target: ~0.11 (if 0.2494 breaks)
Potential % moves from current price:
To 0.3891 ≈ +27.2%
To 0.5278 ≈ +72.5%
To 0.2494 ≈ −18.5%
To 0.11 ≈ −64%
---
Pattern & Interpretation
Main Pattern: Descending trendline + horizontal support = descending triangle (bearish bias unless broken to the upside).
Bearish Signal: Lower highs structure, price still under the descending trendline, supply pressure dominant. A daily close below 0.2494 with high volume = breakdown confirmation.
Bullish Signal: Daily close above the trendline (~0.33–0.35) with strong volume, followed by a successful retest = breakout confirmation. Extra confirmation if price breaks and holds above 0.3891.
---
Scenarios
Bullish
1. Break & daily close above trendline (~0.33–0.35) with rising volume.
2. Retest holds as support.
3. Targets: 0.3891 (+~27%), then 0.5278 (+~72%).
4. Stop-loss: below support box (~0.28 or safer < 0.2494).
Bearish
1. Daily close below 0.2494 with strong volume = breakdown.
2. Measured move target ≈ 0.11.
3. Conservative target: psychological zones 0.18–0.15.
4. Stop-loss for shorts: above 0.305–0.33.
---
Trading Notes
Conservative Long: Wait for breakout & retest above trendline.
Aggressive Long: Enter near support (0.26–0.30) with tight stop below 0.2494.
Short: Only after confirmed breakdown below 0.2494.
Always watch daily close + volume to avoid false signals.
---
Conclusion
Current trend is bearish, but the strong 0.25–0.31 support keeps the possibility of a short-term rebound alive.
Decision point: Breakout above 0.35 → bullish rally, Breakdown below 0.2494 → extended sell-off.
Risk management is key — use stop-losses and position sizing.
#SONIC #SONICUSDT #CryptoAnalysis #SupportResistance #DescendingTriangle #Breakout #Altcoin #RiskManagement
Sonic Token Stuck in Range as Accumulation Phase Forms Sonic Token is showing signs of a classic range-bound market structure, with price rotating between the value area high and the value area low. The most recent rejection from range highs has shifted price action back toward the lower boundary of the range. This setup suggests a potential equilibrium phase that could last for days or even weeks before any breakout occurs.
Key Technical Points:
- Range Bound: Trading between value area high and value area low on the daily timeframe
- Rejection Point: Clean rejection from value area high triggered current rotation downward
- Breakout Confirmation: Requires strong bullish volume to confirm legitimacy
Sonic Token has clearly established a well-defined trading range on the daily timeframe, with price action bouncing between the value area high and low. After a recent rejection at the top of this range, S-SONIC is now rotating downward, currently testing the lower end of the range.
This behavior is consistent with a market in equilibrium, where no side has definitive control. The daily timeframe provides context for this extended sideways movement, and it appears likely that the asset could remain within this consolidation zone for several more sessions. Unless strong volume emerges, the probability favors continued ranging.
This current phase may evolve into a longer-term accumulation period. These phases are common during consolidation before major directional shifts. If price remains bound within this range and tests both boundaries multiple times, it often signals that larger players are accumulating positions, awaiting a breakout trigger.
However, volume remains the key metric to watch. Any breakout attempt — whether to the upside or downside — must be accompanied by strong, above-average bullish volume to confirm its legitimacy. Without this, even a break above the value area high may lead to a fakeout and a return back into the range.
Until proven otherwise, Sonic Token is not trending but rotating within the value zone. For traders and investors, this phase represents potential accumulation opportunities at range lows and profit-taking opportunities at range highs. But aggressive breakout positioning should be avoided until volume validates the move.
If price eventually breaks out of this range with increasing bullish influxes, it could shift the entire structure toward a new trading regime. But until then, the bias remains neutral to range-bound.
What to Expect in the Coming Price Action
Sonic Token is likely to continue ranging until a breakout is confirmed with high volume. Watch the value area high and low for reactions and confirmation signals before positioning for continuation.

SONIC. USDTNote, that most of the news concerns a number of cryptocurrencies that have grown and are now adjusting their price.
But there are a number of cryptocurrencies for which there is no news.
One of these cryptocurrencies is Sonic.
" No news is good news".
So, it is not too difficult to guess that the first target for Sonic is $0.45.
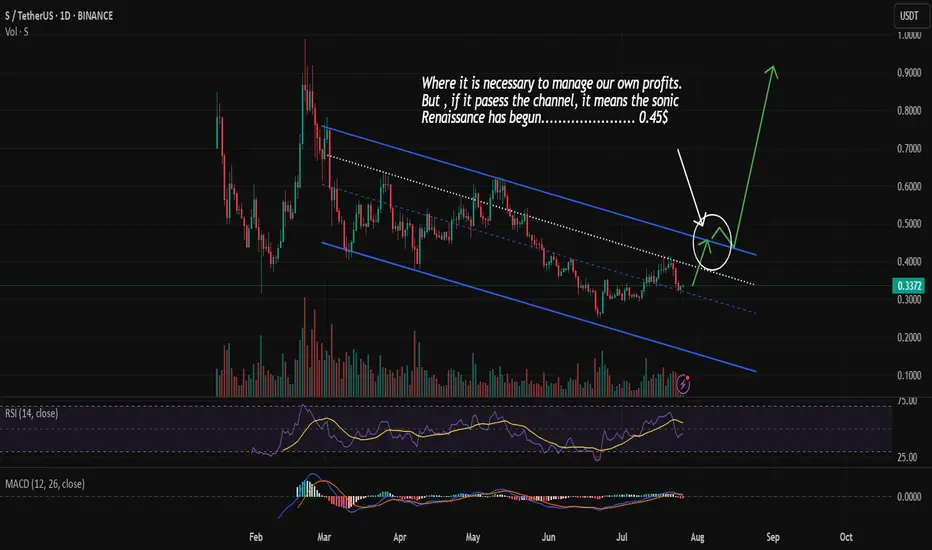
#SPath to $0.60 — Is It Realistic?
Yes, but it depends on a few key factors:
If Sonic breaks and holds above $0.35, the next realistic targets are:
• Short-term: $0.45–$0.52
• Mid-term: $0.60, especially if burn rates stay high and ecosystem growth continues
ALTSEASON send us Higher.

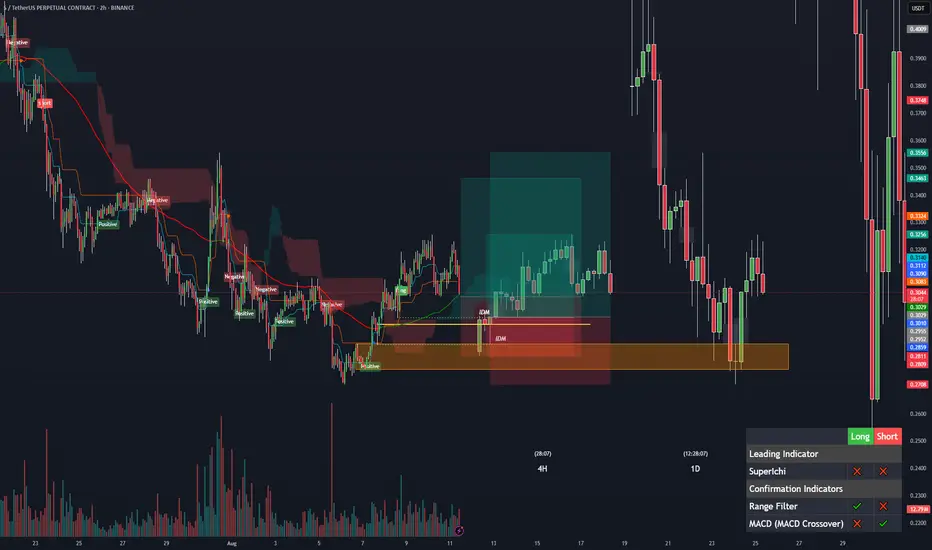
SUSDTlet see what will happen my expactation it is. it is doing w and high. there is idm level and below of it exist fvg and order block when you check daily and weekly you will see the level which i mention
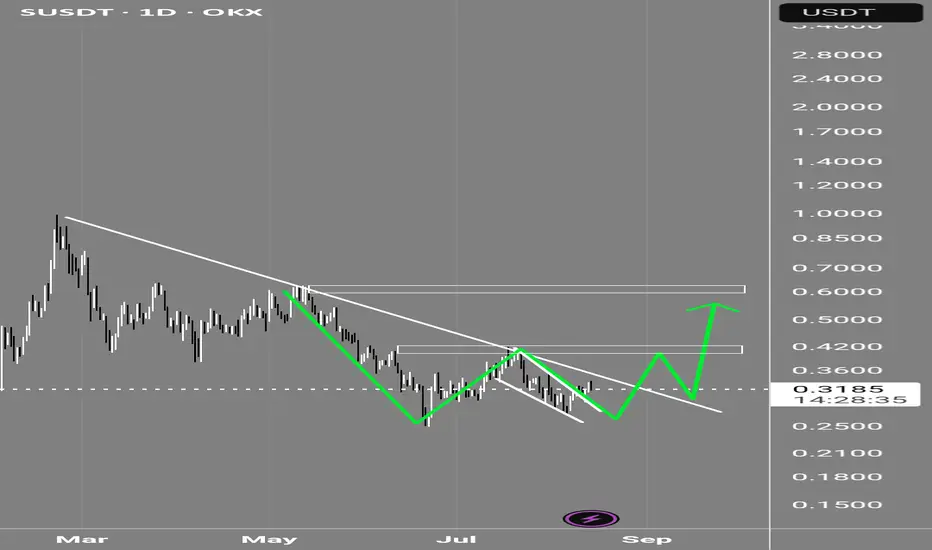
SusdtS formed a W bottom pattern and broke out of the descending wedge. Now slowly moving towards the major trendline.
First targets 0.4 then 0.6
Sonic is creating wedge pattern in higher timeframeOn our current market structure, sonic is creating wedge bullish pattern.
If you check the current price using Fibonacci there's a possibility that it will goes to 0.24 or worst 0.1552 before it will break its current weekly structure.
You can accumulate within the pattern but if you're planning to make position and do long...please avoid that.
Point of interest is 0.24 to make create double bottom on it. If it's break, 0.1552.

what daily chart of Sonic tell us? personal idea: Sonic daily chart shows finding and creating bottom around 0.3 price and price reverse is forming, in this scenario targets of
0.5-0.6
0.8-0.9
1-1.2
are in the horizon of bulls
Good 🙂 luck 👍
Sonic Token Tests Critical Support at Point of Control Sonic Token (S) is holding a major confluence support zone that could act as the foundation for a bullish reversal. A strong bounce here may lead to a retest of the $0.42 swing high.
Sonic Token (S) has corrected into a significant support region, aligning with both the Point of Control (POC) and the 0.618 Fibonacci retracement level. This confluence of technical factors marks a decisive zone where the current bullish structure could either confirm or break down. For bulls to remain in control, price must continue closing daily candles above this support in the coming sessions.
Key Technical Points:
- Key Support Zone: POC and 0.618 Fibonacci retracement form a strong support base
- Market Structure at Risk: Losing support would invalidate the current bullish structure
- Upside Target at $0.42: A reclaim of the swing high confirms continuation with a higher high
This level has become a make-or-break point for Sonic Token’s trend. From a structural perspective, holding this zone would confirm a higher low, preserving the uptrend and increasing the likelihood of a rotation toward the swing high at $0.42. Multiple high time frame indicators now intersect at this support region, making it a vital area for bulls to defend.
The volume profile supports this level’s importance, as historical price action shows significant accumulation and trade density in this range. So far, there are signs that support is holding — but what’s missing is a consistent pattern of daily candle closes above this level. Until that happens, any bounce should be viewed with cautious optimism rather than full confirmation.
If Sonic Token fails to maintain this level, the market risks entering a deeper corrective phase, potentially breaking below the bullish structure that’s been in place since the last major swing low. This would delay any retest of $0.42 and could invite further selling pressure.
On the other hand, if the token manages to hold the confluence zone and reclaim momentum, a move back toward $0.42 would not only retest the previous high but potentially trigger a breakout and continuation of the larger bullish trend. What’s needed now is clear evidence of strength, both in candle structure and volume support.
What to Expect in the Coming Price Action
Sonic Token needs to hold its current support zone on a daily close basis to maintain bullish structure. If it does, a rotation toward $0.42 is likely. A breakdown risks a deeper correction.
SONIC. USDTIt's been a long time the current Sonic( S ), and the Fantom of the past have been moving in neutral.
So,
It's time to make a profit for their investors.
S - SONIC 1DSonic lacks the buying volume to break through its resistances.
The project, after a name change, has become Matic 2.
I expect that we'll soon reach support levels of 30 cents and 25 cents after the pullback is complete. If these supports are broken, the next support levels will be 20 cents and 17 cents.
If the 40 to 43 cent resistance breaks with high volume, there's a possibility of growth to 50 cents. If 50 cents is broken, growth to 63 cents becomes possible.
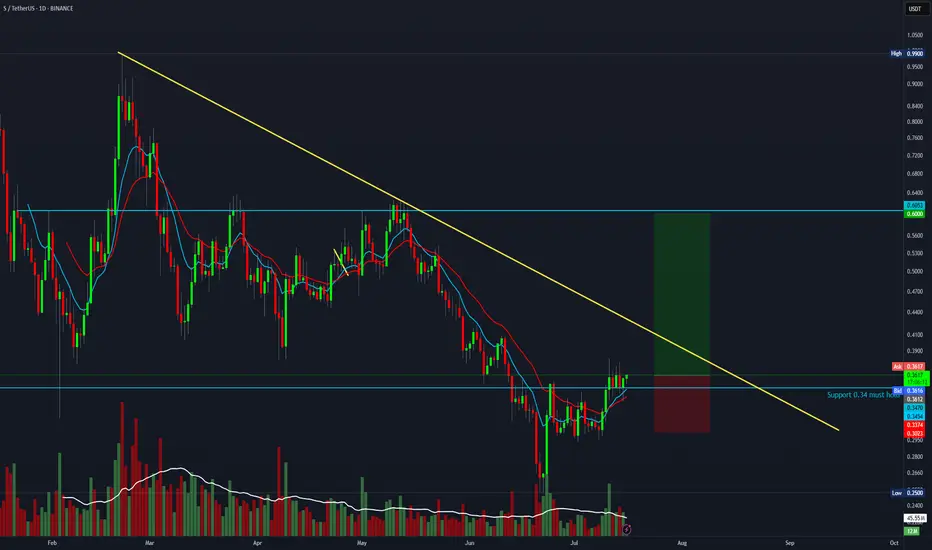
$SUSDT (or S , ex FANTOM): good entry for a long setupCrypto Market Outlook
The overall crypto market is in a clear uptrend.
The money printer is running, and USD dominance is dropping — all signs pointing to a potential continuation of the rally in the coming months.
Unless a black swan event hits, it's not too late to position yourself if you’re still on the sidelines.
⚠️ Always manage your risk with a proper stop loss — altcoins move fast and can reverse just as quickly.
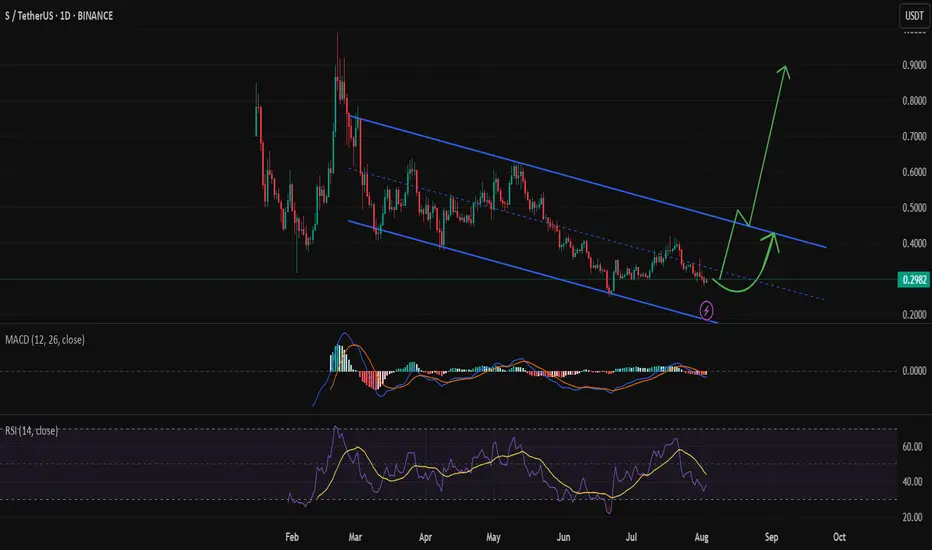
One interesting setup: $S
✅ Relatively new
✅ Didn’t pump too hard
✅ Broke out of its downtrend
✅ Found solid support
The Fib levels offer good targets for take profit zones.
🔍 Ideal entry: within the green box or lower.
Let the pump cool off — it could offer a perfect entry opportunity. Be patient and wait for a good position.
If $S pumps from here without retrace:
→ Jump in with a tight stop loss
→ Or look elsewhere for a better risk/reward setup.
DYOR.
#Crypto #Altcoins #Bitcoin #ETH #Trading #CryptoMarket #TechnicalAnalysis #RiskManagement #DYOR
S (Sonic Network) Bullish daily hammer candle closed above a key daily swing high.
So much liquidity to take above.
Send it.
25-28% daily candle loading
Trade setup with a 4:1 R:R for S (formerly FTM)BTC is likely about to continue its move toward 135K — if you're a bull, this is a solid setup with a 4:1 R:R.
Entry: 0.36
Stop Loss: 0.30
Target: 0.60
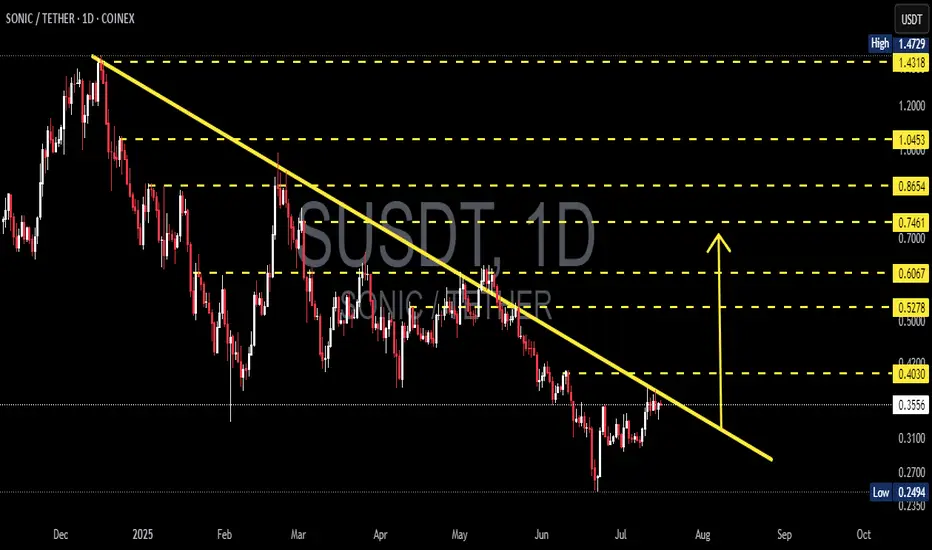
SONIC/USDT Breakout in Progress? Watch This Critical Level Close🧠 Technical Breakdown – Daily Chart (1D, Coinex)
The SONIC/USDT pair is currently exhibiting a textbook descending trendline breakout setup, formed over the past 7+ months. This long-term downtrend has been respected since late November 2024, connecting multiple lower highs and establishing a well-defined bearish structure.
However, recent price action shows a potential trend reversal as the pair consolidates tightly near the apex of the structure, with signs of breakout momentum building.
📐 Pattern Identification:
✅ Falling Wedge / Descending Triangle
✅ Continuous lower highs connected by a descending trendline
✅ Support held above $0.25 (strong demand zone)
✅ Price now testing the upper boundary of the trendline
This is a classic bullish reversal pattern—especially when price breaks out after long-term compression.
🚀 Bullish Scenario:
Should SONIC successfully break and close above the $0.4030 level (trendline + horizontal resistance), it could unlock a wave of bullish momentum. Here are the key upside targets based on Fibonacci retracement from the previous high ($1.4729) to the local low ($0.2494):
🎯 Resistance Level Significance
$0.5278 0.382 Fib – First major target post-breakout
$0.6067 Key confluence level – psychological barrier
$0.7461 0.618 Fib – Bullish continuation zone
$0.8654 High momentum extension
$1.0453 0.786 Fib – Reversal confirmation
$1.4318 Retest of the all-time high
If volume supports the breakout, we could see a sharp move toward these zones.
🧨 Bearish Scenario:
If price fails to break out and gets rejected from the trendline:
It could retrace back toward $0.3100 and $0.2700
A daily close below $0.2494 (previous low) would invalidate the bullish setup, signaling potential continuation of the downtrend
Traders should monitor RSI divergence and volume drop as warning signs
📌 Why This Setup Matters:
This is not just a short-term play. A successful breakout here signals the end of a multi-month downtrend and the potential start of a new macro uptrend. SONIC has been heavily compressed — and the tighter the coil, the bigger the move.
Smart money often enters before the breakout confirmation. Monitor for volume surges, candle structure changes, and key breakout retests.
✅ Summary:
🔄 Trendline breakout imminent
🟢 Watch for breakout confirmation above $0.4030
🔴 Breakdown below $0.2494 invalidates the bullish thesis
🧭 Fibonacci levels offer reliable target zones for profit-taking
This is a critical make-or-break zone for SONIC/USDT. Traders, be ready.
#SONICUSDT #BreakoutSetup #AltcoinAlert #CryptoAnalysis #TrendReversal #TechnicalAnalysis #CryptoTA #Altseason #FibonacciLevels #PriceAction
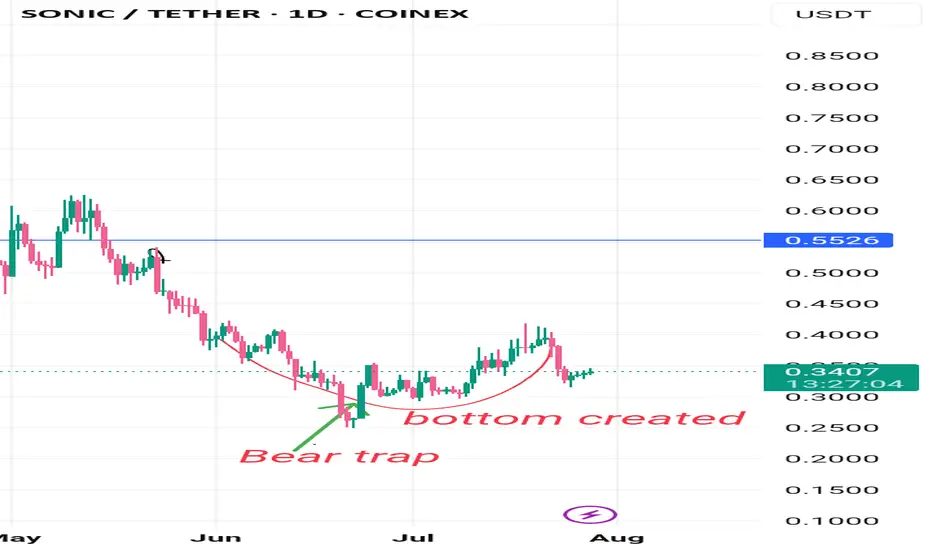
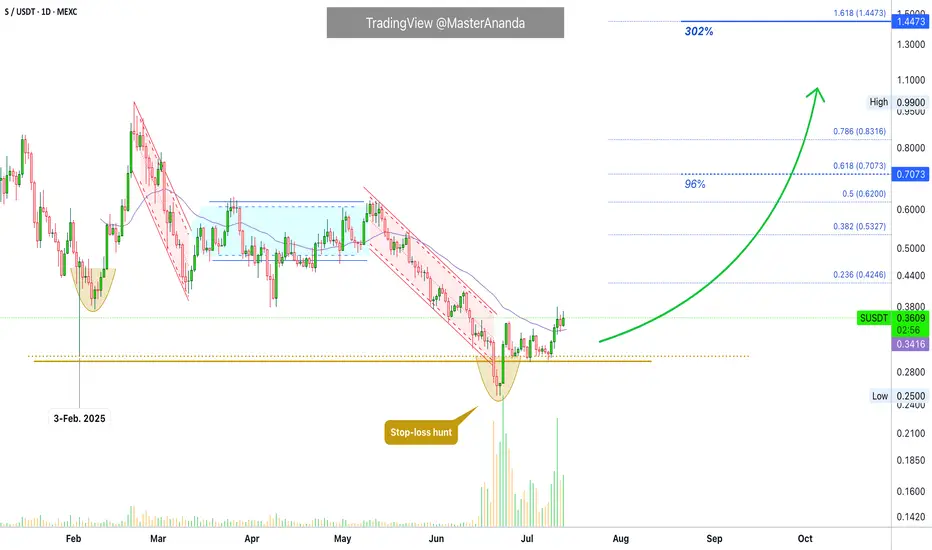
Sonic Moves Next · Expect Massive Growth Coming Weeks —300% EasyTwo pairs-projects will be moving strongly in the coming weeks, Sonic and Usual. This is the chart for SUSDT (Sonic) on the daily timeframe.
Notice how the action is moving back above the 3-February 2025 low (bullish). Notice the stop-loss hunt event recently. This events marks a bottom once it happens. After the event we see growth.
Finally, notice the very strong increase in trading volume. SUSDT is trading safely above EMA34. All these signals confirm strong growth in the coming weeks starting now basically, it is already happening as the action has been bullish since 22-June.
I am always giving you the best charts, the best timing in the Universe with the best results. I will continue to share daily but you need to follow. You can get notifications each time I publish and in this way you can be up to date with the Cryptocurrency market, the altcoins are moving ahead and this only happens once every four years. There are bullish waves in-between the bear market and transition years, but nothing like 2025.
The 300% on the chart is an easy target. This target can be achieved short-term maximum mid-term. Imagine the 100 years old index funds, it would take you 30 years to earn 300%. Oh my god! Leave that to your grandparents this is not for us.
My heart goes out to all the people still buying index funds related to the stock market. It is like using floppy disk still in the year 2025, we have USB sticks and smartphones, floppy disk were discontinued long ago. Buying SPX index funds and such stocks instead of Crypto is like buying CD-roms to store music, we streaming now not even MP3.
The future of finance is Crypto. Altcoins is the way to go. If you are already in this market you are ahead of the pack. You will look like a genius 10, 15, 20 years from now. For you and for me it is normal but actually, only the minority knows well enough the game. There is plenty of room left available for growth. Crypto is young.
Namaste.
Sonic ($S) Price Analysis: Key Levels to WatchThe markings on your chart outline a trading plan based on key price levels:
Resistance (Potential Sell Zones): The red lines at approximately $0.3520 and $0.3660 are acting as price ceilings. For the price to go up, it needs to break through these levels.
Support (Potential Buy Zones): The green boxes represent demand zones where buyers might be interested. The first is around $0.3370 - $0.3400, and the second, stronger zone is near $0.3270 - $0.3300.
The price is currently consolidating between the first support and resistance levels. A decisive break above or below this range will likely indicate the next short-term trend.

Sonic pull back - opportunity comingSonic - are we going for a deep pullback?!
If so...
We have confluence for a bonce - MA 200 (4h), Fib 0.618, Diagonal trendline.
I think Sonic cold respond nicely in the area 0.324-0.332 and after that move on for higher target (0.4).

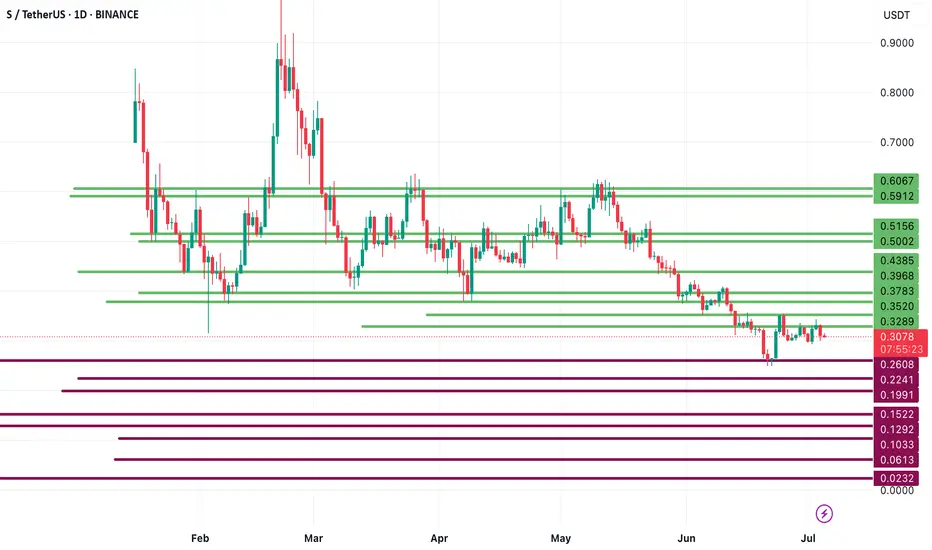
Sonic (SUSDT) Technical Analysis – Key Resistance in Play!🚨 Sonic (SUSDT) Technical Analysis – Key Resistance in Play!
Sonic (SUSDT) is currently struggling to break through the key resistance zone at 0.3512, showing signs of weakness from buyers.
📉 If the downtrend continues, major support levels are clearly highlighted on the chart. Watch closely for 0.1522 and then 0.1292 as critical zones where price could react.
🔥 On the flip side, if Sonic manages to break and hold above 0.3520, we could see a bullish move toward 0.3783 and 0.3968 as the next targets.
🎯 This is a crucial level where the next major move could begin. Stay alert — great opportunities often start with smart analysis.
👉 If you like clean charts, real analysis, and no hype — follow me for daily updates on altcoins like Sonic, ETH, BTC, and more!
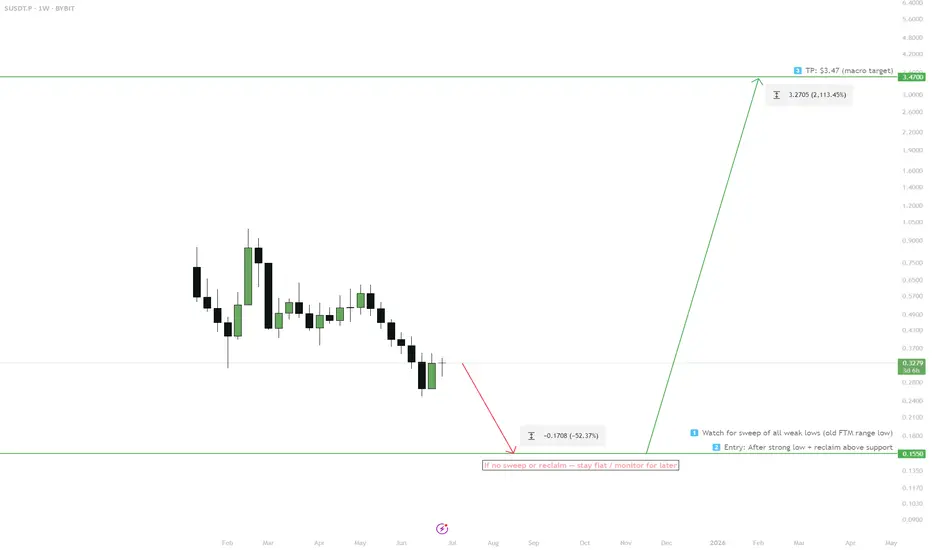
Sonic (FTM) — RR Sweep & Accumulation Setup1. Wait for full sweep of weak lows (target $0.15)
2. Enter long only after reclaim above support zone
3. Macro target: $3.47+
4. If no strong low or reclaim, stay flat