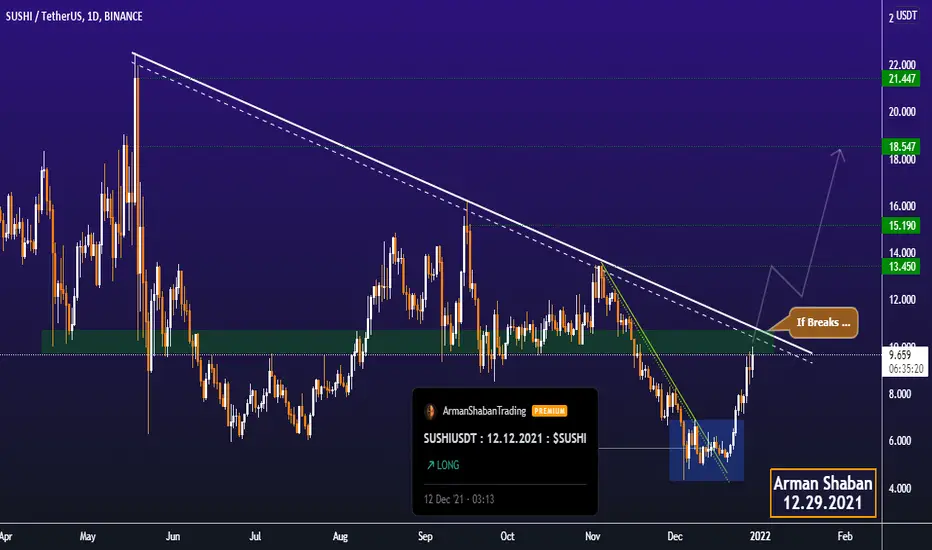
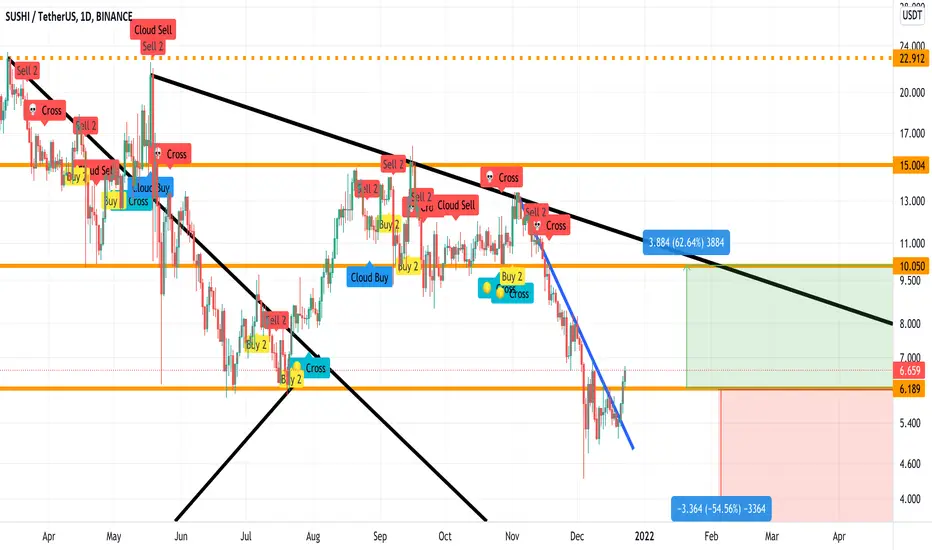
SUSHI SWAP Daily TA : 12.29.21 : $SUSHIAs we can see, if the price can break this important range of X-Point resistance, we can expect growth to the levels indicated on the chart.
Follow our other analysis & Feel free to ask any questions you have, we are here to help.
⚠️ This Analysis will be updated ...
👤 Arman Shaban : @ArmanShabanTrading
📅 29.DEC.2021
⚠️(DYOR)
❤️ If you apperciate my work , Please like and comment , It Keeps me motivated to do better ❤️
SUSHIUSDT.P trade ideas
SUSHI/USDT ChartHi, I try to post often so if you could follow, like and comment your thoughts it would mean a lot.
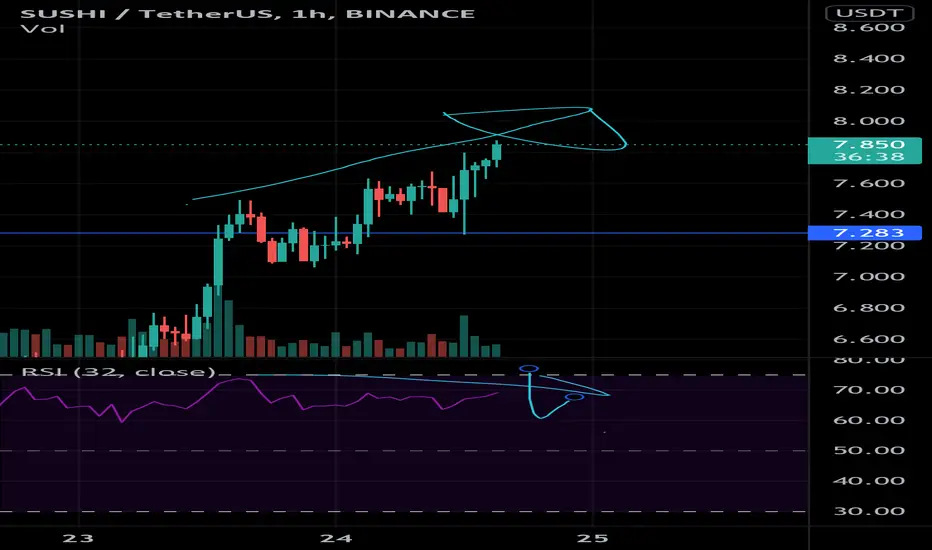
SUSHI had a good run in the past week, and after having a run from the 5.10$ range to 10$ today I think that the coin will have a correction now.
In the 4H chart we can see a bearish divergence showing up recently so we have a very nice short set-up in the short/mid term. I can't speak about the long term but in the short term I'm preety sure that we will have a correction. A good target would be around the 8.50$ support.
Another bearish factor for altcoins is the fact that BTC just brokedown the 48K zone and the market isn't showing that strenght and confirmation that we need to resume the BTC uptrend. Thanks for your attention and good luck on your trades.

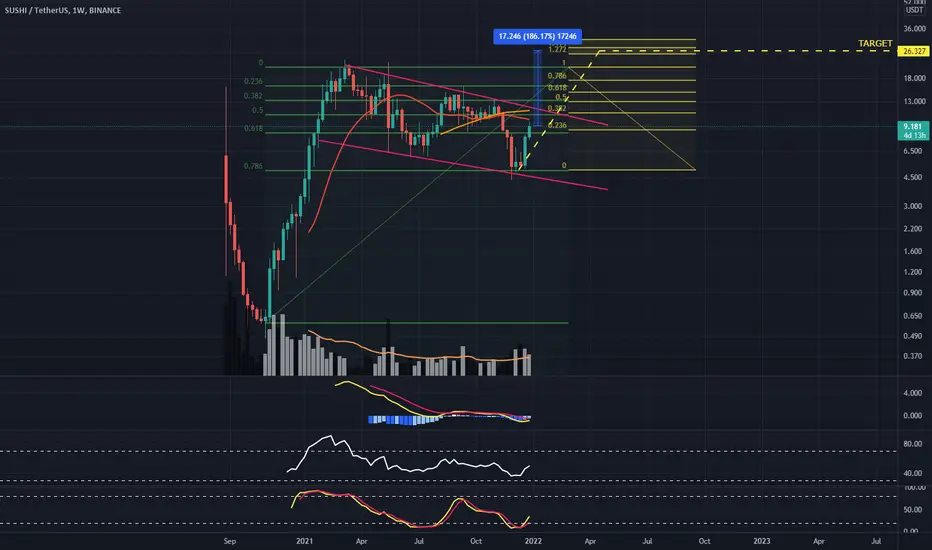
SUSHIUSD 1W - Huge BullFlag Target $26Hi everyone,
Thank you for considering reading my idea.
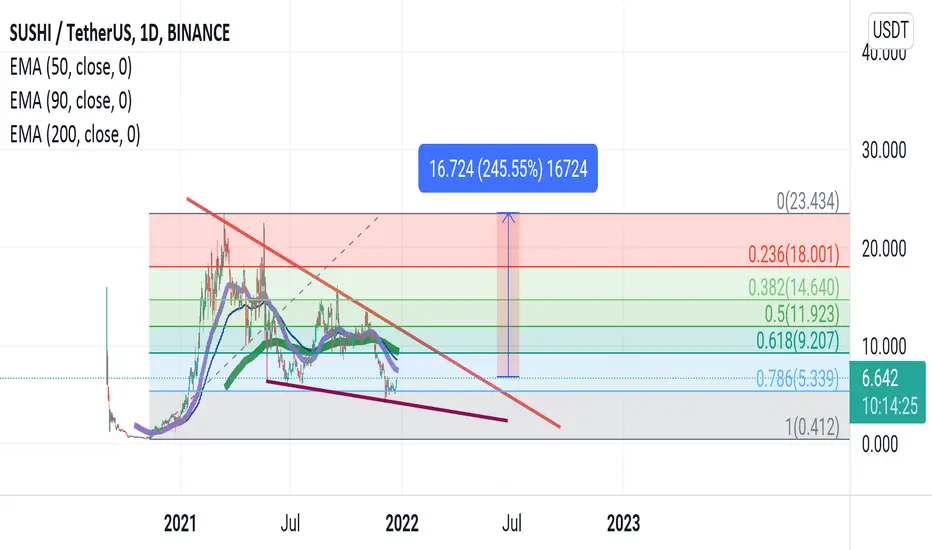
SUSHI bounced off the 0.786 level of the Green Fibonacci Retracement around $5. Right now, the price is at $9. That's almost 100% increase in just 2 weeks. The bull flag formed has a target of around $26. It's around 1.272 and 1.414 level of the Yellow Fibonacci Retracement. There is a potential 186% increase from the current price. NFA
Like this idea and follow me for more analysis like this. TAYOR.
Cheers,
Juvs
$69 is coming in the 1st wavecrab harmonic pattern:
X=$271
AB=0.61 XA
BC=0.38 AB
*1.6 BC=$69.2
0.78 XA=$69.5
0.88 XA=$131.5
2 BC=$133.6
2.24 BC=$201
*2.6 BC=$387
1.13 XA=$622
1.27 XA=$1538
*3.6 BC=$2163
1.41 XA=$3705
4.23 BC=$6265
*1.6 XA=$13943

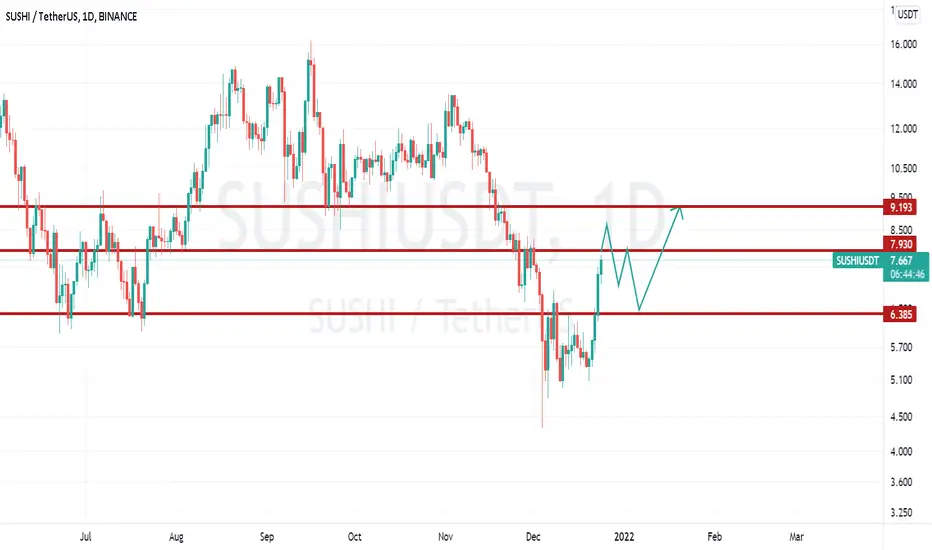
SushiUSDT Prediction Here is two scenario for Sushi...
If any candle close under 4.5 the scenarios will be failed.
SUSHI mooningHey Trader,
please see my current idea on the Sushi Crypto, where my count suggest that we are done with wave 1 and 2 which would now lead to a wave 3 extension to either 1.618 (which is equal to target 1) or to 2.618 (which is equal to target 2).
Let me know your thought.
RT

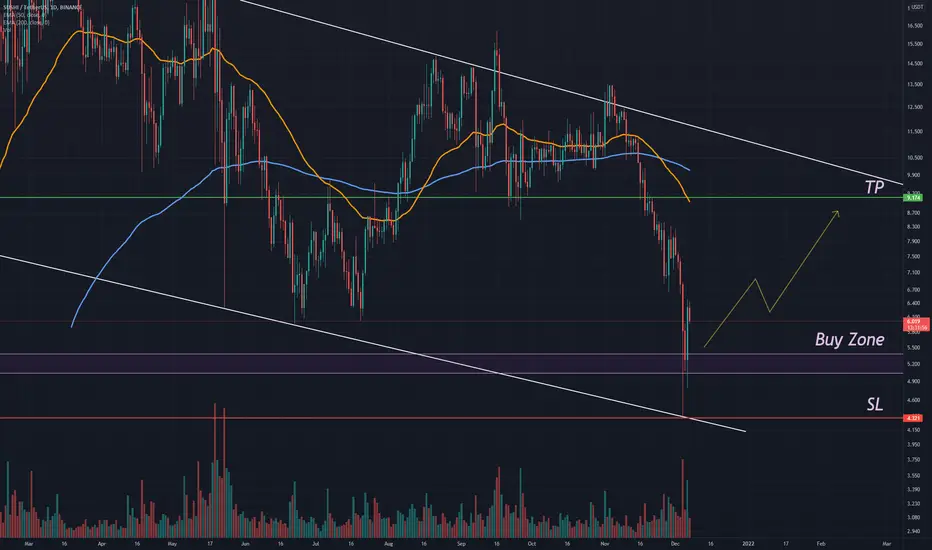
SushiSwap (SUSHI) Buy ZoneSushiSwap (SUSHI) Buy Zone
--------------------
BIAS
Mid-Term : Bullish
SUSHI formed bull flag in 1 day time frame and currently retesting below it and we might see a further drop toward the marked support level which is around $5.3
--------------------
$SUSHI/USDT SPOT SETUP
Entry Price : 5.05 - 5.4
TP 1 : 5.63
TP 2 : 5.98
TP 3 : 6.8
TP 4 : 7.184
TP 5 : 8.07
TP 6 : 8.482
TP 7 : 9.174
Stop Loss : 4.321
*Stop Loss - SUSHI daily close below 4.321
*Maximum 5% of Portfolio.
*Whenever TP 2 hits, Move stop loss to entry.
--------------------
Sushi - #sushi $sushidear friends
this is possible for this coin.
I think it'll have a pullback and then go up.
check for lower prices to enter.
SUSHI/USDT: BullishHello everyone
This analysis is my personal opinion ,not a financial advice ,so do your own research.
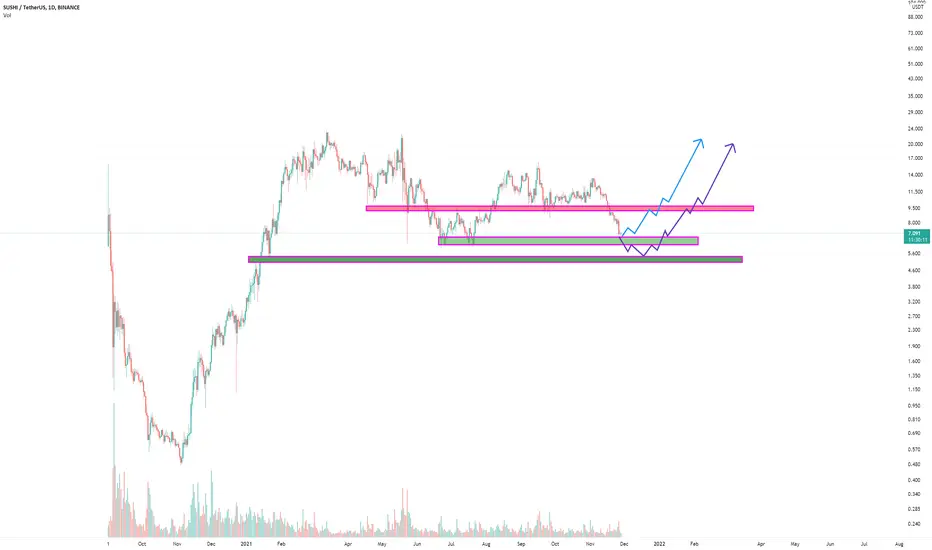
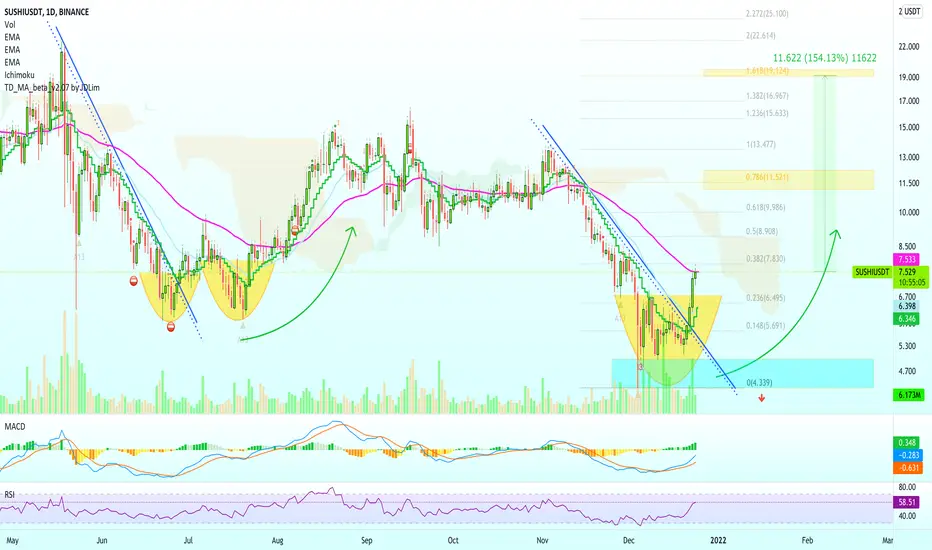
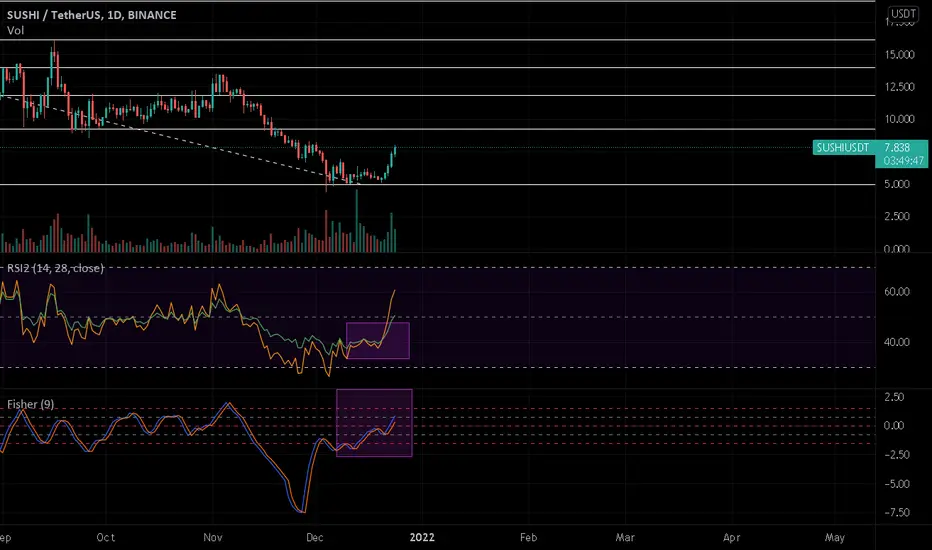
Sushi Can Grow 150%+ vs TetherWe can see the classic "cup pattern" on the SUSHIUSDT chart, this can signal that the trend is about to reverse.
As you can see on the left side, each time this bottom pattern shows up prices tend to grow.
We also have a broken downtrend as we all as increasing volume and bullish indicators (strong RSI).
All these signals support higher prices.
Note: There can be a retrace before higher prices as it happens with the cup & handle pattern.
The targets are marked on the chart.
This is not financial advice.
Namaste.
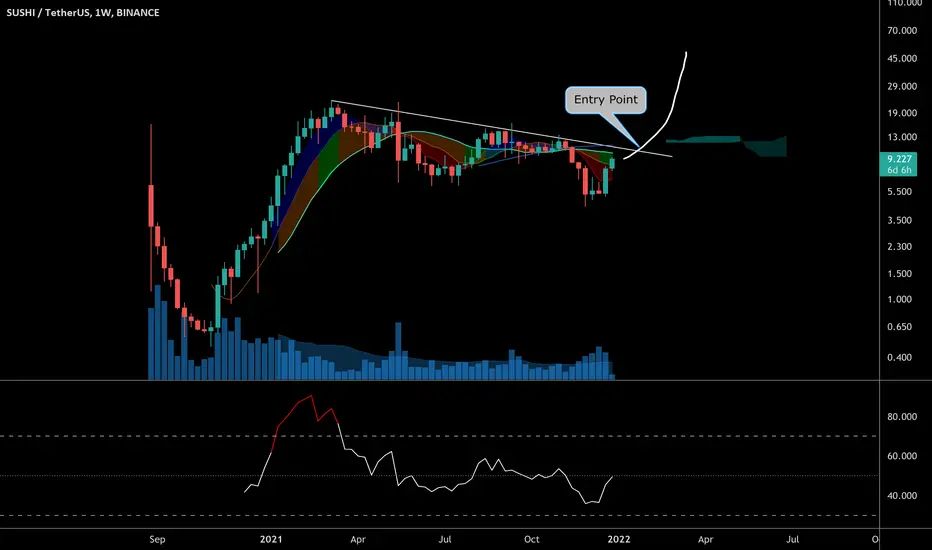
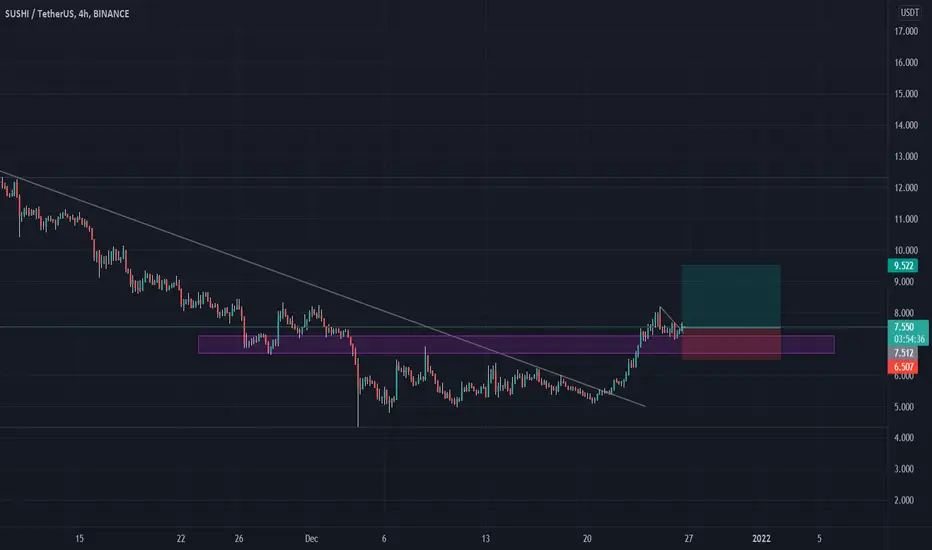
SUSHIUSDT is creating a pennantSUSHIUSDT is creating a pennant below the weekly resistance.
We need to watch two key levels and wait for the breakout, According to Plancton's strategy (check our Academy ), we can set a nice order
–––––
Follow the Shrimp 🦐
Keep in mind.
🟣 Purple structure -> Monthly structure.
🔴 Red structure -> Weekly structure.
🔵 Blue structure -> Daily structure.
🟡 Yellow structure -> 4h structure.
⚫️ Black structure -> <4h structure.

sushi/usdt breakout sushi/usdt broke out the downward trendline
and taking retest at the support level
#dyor
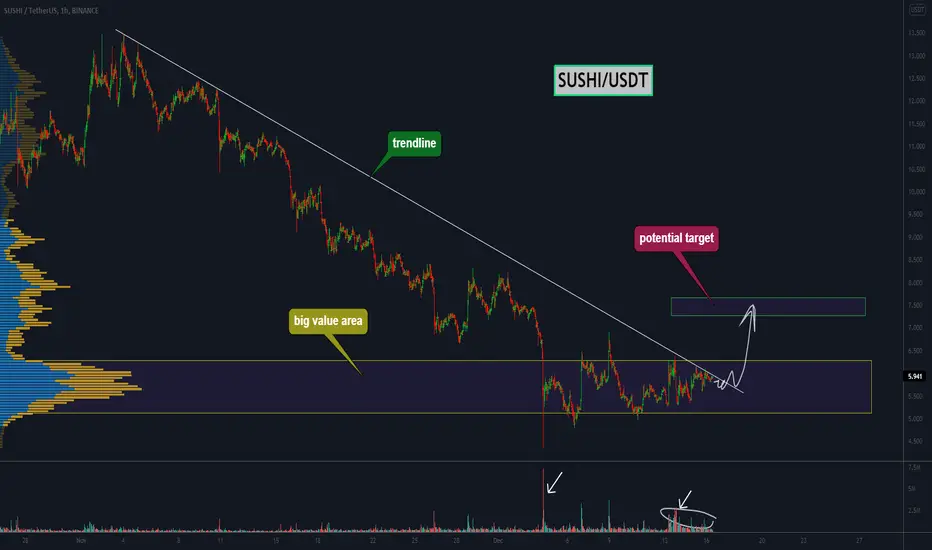
SUSHI - is going to break this trendline 👀SUSHI has been in a local downtrend for a long time. We now see the price in a trading range between $5 and $6.3 levels. It is very likely that big players are accumulating their positions here. The large volume at the bottom signals this as well. A breakdown of the trend line could be a good buying opportunity. In case the big value area is broken, there could be a trend reversal.
Write in the comments all your questions and instruments analysis of which you want to see.
Friends, push the like button, write a comment, and share with your mates - that would be the best THANK YOU.
P.S. I personally will open entry if the price will show it according to my strategy.
Always make your analysis before a trade.
Sushi Looking sexy. Need to pop and hold above 8.30 but it’s above all of my indicator reisatnce which is really somthing that could cause a HUgE run in the next few weeks and months fo sushi. Somehinf hige is on the horizon
SUSHISWAP COIN NEXT PUMP, (SUSHI) PRICE PREDICTION 2022SUSHI price prediction using a simple price action strategy. Fundamentals analysis and technical analysis included. Can SUSHI price recover and see more bounce before any more dump?

#SUSHIUSDT Prise actionWe took first reaction from Order Block.
I will rebuy from FTR zone. I'm bullish bias
This is not investment advice

SUSHİ/USDTSUSHI broke the long-time downtrend and made a double bottom formation in the daily period and entered the uptrend
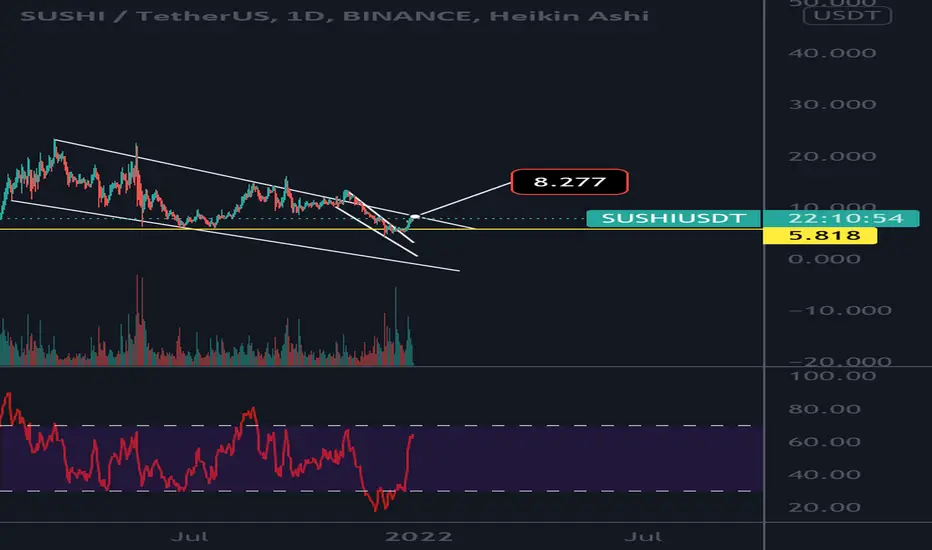
It Will Be Historical Move Of SushiSwap (SUSHI)Hi friends, hope you are well and welcome to the new update on SushiSwap (SUSHI).
broke out with bullish divergence:
On a daily time frame, the priceline of Sushi has broken out down channel with bullish divergence.
Big bullish Gartley:
On a weekly time frame, SUSHI has formed a bullish Gartley pattern.
In order to trade this pattern the targets can be as below:
Buy between: $8.04 to $5.96
Sell between: $11.16 to $14.45
Stop loss:
Stop loss can be set below the maximum extent of buying zone which is $5.96
Possible profit and loss ratio:
As per the above targets, this trade has a profit possibility of up to 142% and a loss possibility is 26%.
Big falling wedge:
On the same weekly time frame the priceline is also rising from the support of a big falling wedge pattern. The big bullish reversal Gartley move can become a big coz of breaking out this falling wedge and in case of breakout, wedge Sushi can start a massive rally for the long term.
Note: Above idea is for educational purpose only. It is advised to diversify and strictly follow the stop loss, and don't get stuck with the trade.
SushiusdtHi. correction touched 0.78 fibo and now we see price is going up. Price is very attractive for buy. Resistance and target are in chart( fibo levels). Good luck.
SUSHIUSDT ANALYSISAs you can see Engineering Robo is currently bearish on SUSHI
If you are interested in putting 1,000$ into SUSHI
Buy 20% at support
Buy 30% when candle open / close above downtrend line
Buy 50% when Robo turns bullish
Take some profit at resistance! (>50% increase from local support)
Be cautious!
If the candle open / closes below the support, No need to hold SUSHI
we can easily expect a 50% DROP In this case
Sell if candle open / close below support (even with some loss)
SUSHI possible setupSUSHI is looking to flip the resistance, making it a support.
If 12/21 EMA are doing a bullish crossover and we are bouncing from the new support, then i'm longing it
GL to all

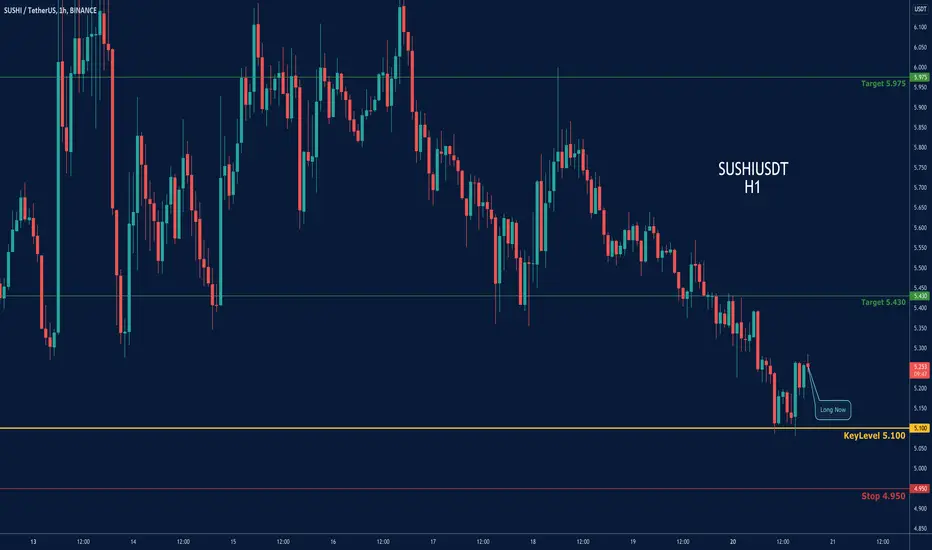
SUSHIUSDT-LONGThere is a long position in SUSHIUSDT SUSHI
SUSHIUSDT SUSHI
🔵Long Now or set on Key Level 5.100
🟢Target 1 5.430
🟢Target 2 5.975
❌Stop loss 4.950
#K_Level