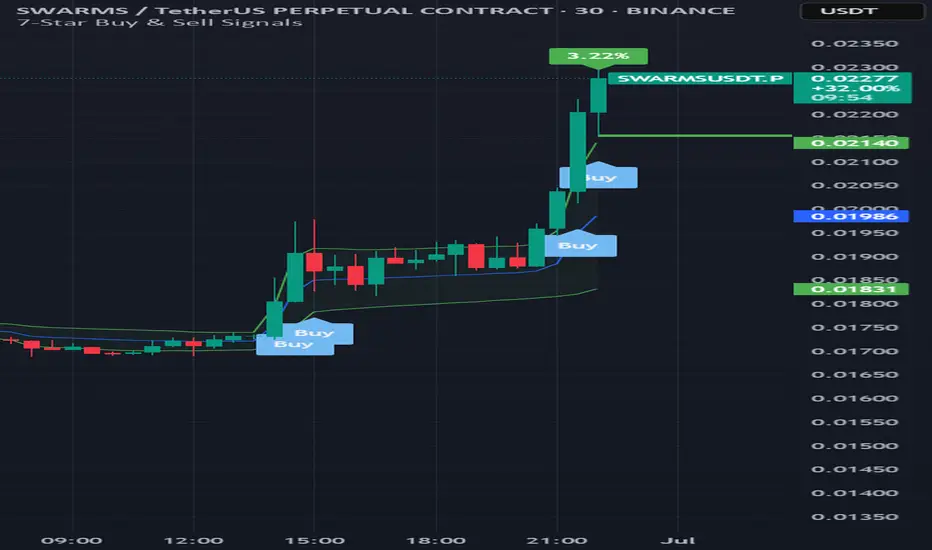
SWARM superbAfter our Fbuy swarm is riding the up ladder with good volume
Next stop area would be in 0.026-0.028 area. As it's ATL coin, there's surprise ahead
For indicator access, you can contact me
Have a great day
Remember DYOR
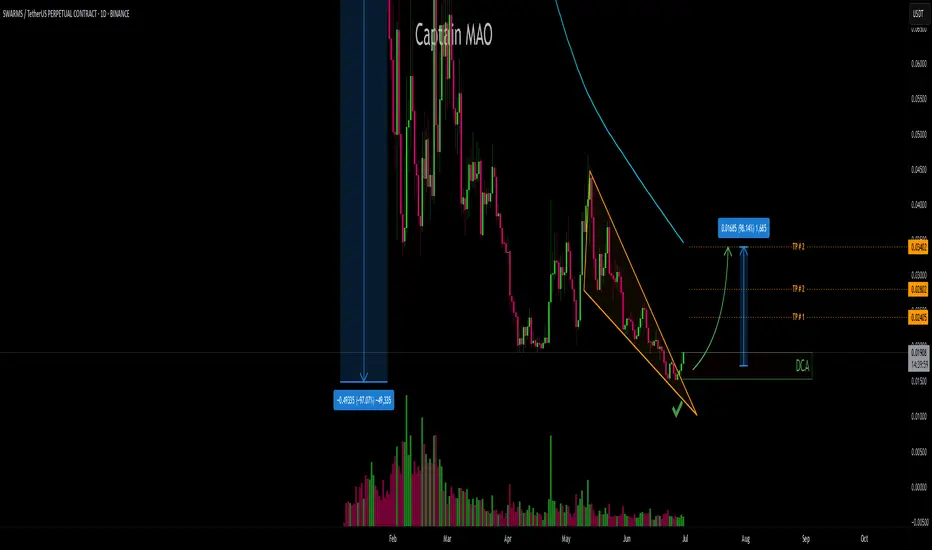
SWARMS/USDT buy setupAfter a prolonged downtrend since its listing on Binance, SWARM/USDT has dropped over 97%, forming a long accumulation base. The price has now broken out of the daily trendline, signaling a potential trend reversal.
Entry Zone (DCA): Green Box
Breakout Confirmation: Daily trendline breakout
Potent
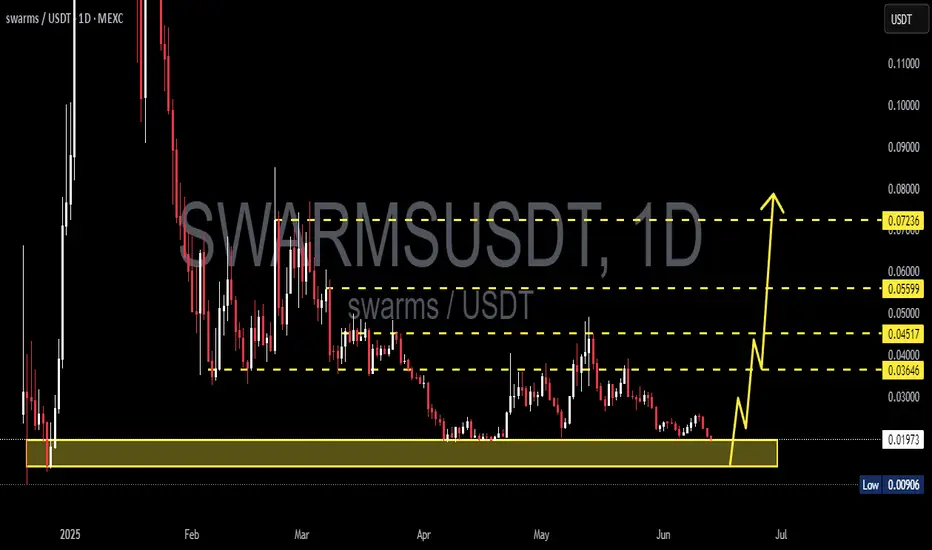
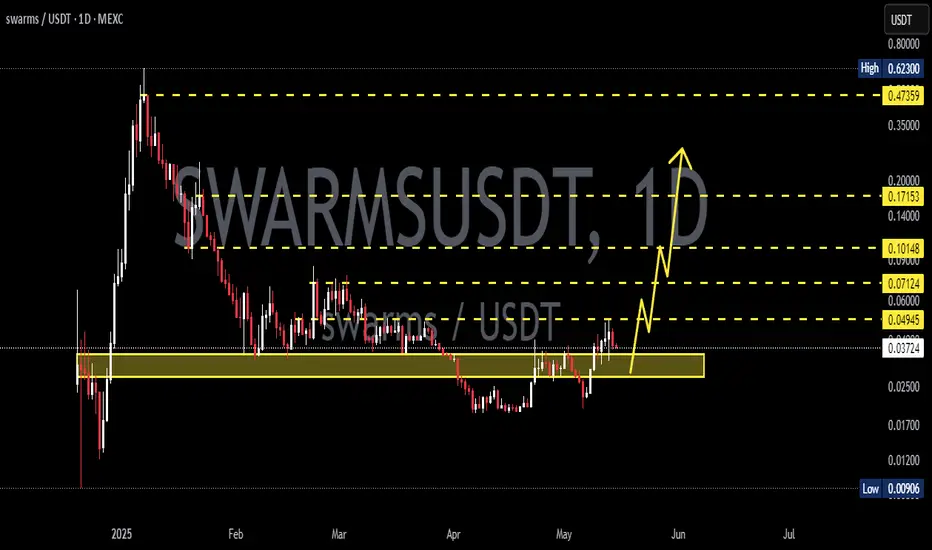
SWARMSUSDT 1D AnalysisSWARMS ~ 1D Analysis
#SWARMS , This trade is very high risk. Buy here with a short term target of at least 20%+ from this lowest support.
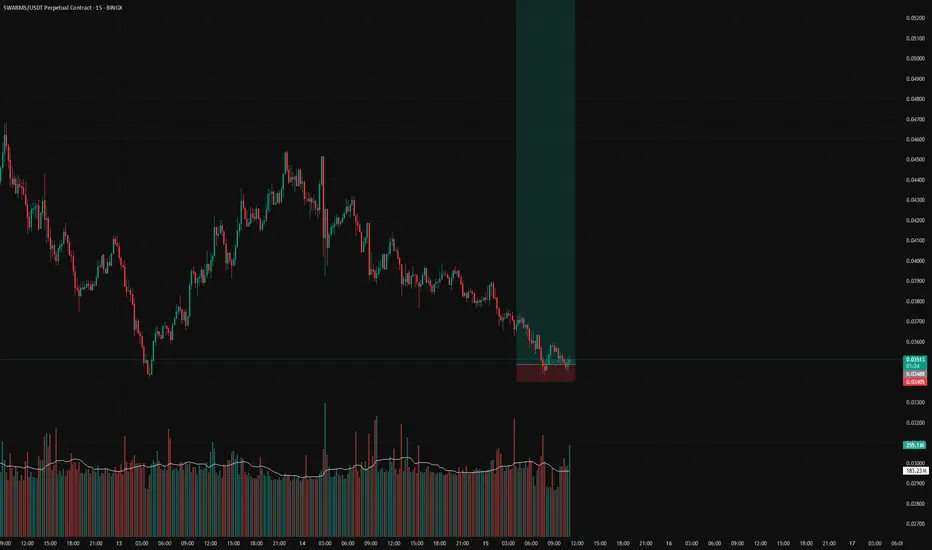
buying swarms ai herebuying swarms here it could get stopped out and dip to 0.03174 but will just buy again, coin i down 90% so i think is a good time to buy of course NFA. do your on TA
SWARMSUSDT 1D Analysis SWARMS ~ 1D Analysis
#SWARMS This trade is very high risk
Buy from here if you still have confidence in this coin with a short term target of at least 15%+ from here.
SWARMS Is Bulish (12H)A key flip zone on the SWARMS chart has been reclaimed.
The trigger line has been broken, and we have a bullish CH (Change of Character) on the chart.
As long as the flip zone holds, price may move toward the identified targets.
A daily candle close below the invalidation level would invalidate t

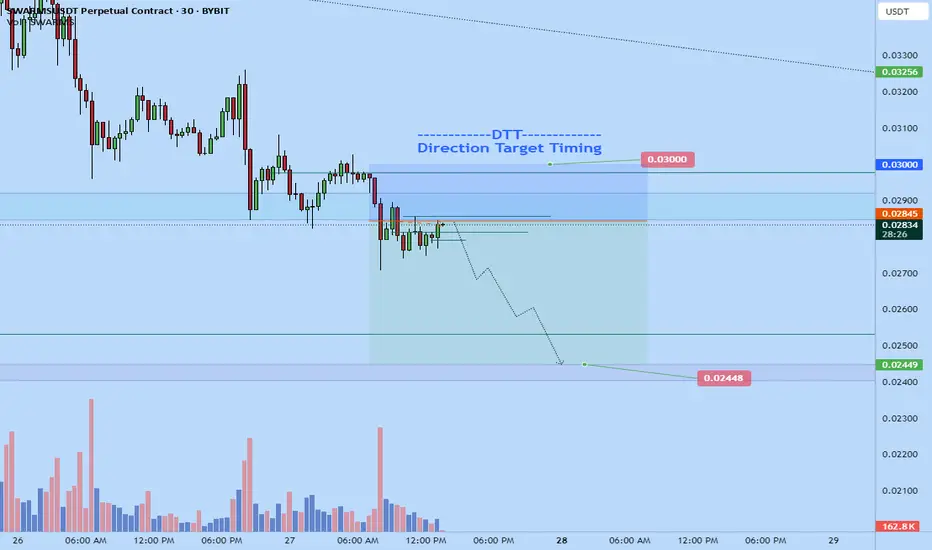
Swarms further dump to $0.02448 Swarmsusdt short
Target: $0.02448
Stop: $0.03 or higher
Roughly 2.5R
Expecting further drop as we approach weekly closure.

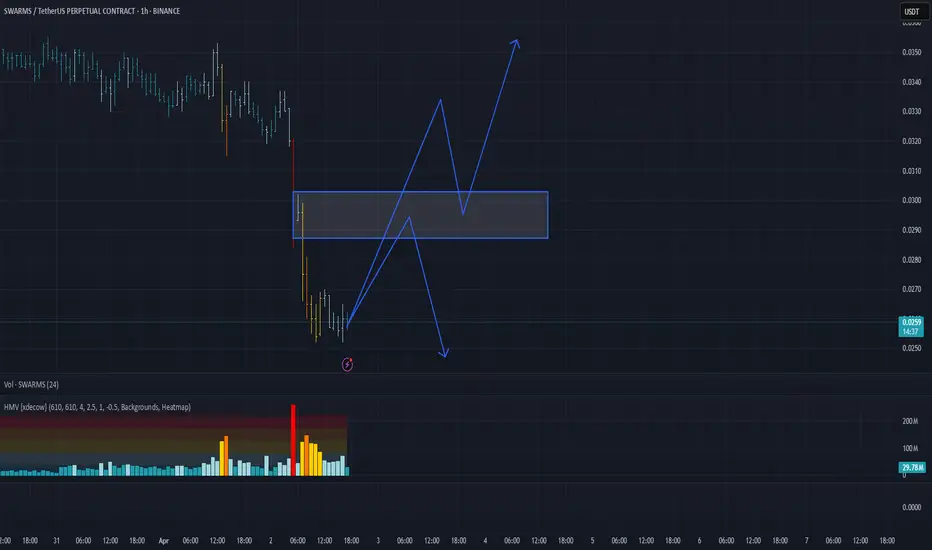
SWARMS/USDT Analysis: Continued DeclineThis asset continues its downward movement. A strong volume cluster has now formed, allowing for position building and participation in further movement.
We consider the $0.0287–$0.0302 zone as a short opportunity upon its retest, provided there is a seller reaction.
If no reaction occurs and pr
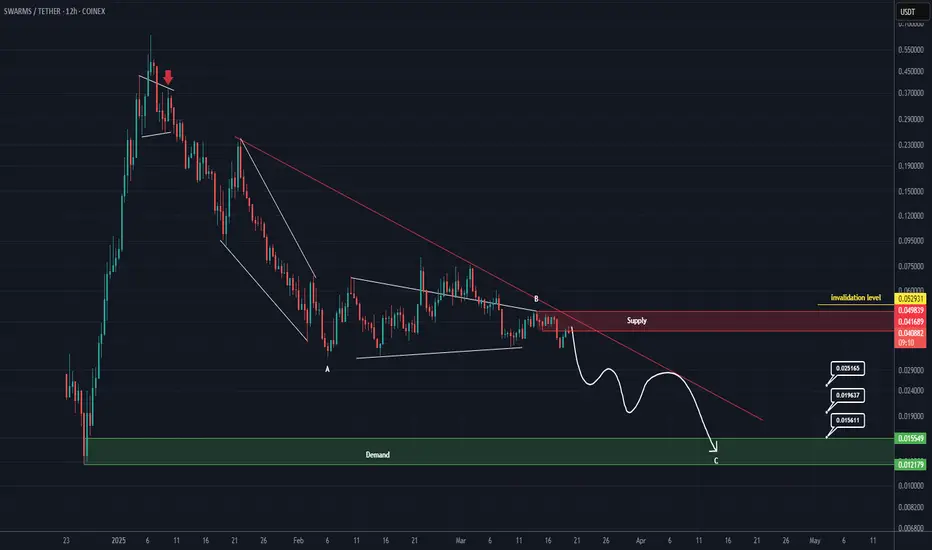
Short opportunity for SWARMS (8H)The correction of SWARM has started from the point where we placed the red arrow on the chart.
It appears that wave B has just completed, and the price is currently forming a pivot for another drop.
We expect to enter wave C soon, with the price moving towards the targets.
The closure of a daily
See all ideas
Summarizing what the indicators are suggesting.
Oscillators
Neutral
SellBuy
Strong sellStrong buy
Strong sellSellNeutralBuyStrong buy
Oscillators
Neutral
SellBuy
Strong sellStrong buy
Strong sellSellNeutralBuyStrong buy
Summary
Neutral
SellBuy
Strong sellStrong buy
Strong sellSellNeutralBuyStrong buy
Summary
Neutral
SellBuy
Strong sellStrong buy
Strong sellSellNeutralBuyStrong buy
Summary
Neutral
SellBuy
Strong sellStrong buy
Strong sellSellNeutralBuyStrong buy
Moving Averages
Neutral
SellBuy
Strong sellStrong buy
Strong sellSellNeutralBuyStrong buy
Moving Averages
Neutral
SellBuy
Strong sellStrong buy
Strong sellSellNeutralBuyStrong buy