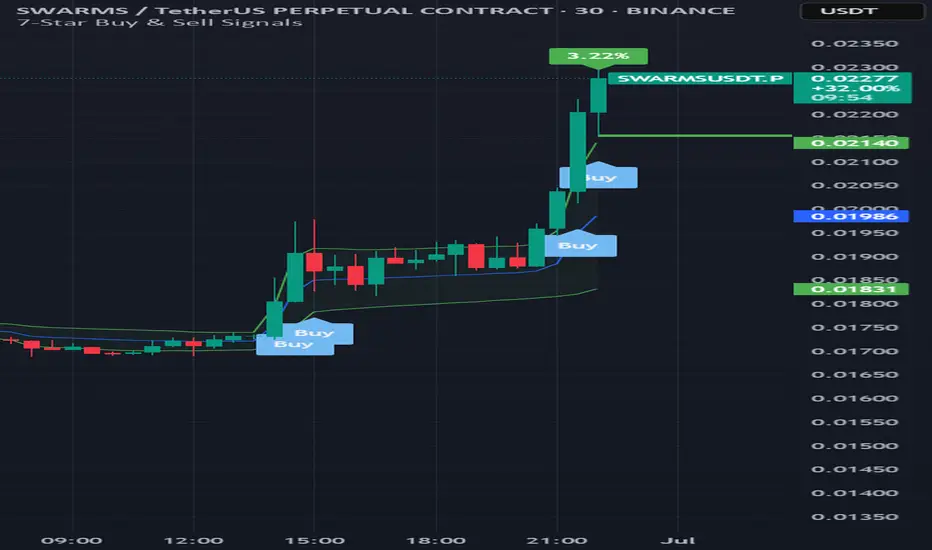
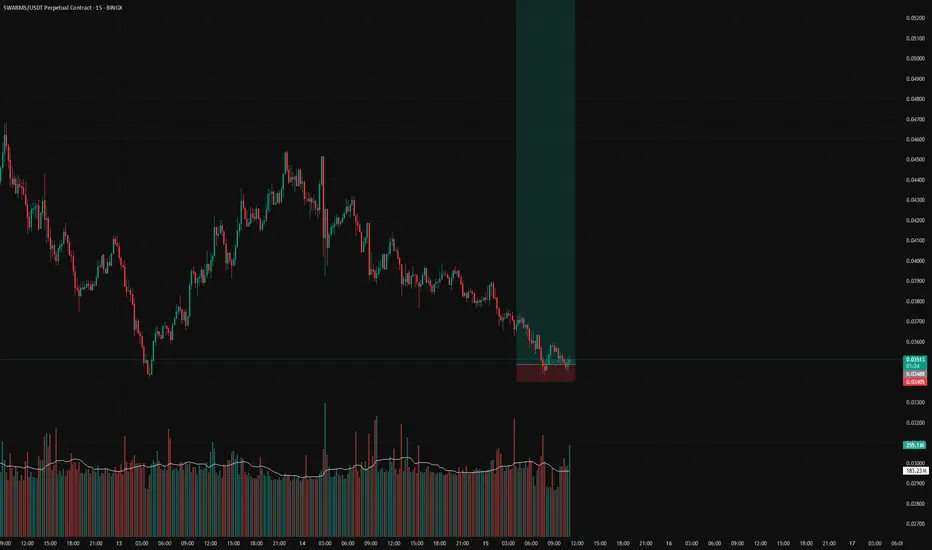
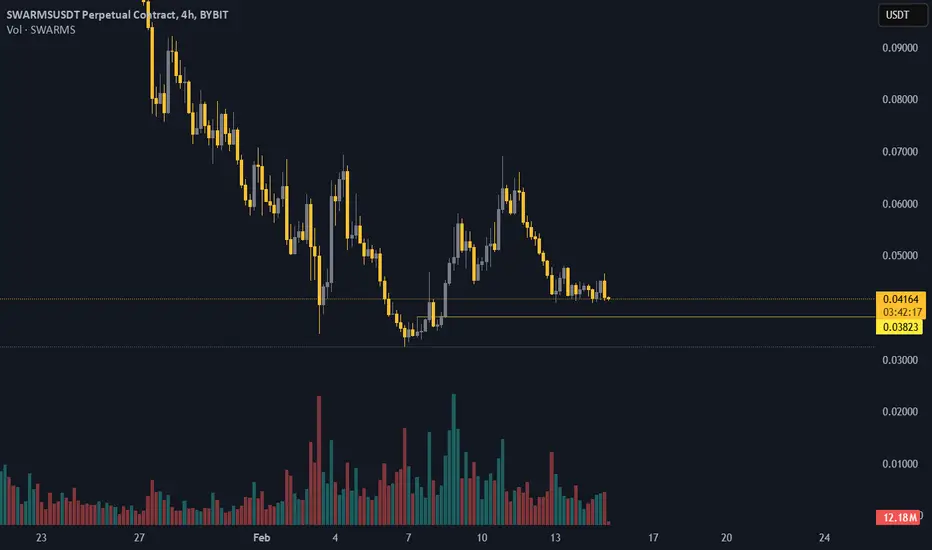
SWARM superbAfter our Fbuy swarm is riding the up ladder with good volume
Next stop area would be in 0.026-0.028 area. As it's ATL coin, there's surprise ahead
For indicator access, you can contact me
Have a great day
Remember DYOR
SWARMSUSDT.P trade ideas
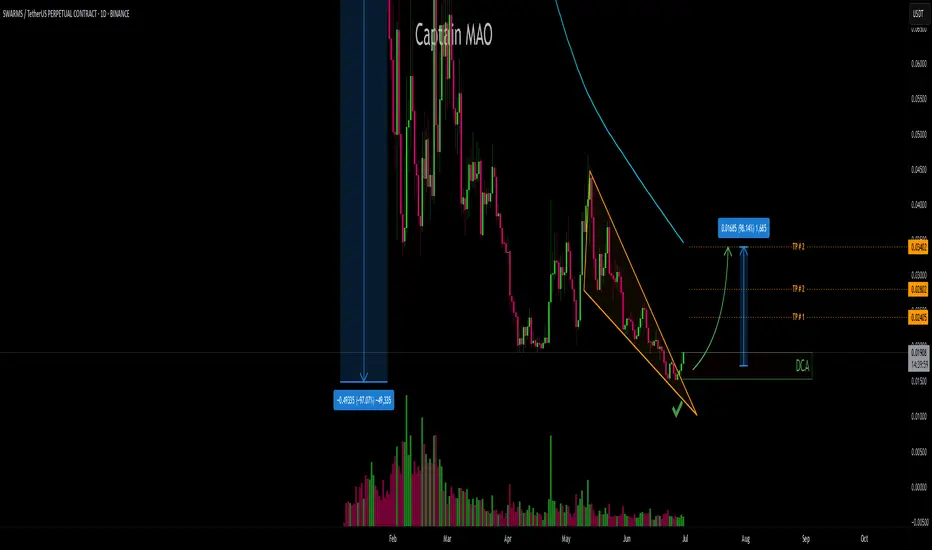
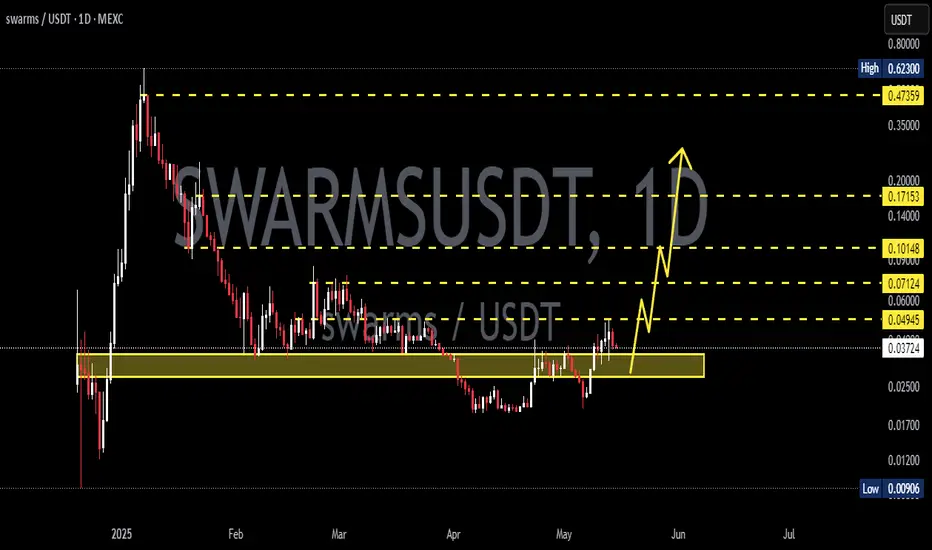
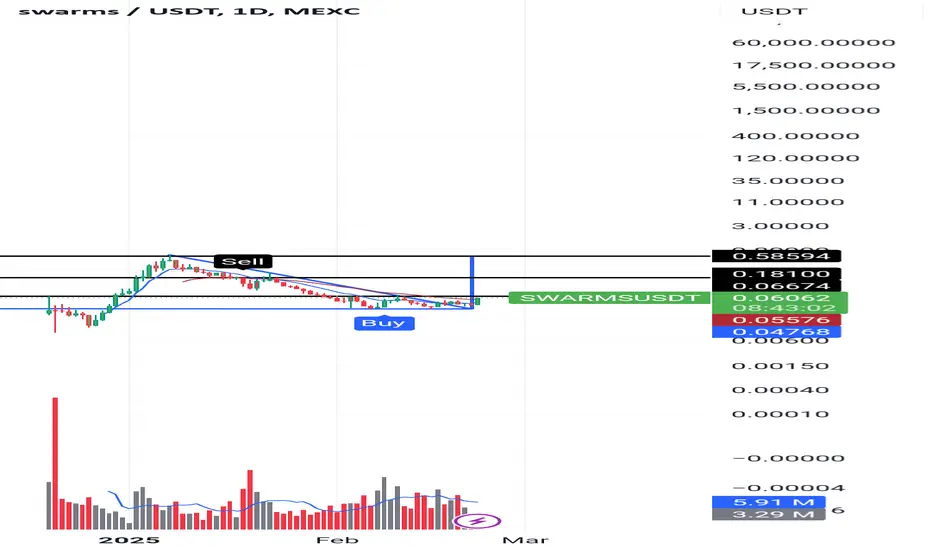
SWARMS/USDT buy setupAfter a prolonged downtrend since its listing on Binance, SWARM/USDT has dropped over 97%, forming a long accumulation base. The price has now broken out of the daily trendline, signaling a potential trend reversal.
Entry Zone (DCA): Green Box
Breakout Confirmation: Daily trendline breakout
Potential Move: Preparing for a strong upward leg after deep correction
ideal for strategic DCA entries.
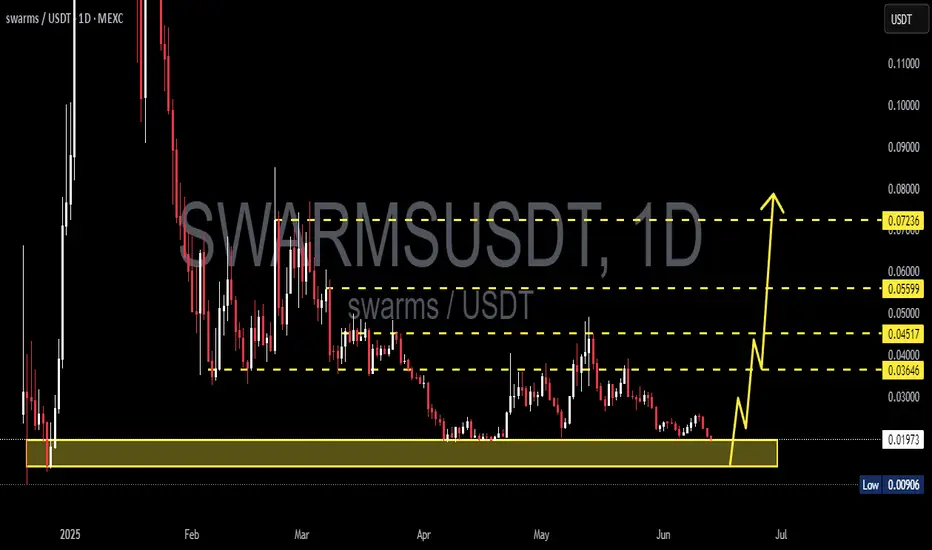
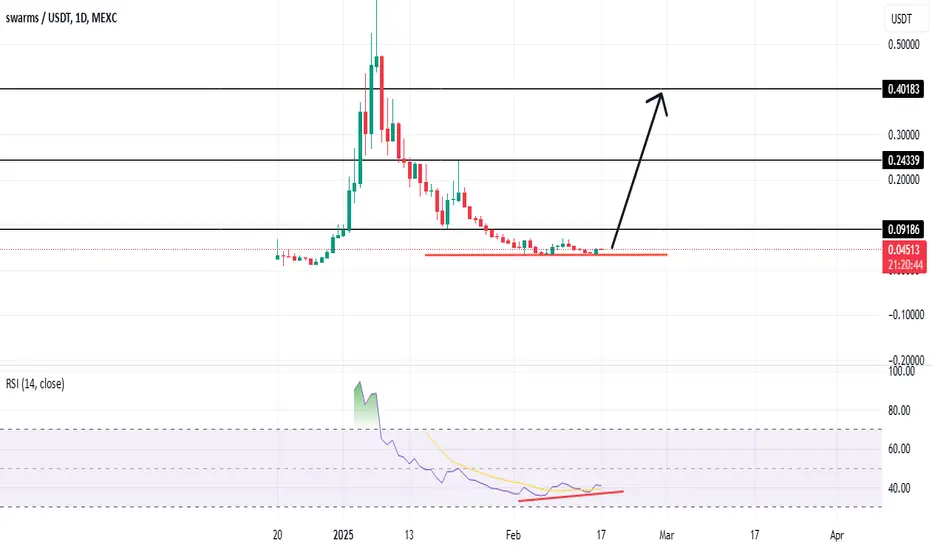
SWARMSUSDT 1D AnalysisSWARMS ~ 1D Analysis
#SWARMS , This trade is very high risk. Buy here with a short term target of at least 20%+ from this lowest support.
buying swarms ai herebuying swarms here it could get stopped out and dip to 0.03174 but will just buy again, coin i down 90% so i think is a good time to buy of course NFA. do your on TA
SWARMSUSDT 1D Analysis SWARMS ~ 1D Analysis
#SWARMS This trade is very high risk
Buy from here if you still have confidence in this coin with a short term target of at least 15%+ from here.
SWARMS Is Bulish (12H)A key flip zone on the SWARMS chart has been reclaimed.
The trigger line has been broken, and we have a bullish CH (Change of Character) on the chart.
As long as the flip zone holds, price may move toward the identified targets.
A daily candle close below the invalidation level would invalidate this analysis
Do not enter the position without capital management and stop setting
Comment if you have any questions
thank you

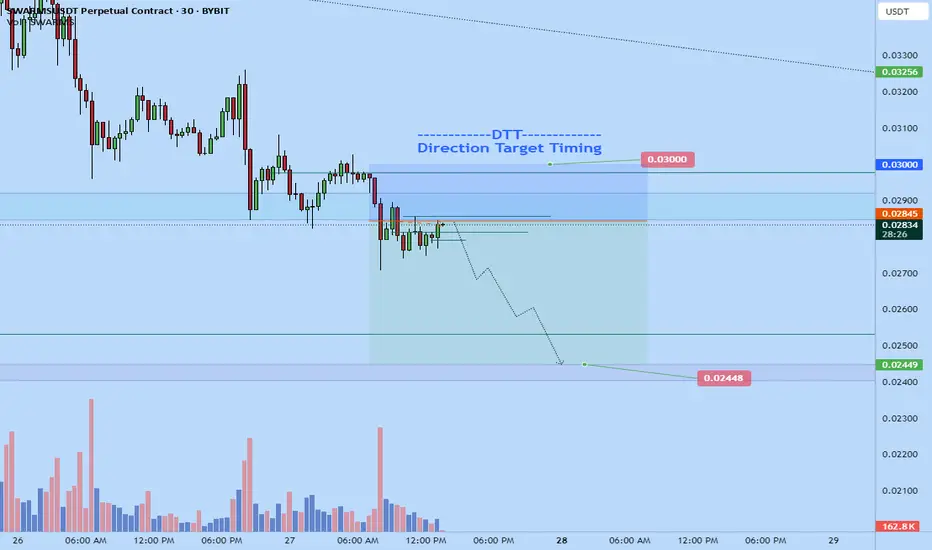
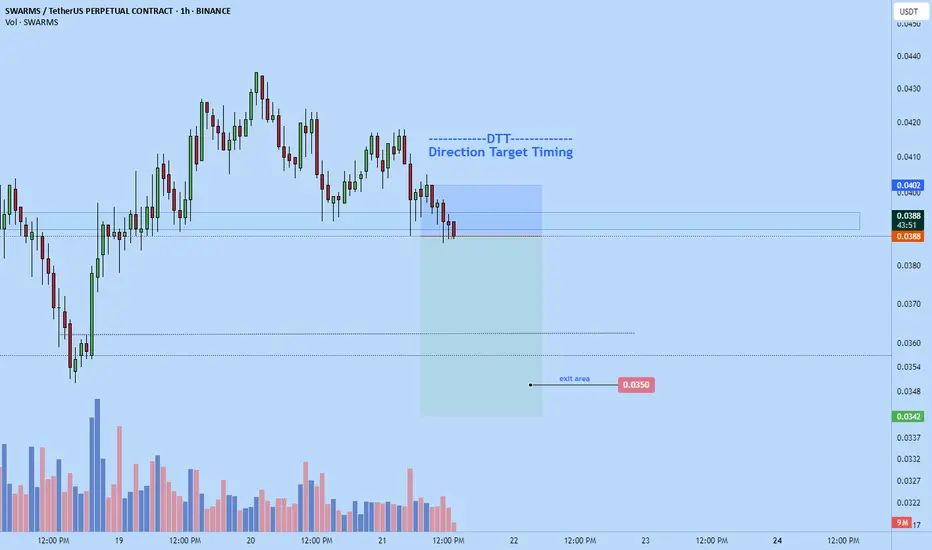
Swarms further dump to $0.02448 Swarmsusdt short
Target: $0.02448
Stop: $0.03 or higher
Roughly 2.5R
Expecting further drop as we approach weekly closure.

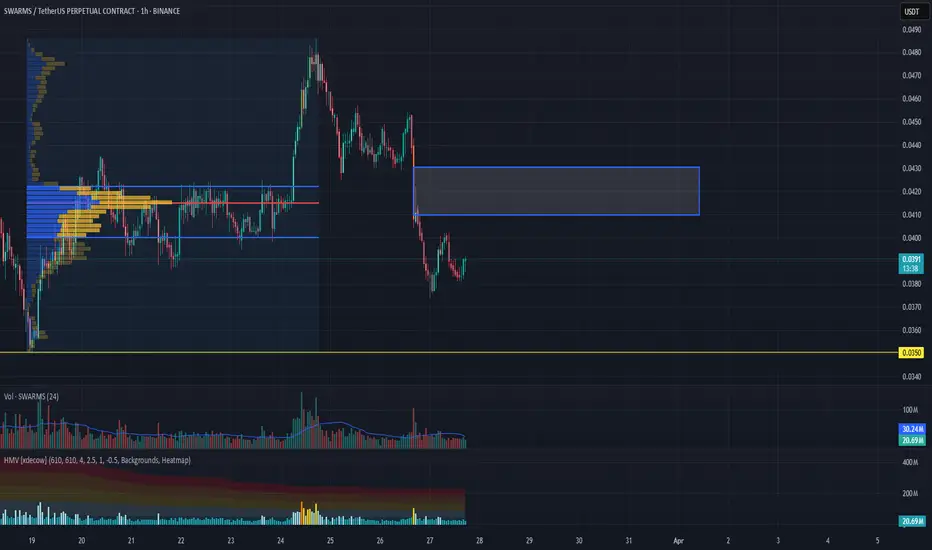
SWARMS/USDT Analysis: Continued DeclineThis asset continues its downward movement. A strong volume cluster has now formed, allowing for position building and participation in further movement.
We consider the $0.0287–$0.0302 zone as a short opportunity upon its retest, provided there is a seller reaction.
If no reaction occurs and price consolidates above this zone, we will view it as a mirror support level.
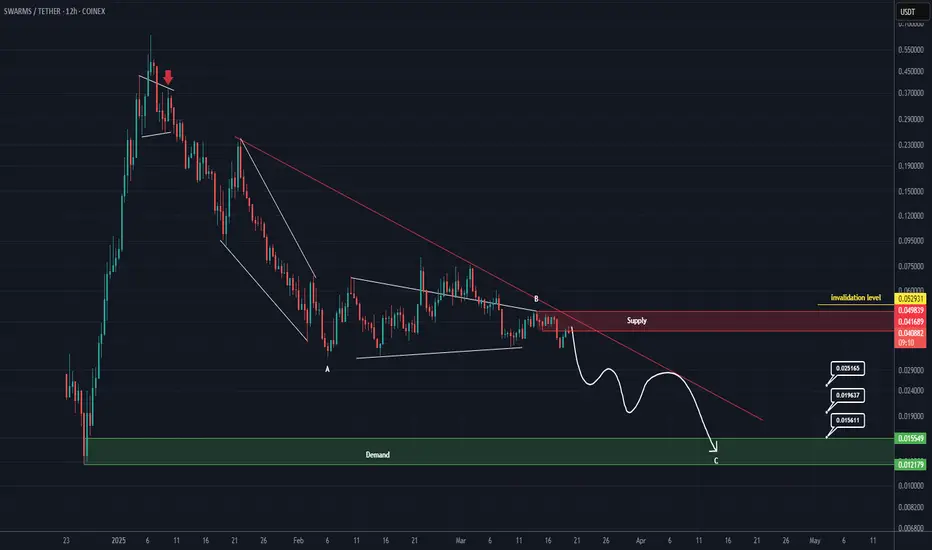
Short opportunity for SWARMS (8H)The correction of SWARM has started from the point where we placed the red arrow on the chart.
It appears that wave B has just completed, and the price is currently forming a pivot for another drop.
We expect to enter wave C soon, with the price moving towards the targets.
The closure of a daily candle above the invalidation level will invalidate this analysis.
For risk management, please don't forget stop loss and capital management
When we reach the first target, save some profit and then change the stop to entry
Comment if you have any questions
Thank You
SWARMS/USDT Analysis. Short Toward the Current LowFor this asset, we are considering a speculative short position. We have tested a key volume zone but observed no bullish reaction. Instead, selling pressure has increased.
If the $0.41-$0.43 zone is retested and a reaction occurs, we will enter a short position with a target at the $0.35 level.
Swarms short to $0.035shorted $swarms just now. Smaller size than usual - 0.15% on hyrotrader - not because its lower quality or anything , just to manage risk.
Already have enough positions but this looks like a clean drop.
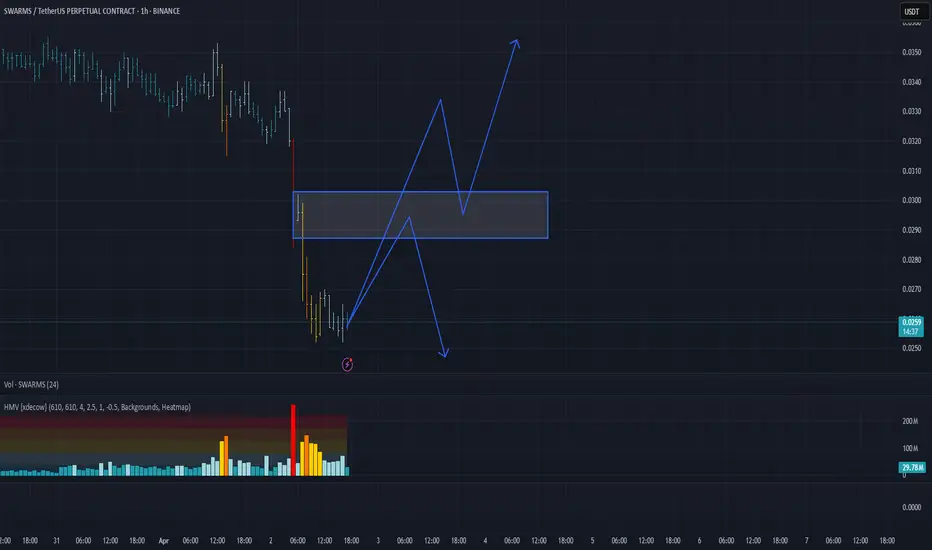
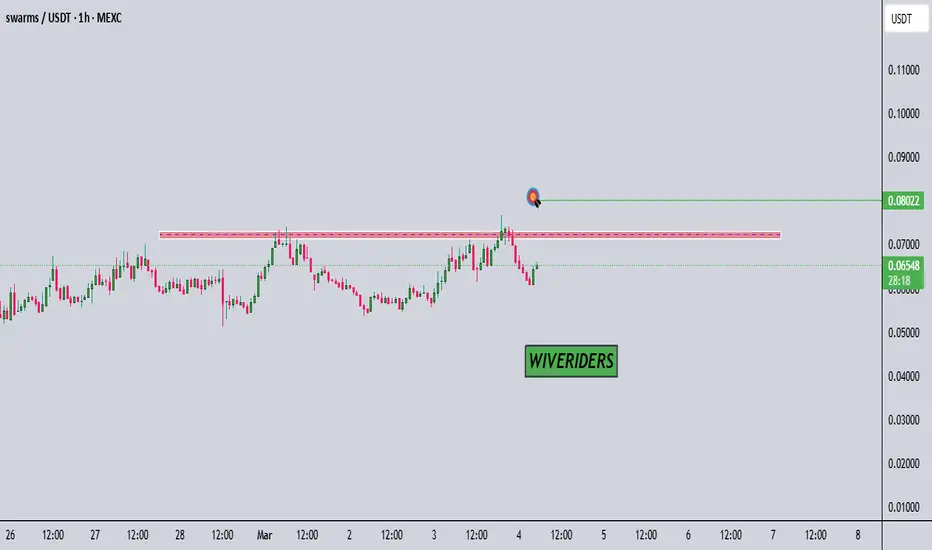
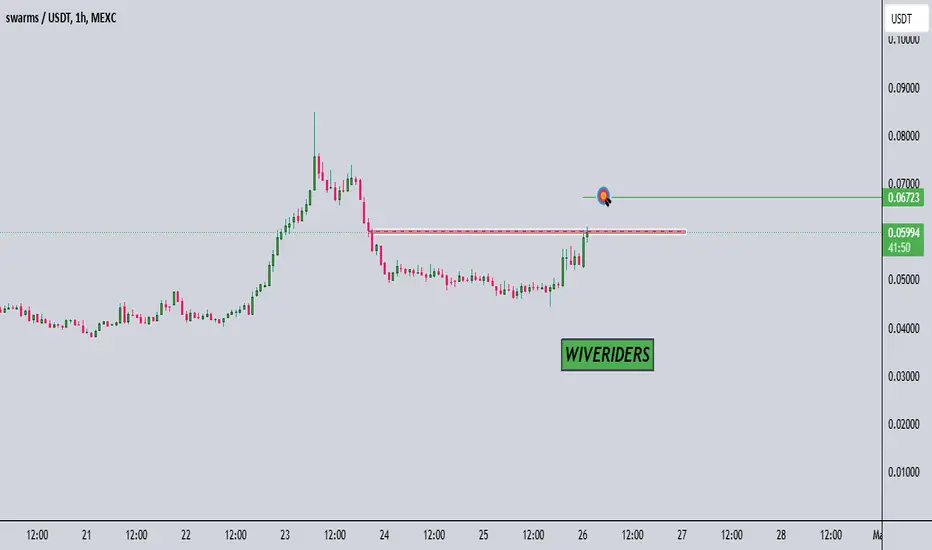
break the red resistance zoneAnalysis 🚨
$SWARMS attempted to break the red resistance zone 🔴 but failed due to strong selling pressure at this level.
📌 What’s next?
We need a breakout above this resistance for bullish momentum.
If it successfully breaks, the first target will be the green line level 🟩.
Watch this red resistance carefully, as it’s a key level for the next move!
🎯 Target (If Breakout Happens):
✅ Green line level
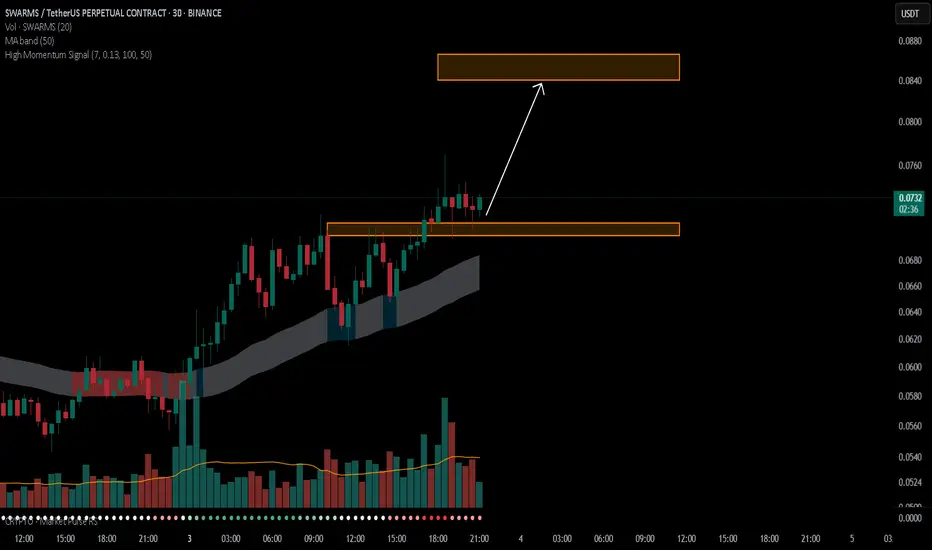
SWARMS/USDTKey Level Zone: 0.0700 - 0.0710
HMT v6 detected. The setup looks promising, supported by a previous upward/downward trend with increasing volume and momentum, presenting an excellent reward-to-risk opportunity.
HMT (High Momentum Trending):
HMT is based on trend, momentum, volume, and market structure across multiple timeframes. It highlights setups with strong potential for upward movement and higher rewards.
Whenever I spot a signal for my own trading, I’ll share it. Please note that conducting a comprehensive analysis on a single timeframe chart can be quite challenging and sometimes confusing. I appreciate your understanding of the effort involved.
Important Note :
Role of Key Levels:
- These zones are critical for analyzing price trends. If the key level zone holds, the price may continue trending in the expected direction. However, momentum may increase or decrease based on subsequent patterns.
- Breakouts: If the key level zone breaks, it signals a stop-out. For reversal traders, this presents an opportunity to consider switching direction, as the price often retests these zones, which may act as strong support-turned-resistance (or vice versa).
My Trading Rules
Risk Management
- Maximum risk per trade: 2.5%.
- Leverage: 5x.
Exit Strategy
Profit-Taking:
- Sell at least 70% on the 3rd wave up (LTF Wave 5).
- Typically, sell 50% during a high-volume spike.
- Adjust stop-loss to breakeven once the trade achieves a 1.5:1 reward-to-risk ratio.
- If the market shows signs of losing momentum or divergence, ill will exit at breakeven.
The market is highly dynamic and constantly changing. HMT signals and target profit (TP) levels are based on the current price and movement, but market conditions can shift instantly, so it is crucial to remain adaptable and follow the market's movement.
If you find this signal/analysis meaningful, kindly like and share it.
Thank you for your support~
Sharing this with love!
HMT v2.0:
- Major update to the Momentum indicator
- Reduced false signals from inaccurate momentum detection
- New screener with improved accuracy and fewer signals
HMT v3.0:
- Added liquidity factor to enhance trend continuation
- Improved potential for momentum-based plays
- Increased winning probability by reducing entries during peaks
HMT v3.1:
- Enhanced entry confirmation for improved reward-to-risk ratios
HMT v4.0:
- Incorporated buying and selling pressure in lower timeframes to enhance the probability of trending moves while optimizing entry timing and scaling
HMT v4.1:
- Enhanced take-profit (TP) target by incorporating market structure analysis
HMT v5 :
Date: 23/01/2025
- Refined wave analysis for trending conditions
- Incorporated lower timeframe (LTF) momentum to strengthen trend reliability
- Re-aligned and re-balanced entry conditions for improved accuracy
HMT v6 :
Date : 15/02/2025
- Integrated strong accumulation activity into in-depth wave analysis
approaching the green zone $SWARMS is approaching the green zone 🟩. Waiting for confirmation before considering a long entry from this level.
🎯 Potential Entry:
🔵 1️⃣ Green zone (waiting for confirmation)

$SWARMS ANALYSIS! $SWARMS is testing the red resistance zone 🟥.
✅ If breakout is successful, the first target is the green line level 🟩.
SWARMS ANALYSIS! SWARMS is testing the red resistance zone 🟥. If it breaks out, the first target is the green line level 🟩.
📢 Join me for more trade setups!

SWARM FORMING NICE TRADEBYBIT:SWARMSUSDT.P
Okay this morning having a look around on the charts SWARMS has a swing there about to happen so once we start turning around, ill look for the up trend on the 15M, easy.
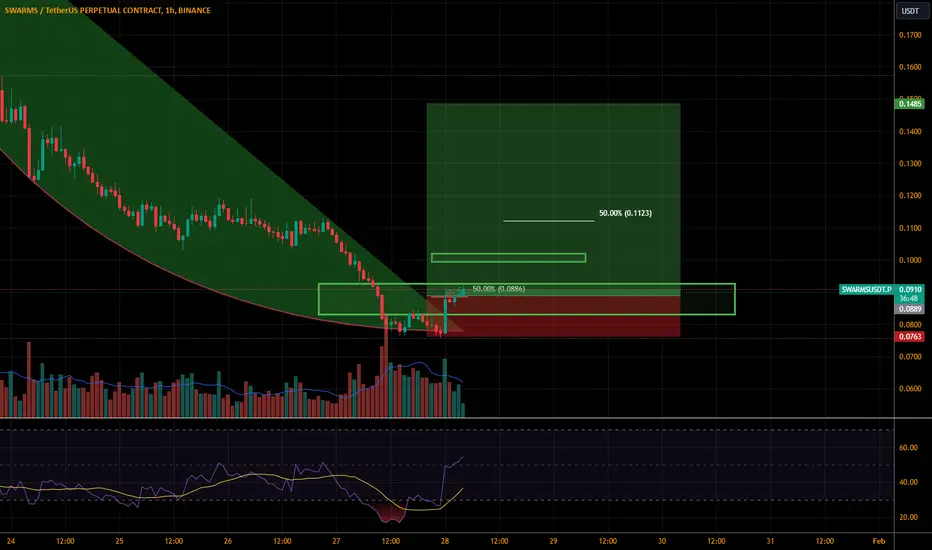
SWARMSUSDT LONGIf market goes like this than we can reach to the target as mentioned in the chart..
Ill prefer to book my profit on the first tp which is 50% level as mentioned..
Hope for the best..
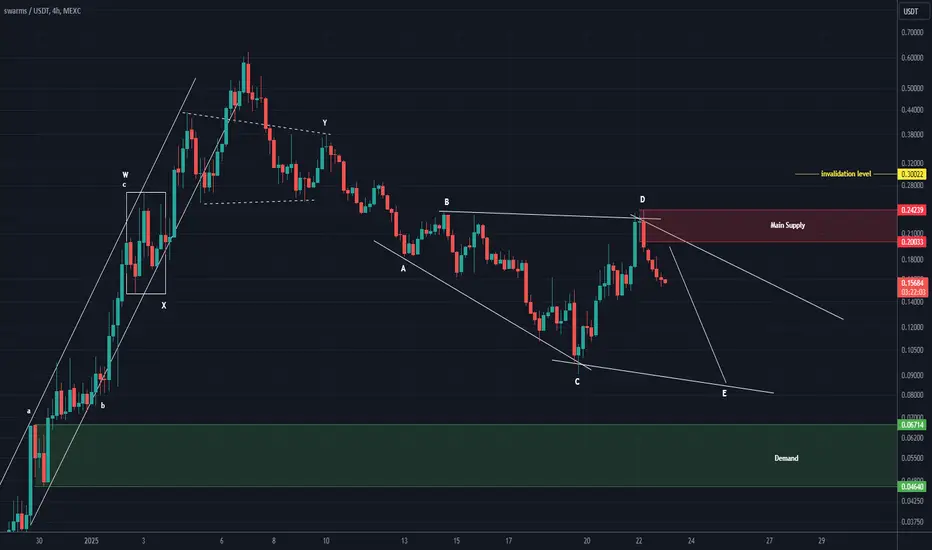
SWARM looks bearish (4H)It appears to be forming a diamond-shaped diametric pattern and is currently in wave E of this diametric.
The main supply zone has been marked on the chart.
Wave E is expected to drop to the lower areas.
A daily candle closing above the invalidation level will invalidate this analysis.
For risk management, please don't forget stop loss and capital management
Comment if you have any questions
Thank You