#SXP/USDT#SXP
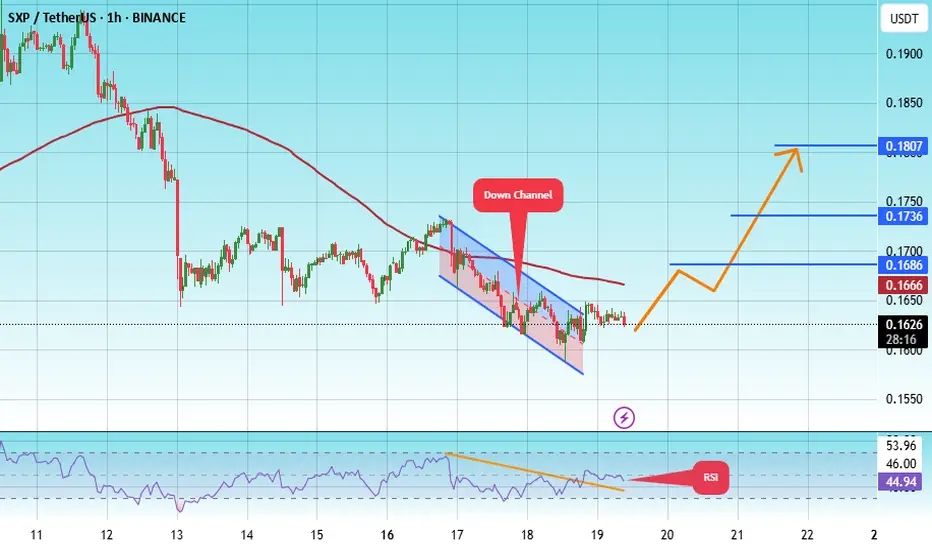
The price is moving within a descending channel on the 1-hour frame, adhering well to it, and is heading for a strong breakout and retest.
We are seeing a rebound from the lower boundary of the descending channel, which is support at 0.1587.
We have a downtrend on the RSI indicator that is ab
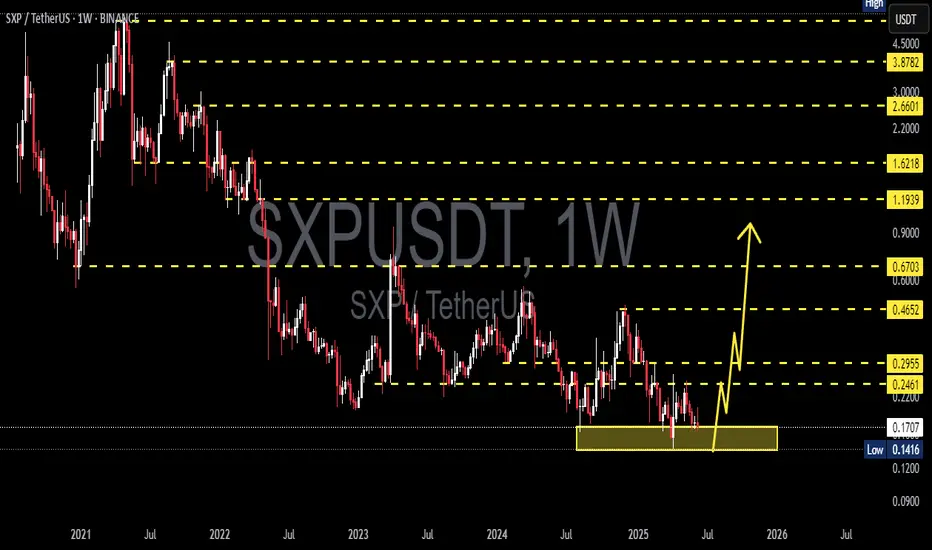
SXPUSDT 1W AnalysisSXP ~ 1W Analysis
#SXP This trade is very high risk. Buy if you still have confidence in this coin with a short term target of at least 20%+ from this support.
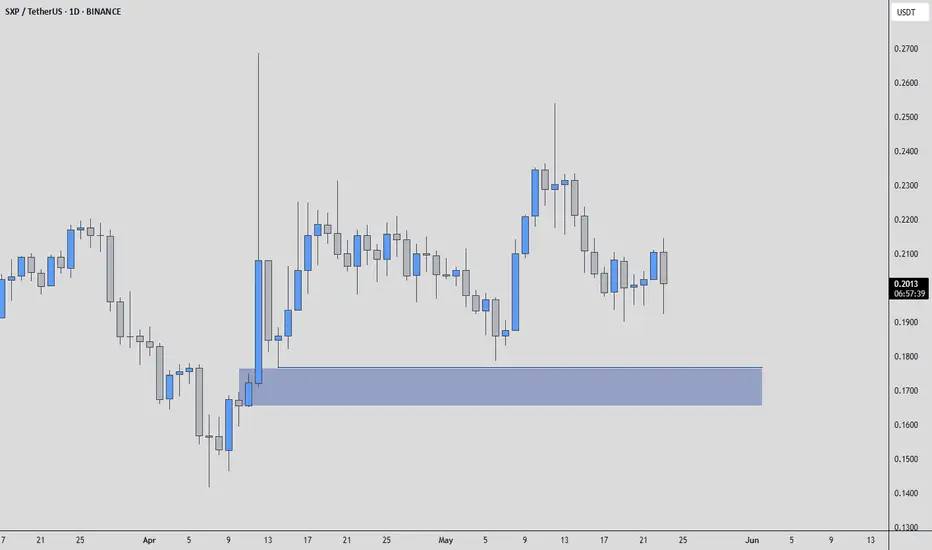
SXPUSDT | Clean Demand Zone BelowSXPUSDT is approaching a blue box that looks like a well-structured demand zone. The last reactions from this area were strong, and it may attract buyers again.
If price revisits that zone with low-timeframe confirmation, I’ll be watching closely. It’s not about predicting, it’s about reacting when
SXP - Pivoting at 0.2100SXP is trading near 0.2100, which is at the lower end of its recent range between 0.1953 and 0.2357. This level seems to be a key pivot point, as the price is holding above the 100-period moving average, a line that has acted as support so far. However, the price is showing signs of consolidation, a

#SXP/USDT#SXP
The price is moving within a descending channel on the 1-hour frame and is expected to break and continue upward.
We have a trend to stabilize above the 100 moving average once again.
We have a downtrend on the RSI indicator that supports the upward move with a breakout.
We have a support a

$SXPUSDT — Watching the Blue Box for the Next Decision PointI’ve had BINANCE:SXPUSDT on my radar today, not randomly — it’s one of the top gainers by volume percentage, which usually hints that the smart money has rotated into this chart.
🔵 Blue Box Support Zone in Play
We’re sitting just above a clear demand zone — the blue box marks where the last big i

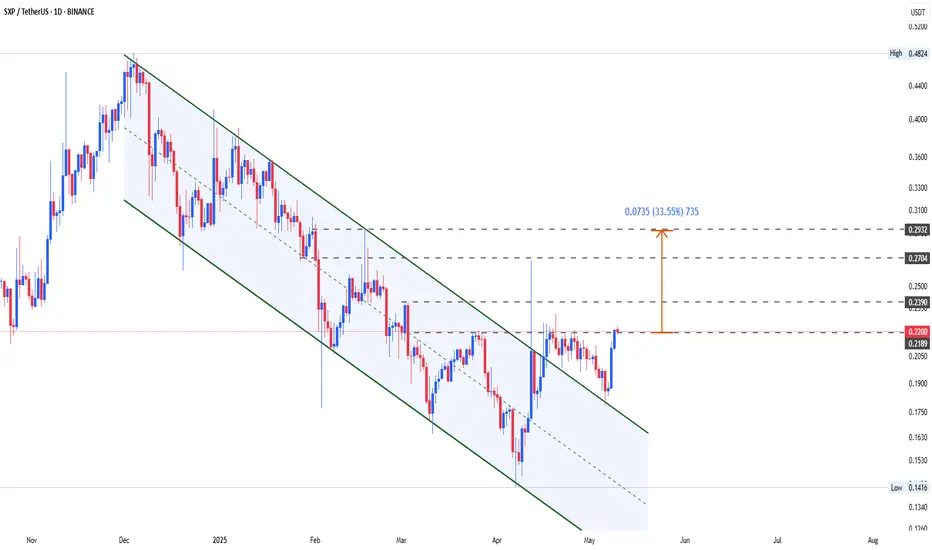
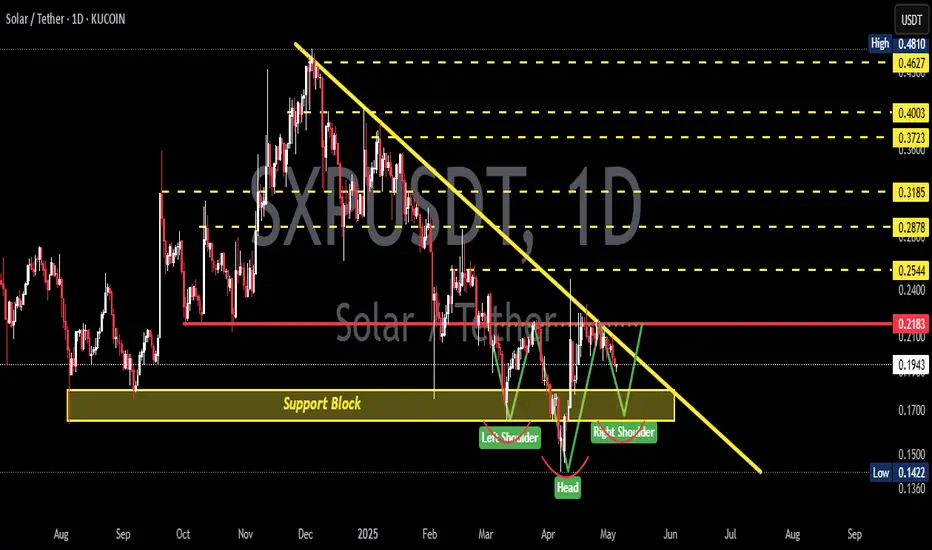
SXP Successfully breakout this resistant line Successfully breakout this resistant line with a short -term target of at least +10%
sxp outbreak bruhyea chart says all kys
yea chart says all kys
yea chart says all kysyea chart says all kys
yea chart says all kysyea chart says all kys
yea chart says all kys
yea chart says all kys
yea chart says all kys
yea chart says all kys
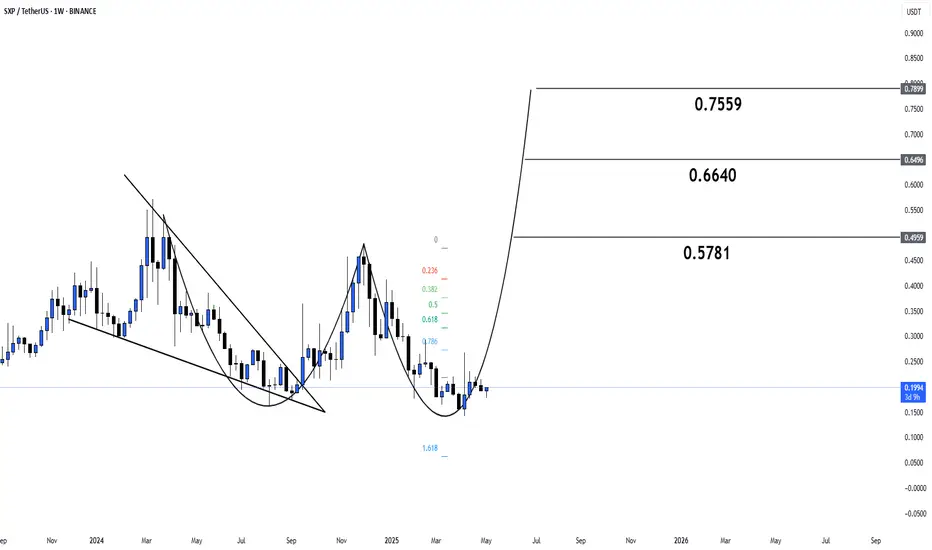
SXP next target 1$#SXP is forming a rounded bottom on the weekly chart 🔄
Breakout above the descending channel + MA50 could trigger a strong move 🚀
TSX:SXP Targets:
🎯 $0.5781
🎯 $0.6640
🎯 $0.7559
Bullish structure in play — eyes on volume and confirmation 📊
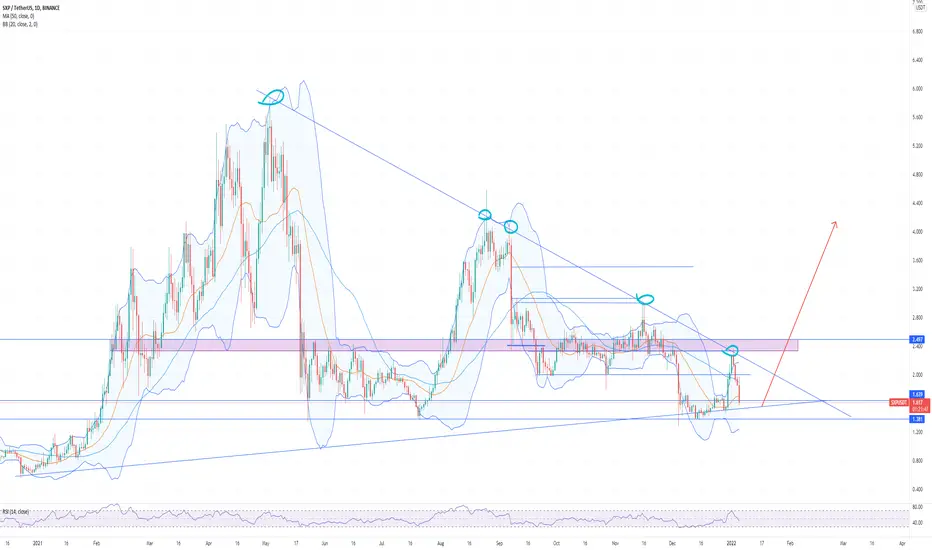
SXPUSDT 1D AnalysisSXP ~ 1D Analysis
#SXP Buy after successfully penetrating this resistant line or buy when re -testing this support block, with a short -term target of at least 10%+.
See all ideas
Summarizing what the indicators are suggesting.
Oscillators
Neutral
SellBuy
Strong sellStrong buy
Strong sellSellNeutralBuyStrong buy
Oscillators
Neutral
SellBuy
Strong sellStrong buy
Strong sellSellNeutralBuyStrong buy
Summary
Neutral
SellBuy
Strong sellStrong buy
Strong sellSellNeutralBuyStrong buy
Summary
Neutral
SellBuy
Strong sellStrong buy
Strong sellSellNeutralBuyStrong buy
Summary
Neutral
SellBuy
Strong sellStrong buy
Strong sellSellNeutralBuyStrong buy
Moving Averages
Neutral
SellBuy
Strong sellStrong buy
Strong sellSellNeutralBuyStrong buy
Moving Averages
Neutral
SellBuy
Strong sellStrong buy
Strong sellSellNeutralBuyStrong buy
Displays a symbol's price movements over previous years to identify recurring trends.