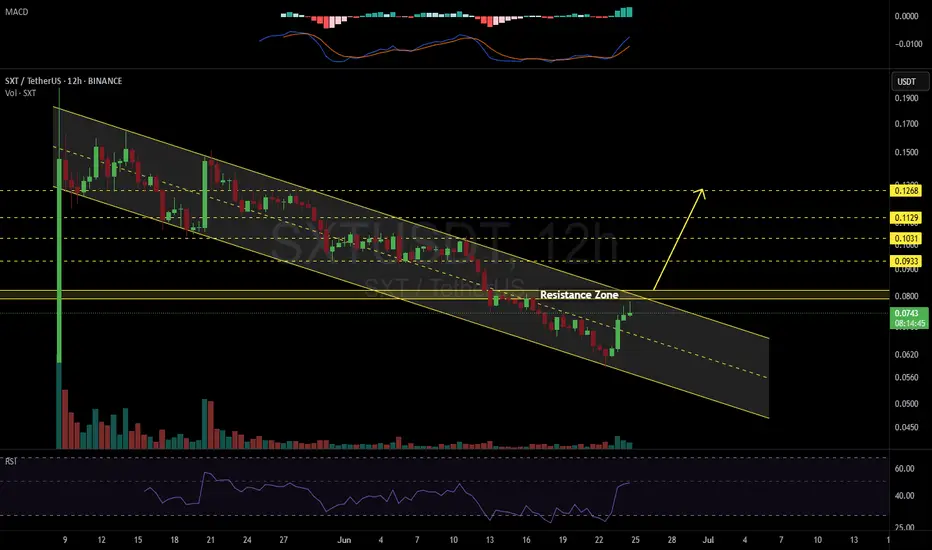
SXTUSDT 12H#SXT is moving inside a descending channel on the 12H timeframe.
In case of a breakout above the resistance zone (as shown on the chart), the following targets come into play:
🎯 $0.0933
🎯 $0.1031
🎯 $0.1129
🎯 $0.1268
⚠️ Always use a tight stop-loss to manage risk and protect your capital.
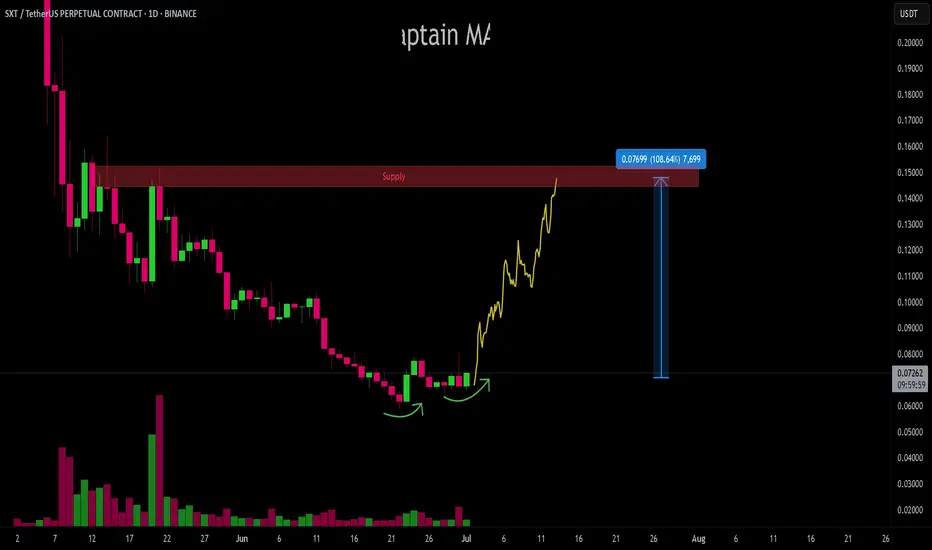
SXT/USDT buy setup SXT, backed by Microsoft, is showing signs of accumulation and gearing up for a potential breakout move toward the key supply zone at $0.15. Momentum is gradually building, and a breakout could trigger a strong rally.
DCA can be considered if price retests lower support levels.
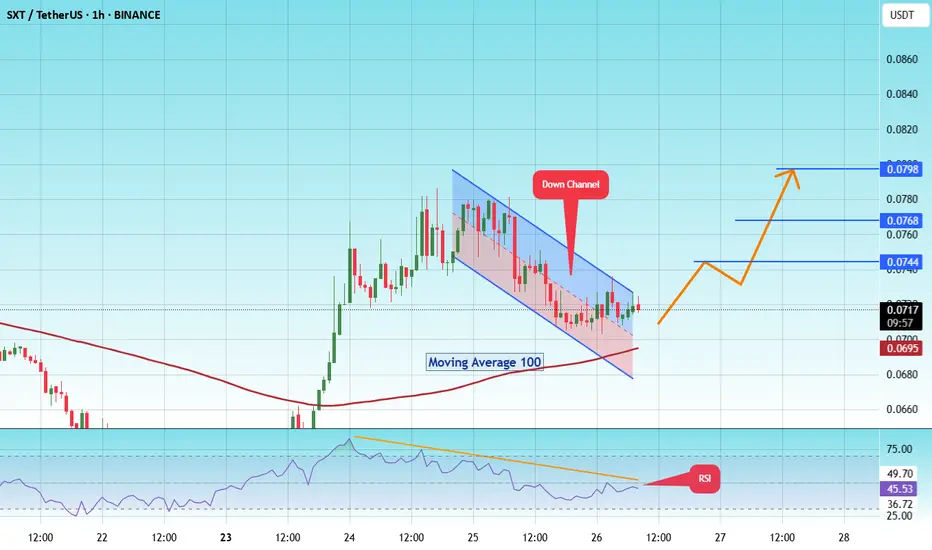
#SXT/USDT#SXT
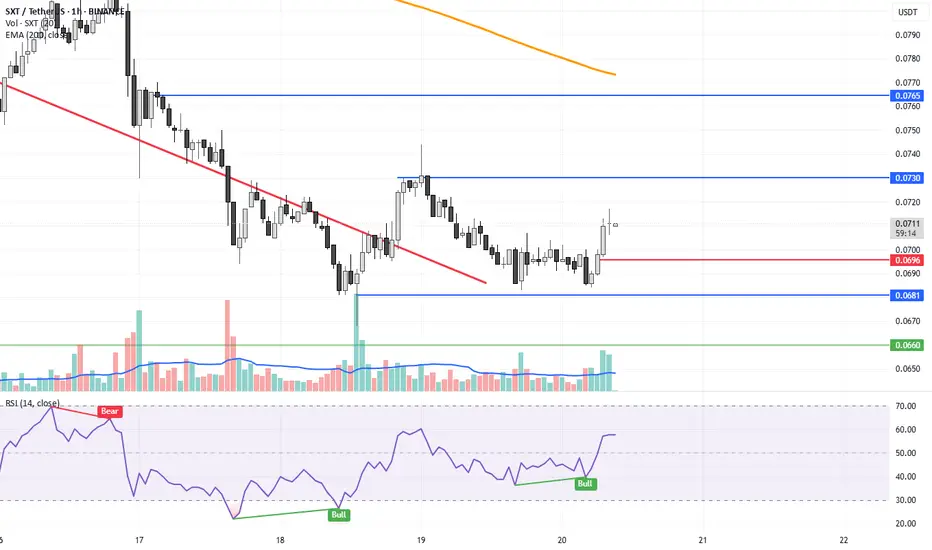
The price is moving within a descending channel on the 1-hour frame and is expected to break and continue upward.
We have a trend to stabilize above the 100 moving average once again.
We have a downtrend on the RSI indicator, which supports the upward move by breaking it upward.
We have a s
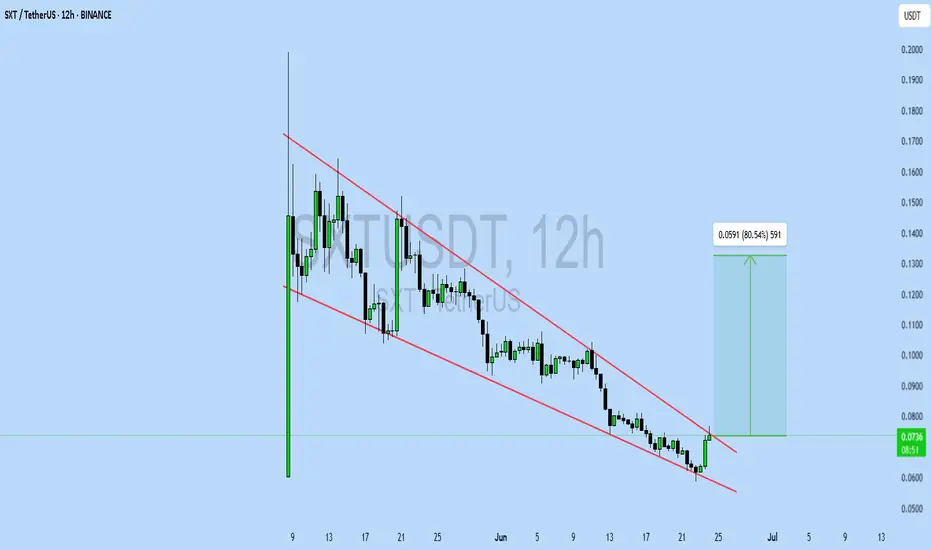
SXTUSDT Forming Falling WedgeSXTUSDT is currently forming a falling wedge pattern, a classic bullish reversal setup that often precedes significant upward price action. This formation indicates a tightening price range and declining volatility, typically signaling a breakout to the upside as selling pressure weakens. Technicall
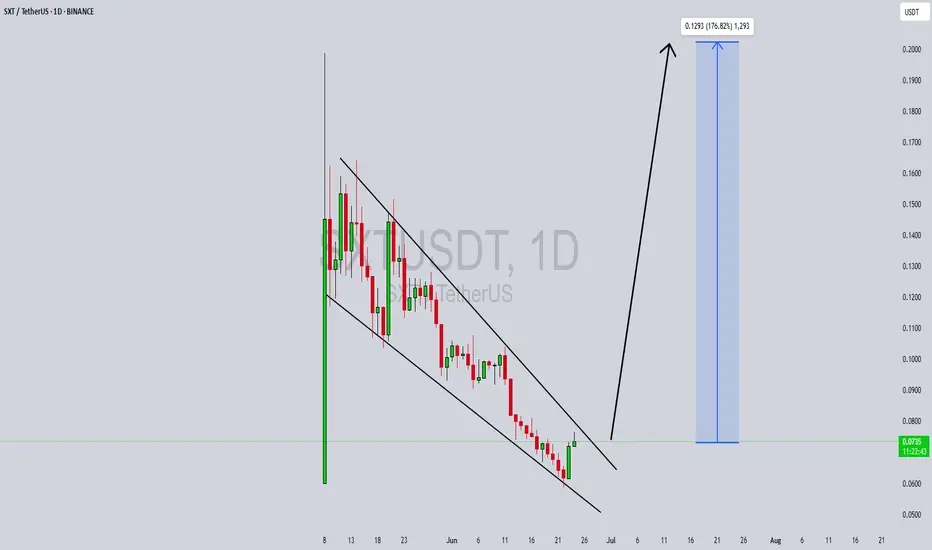
SXTUSDT UPDATEPattern: Falling Wedge
Current Price: $0.0736
Target Price: $0.133
Target % Gain: 80.54%
Technical Analysis: SXT is forming a falling wedge on the 12H chart. The recent bullish breakout with increased momentum suggests potential upside. A sustained close above the wedge signals confirmation.
Ti
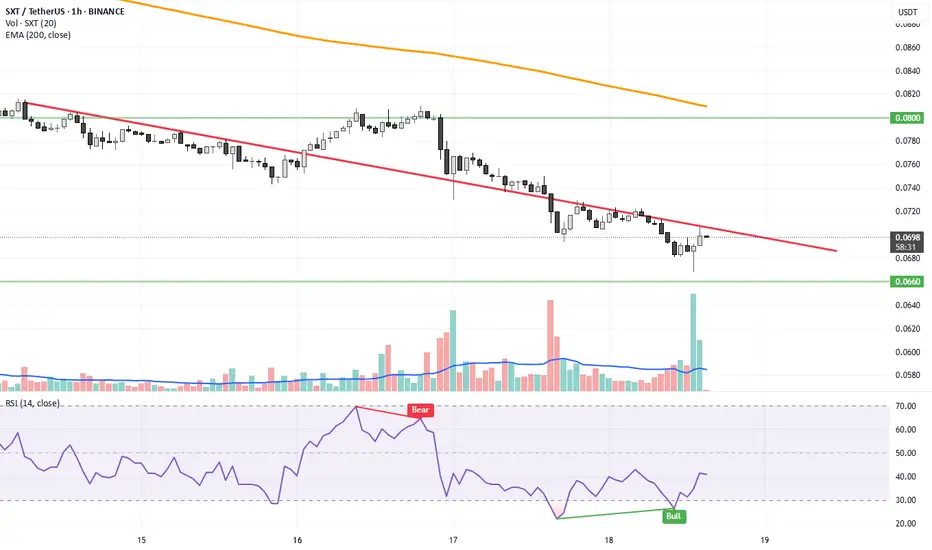
SXT usdtbuy 0.0705 0.0718
sell 0.073 - 0.0765
small stop loss 0.0696
New token available on binance
Spot trade only
SXTUSDT: Sellers Dominate. Your Short Opportunity is Here. The truth is stark: price is falling, and buyers are still nowhere to be found. This isn't a market signaling demand; it's a clear display of strong sellers in control.
Most traders get lost in the noise. But you? You need a clear path. My strategy is simple: those red boxes and lines on the chart

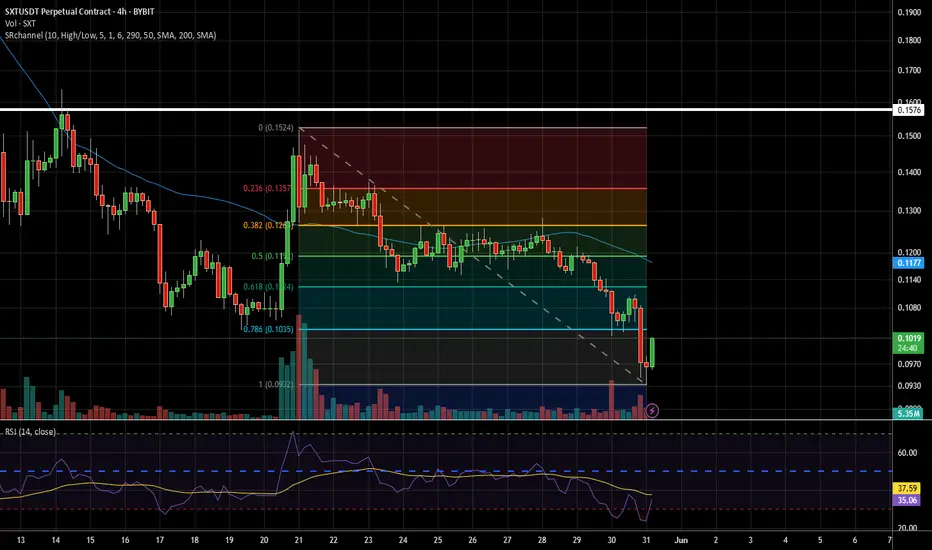
Reversal potintial for SXTHopefully this is the bottom to buy from, I placed my buy order on 0.1000 targeting 0.1576
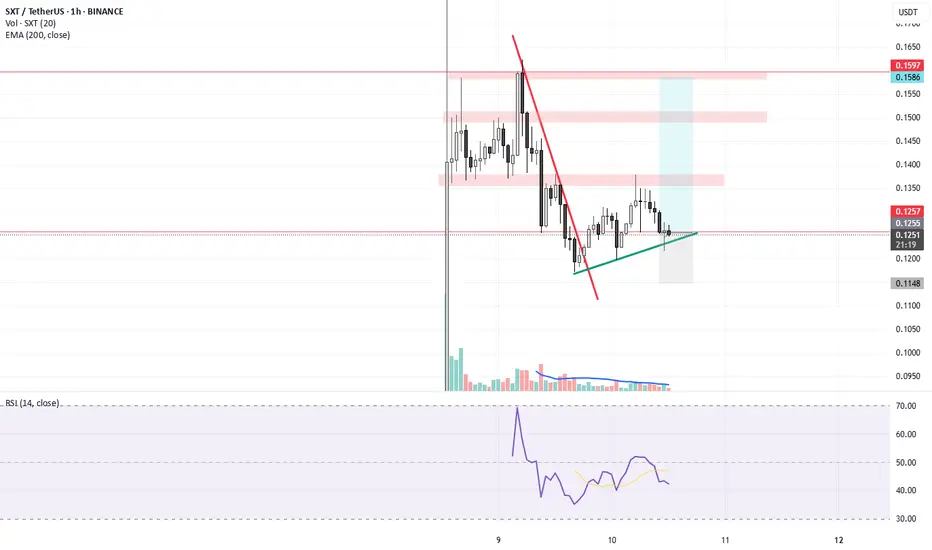
SXT USDTBuy 0.1210 - 0.1300
Sell 0.135 0.15 0.159
SL: 0.1148
new project listed on binnacle
high volume
good strength
SPOT Trading.
See all ideas
Summarizing what the indicators are suggesting.
Oscillators
Neutral
SellBuy
Strong sellStrong buy
Strong sellSellNeutralBuyStrong buy
Oscillators
Neutral
SellBuy
Strong sellStrong buy
Strong sellSellNeutralBuyStrong buy
Summary
Neutral
SellBuy
Strong sellStrong buy
Strong sellSellNeutralBuyStrong buy
Summary
Neutral
SellBuy
Strong sellStrong buy
Strong sellSellNeutralBuyStrong buy
Summary
Neutral
SellBuy
Strong sellStrong buy
Strong sellSellNeutralBuyStrong buy
Moving Averages
Neutral
SellBuy
Strong sellStrong buy
Strong sellSellNeutralBuyStrong buy
Moving Averages
Neutral
SellBuy
Strong sellStrong buy
Strong sellSellNeutralBuyStrong buy