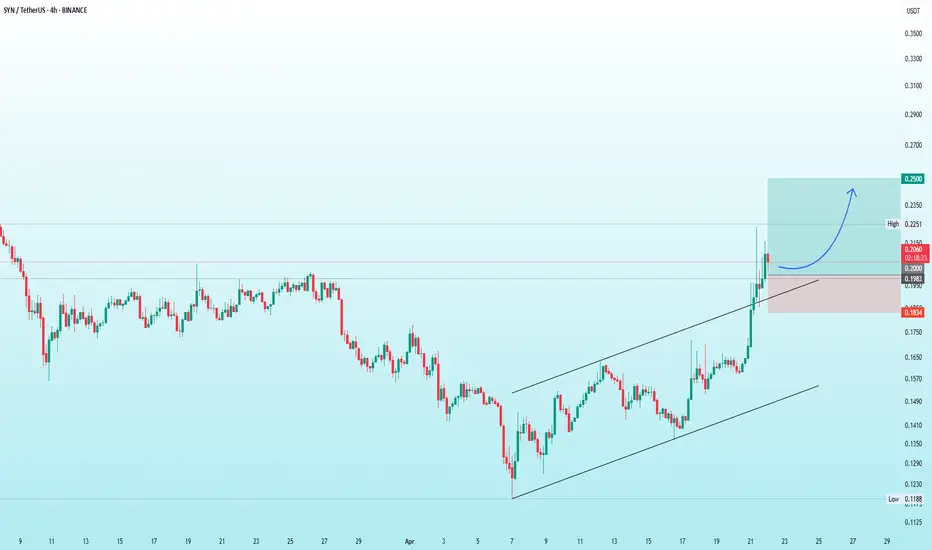
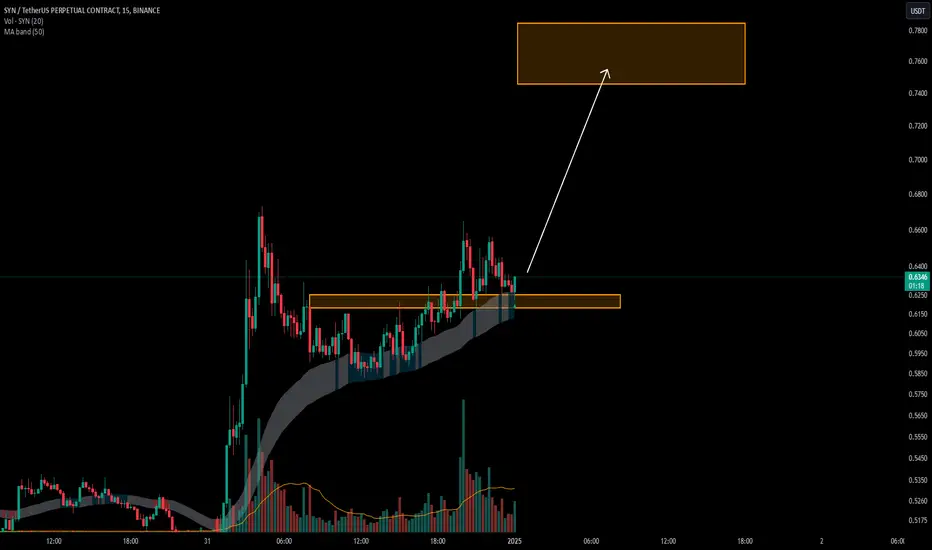
SYN | Expected 25% Gain!!!Technical Analysis Update
A parallel channel breakout and retest has been confirmed on the daily timeframe✅, indicating a potential massive bullish rally. We anticipate a 25% bullish wave in the coming days. 🎯🚀
Trading Strategy
- Entry: Consider long positions
- Stop-loss: Set at 0.1834, just
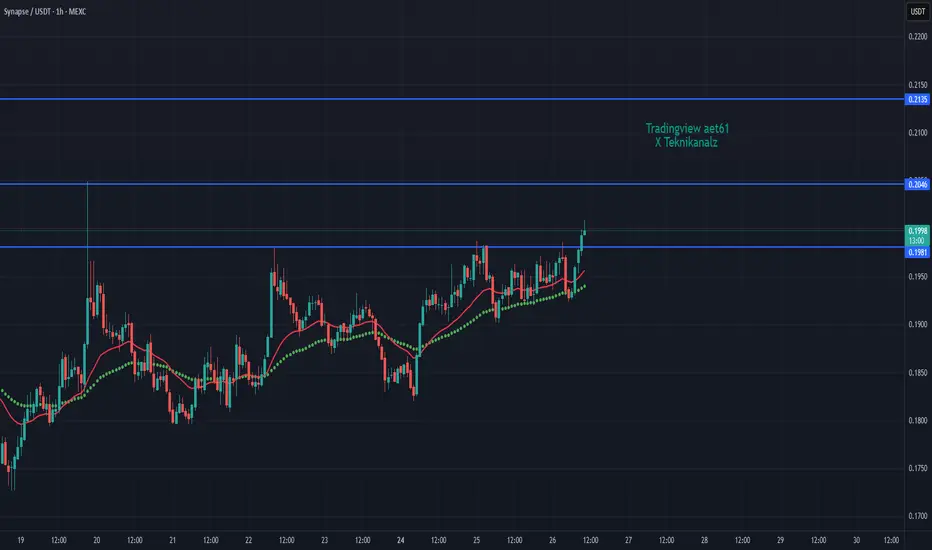
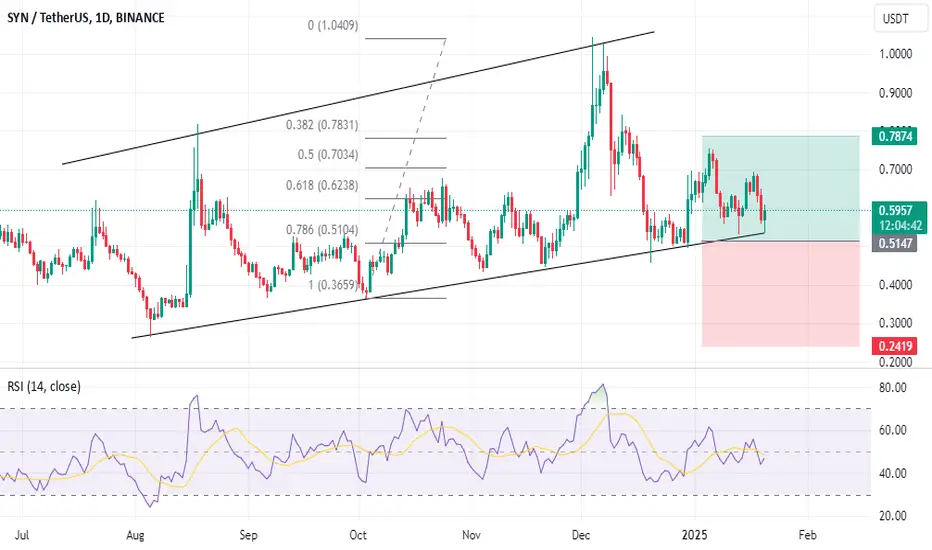
SYNUSDT // cup and handle formationAlthough there is a cup and handle formation on the chart, the targets are drawn according to Fibonacci.
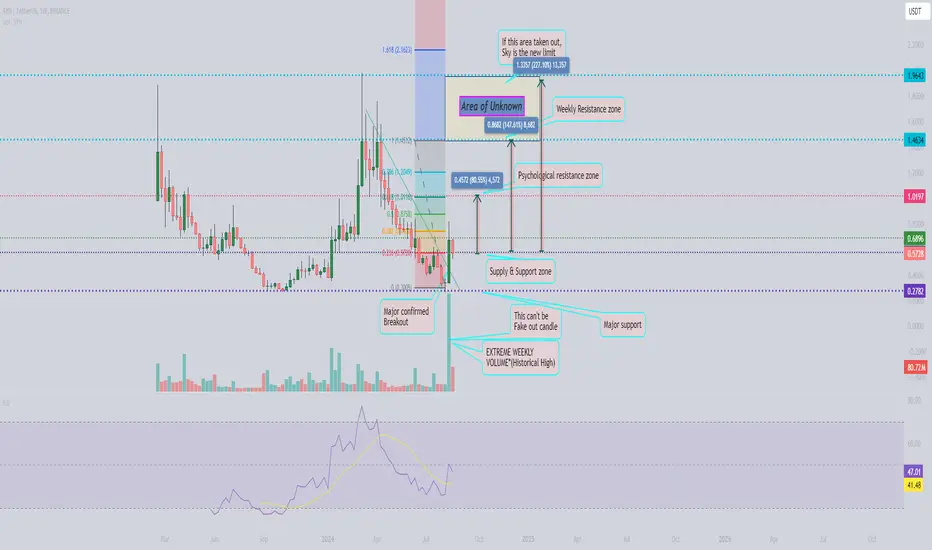
$SYN Bullish Prediction! Weekly chartGreetings to all traders,
I would like to bring to your attention a potentially lucrative bullish opportunity that has emerged in the market. The initial psychological resistance level is situated around the $1 mark (0.618 Fib), while a more substantial weekly and daily resistance zone can be found
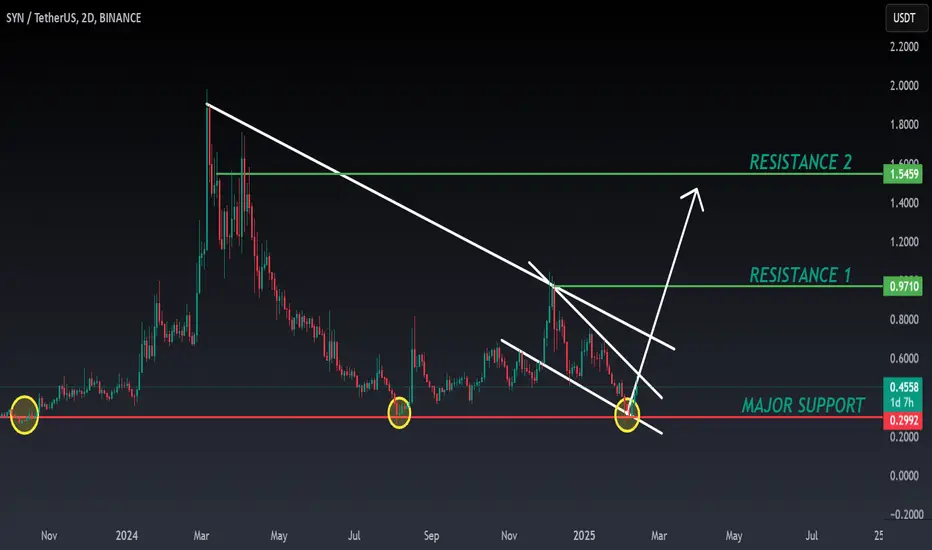
SYN ANALYSIS📊 #SYN Analysis : Update
✅ Here we can see the price is around its major support zone. Falling wedge pattern is forming and 2 times bullish move from the same support point. We would see a good breakout soon and achieve our targets
👀Current Price: $0.4542
🚀 Target Price: $0.9700
⚡️What to do
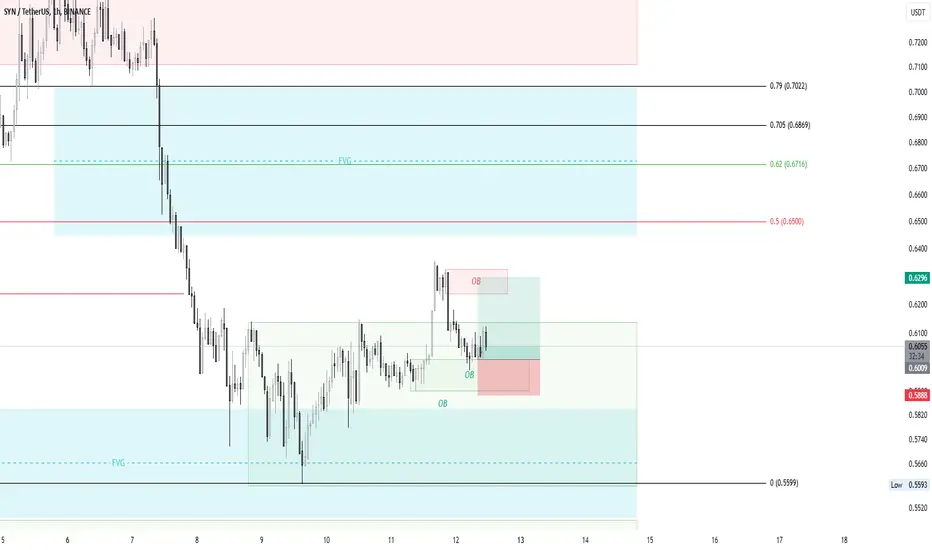
SYNUSDT shortSyn didn't come to the demand area. It has eql and fvg to fill. I consider a short position from the flag limit area. the first TP will be channel equilibrium, swing msb level. The second one is the lower band of the channel. The main target is the main demand area.

synusdtA nice long setup at the demand area with a eqh above. Stop can be used as a close one and as a major one, since the target is good enough.

SYNUSDTWe can attempt to buy SYNUSDT from specified level as it makes HL , also 0.786 FIB level intact indicate that it moves upward.
SL , TP mention in chart.
SYNIn general, the higher follow-up time of this currency can be a correction, but we can have a small fluctuation and a long position from it.
SYN/USDTKey Level Zone : 0.6350-0.6450
HMT v3.1 detected. The setup looks promising, supported by a previous upward/downward trend with increasing volume and momentum, presenting an excellent reward-to-risk opportunity.
HMT (High Momentum Trending):
HMT is based on trend, momentum, volume, and market stru

SYN/USDTKey Level Zone : 0.6180-0.6250
HMT v3.1 detected. The setup looks promising, supported by a previous upward/downward trend with increasing volume and momentum, presenting an excellent reward-to-risk opportunity.
HMT (High Momentum Trending):
HMT is based on trend, momentum, volume, and market struc
See all ideas
Summarizing what the indicators are suggesting.
Oscillators
Neutral
SellBuy
Strong sellStrong buy
Strong sellSellNeutralBuyStrong buy
Oscillators
Neutral
SellBuy
Strong sellStrong buy
Strong sellSellNeutralBuyStrong buy
Summary
Neutral
SellBuy
Strong sellStrong buy
Strong sellSellNeutralBuyStrong buy
Summary
Neutral
SellBuy
Strong sellStrong buy
Strong sellSellNeutralBuyStrong buy
Summary
Neutral
SellBuy
Strong sellStrong buy
Strong sellSellNeutralBuyStrong buy
Moving Averages
Neutral
SellBuy
Strong sellStrong buy
Strong sellSellNeutralBuyStrong buy
Moving Averages
Neutral
SellBuy
Strong sellStrong buy
Strong sellSellNeutralBuyStrong buy
Displays a symbol's price movements over previous years to identify recurring trends.