On-Demand Analysis: $SYN/USDTThis 6H chart shows a drop from around 0.1138 to a low of 0.0840 recently, but it’s now up 23.8% in the last 24 hours due to a technical rebound, whale accumulation, and market-wide liquidity inflows—despite lingering delisting risks!
The tiny dip (-0.30%) today might just be a pause.
A falling wedge pattern is forming—could be a sign of more gains!
Crux:
Support Zone: A strong base is at 0.0900-0.1000, where buyers might step in.
Resistance Level: The next big test is at 0.1100-0.1138 break that, and it could rise!
Falling Wedge: This pattern, with its narrowing lines, often signals a bullish move if it breaks above 0.1138.
Momentum: The uptrend has steady volume, boosted by whale activity and liquidity inflows, though delisting risks linger
Timeframe:Watch the next few days for the wedge to break out
Possibilities:Bullish Move: A jump above 0.1138 with good volume could push it to 0.1300 or more
Bearish Drop: A fall below 0.0900 might take it back to 0.0840—stay careful!
Safety Tip: Set a stop-loss below 0.0900 to stay safe.
SYNUSDT trade ideas
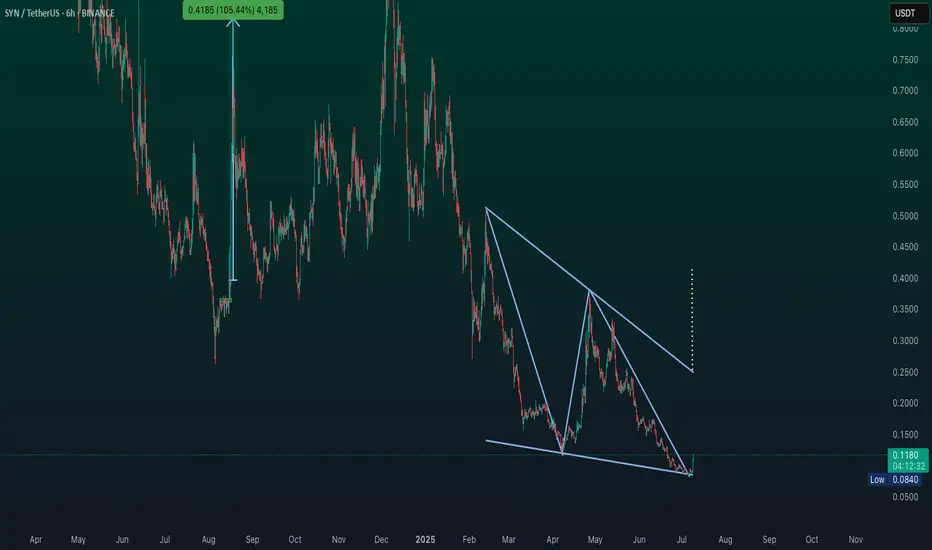
SYNUSDT Forming Falling WedgeSYNUSDT is showing a classic falling wedge pattern, which is widely known as a strong bullish reversal signal in crypto technical analysis. This pattern suggests that the downtrend might be coming to an end, and the recent uptick in trading volume adds further confidence that a breakout could be imminent. With an ambitious expected gain of 290% to 300%+, SYN is positioning itself as a potential high-reward opportunity for traders who are ready to act early on a trend reversal.
The Synapse protocol, which powers SYN, continues to expand its cross-chain interoperability solutions, attracting fresh investor interest. As DeFi users and protocols seek seamless asset transfers across different blockchains, Synapse’s technology stands out, driving long-term growth potential for its token. The increased developer activity and expanding partnerships contribute to a solid fundamental backdrop that supports this optimistic technical setup.
From a technical standpoint, traders should keep a close watch on the resistance line of the falling wedge. A confirmed breakout with strong volume could act as a catalyst for rapid price movement toward the target zone. Patience and good risk management will be key, as such large percentage gains often come with significant volatility.
✅ Show your support by hitting the like button and
✅ Leaving a comment below! (What is You opinion about this Coin)
Your feedback and engagement keep me inspired to share more insightful market analysis with you!
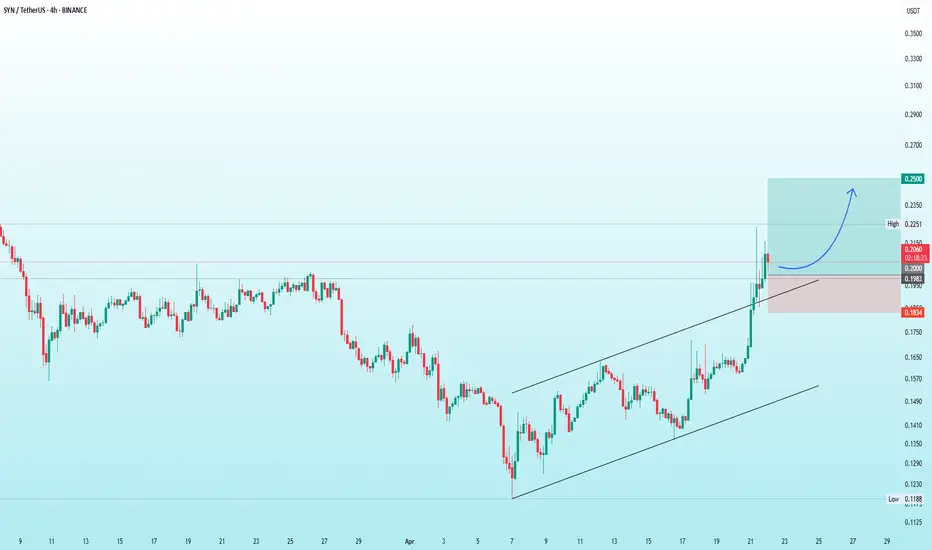
SYN | Expected 25% Gain!!!Technical Analysis Update
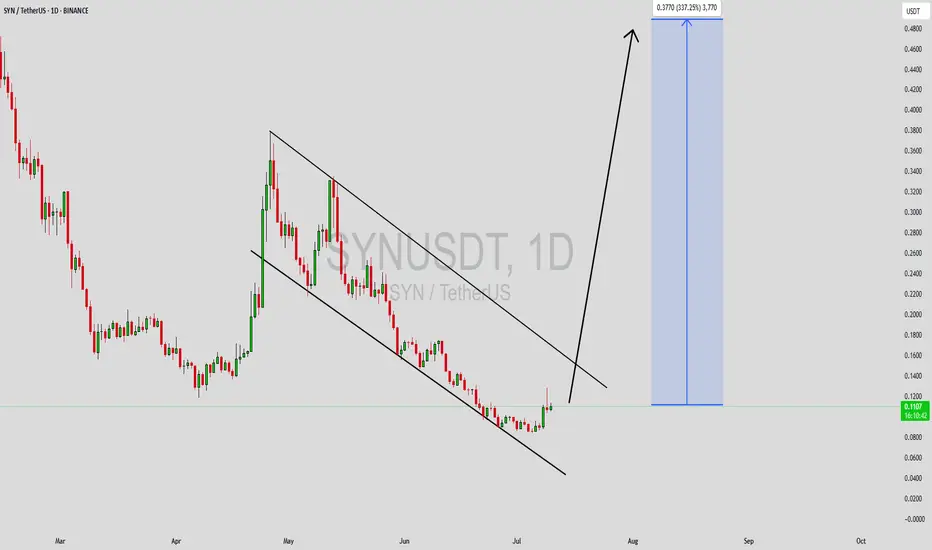
A parallel channel breakout and retest has been confirmed on the daily timeframe✅, indicating a potential massive bullish rally. We anticipate a 25% bullish wave in the coming days. 🎯🚀
Trading Strategy
- Entry: Consider long positions
- Stop-loss: Set at 0.1834, just below the support level
- Risk-reward ratio: 1:3
Trading Reminder
- Assess your risk and calculate potential losses before entering any trade.
- Trade wisely and only enter positions that align with your strategy and risk tolerance.
- Stay calm and avoid impulsive decisions driven by FOMO. Trading is a long-term journey.
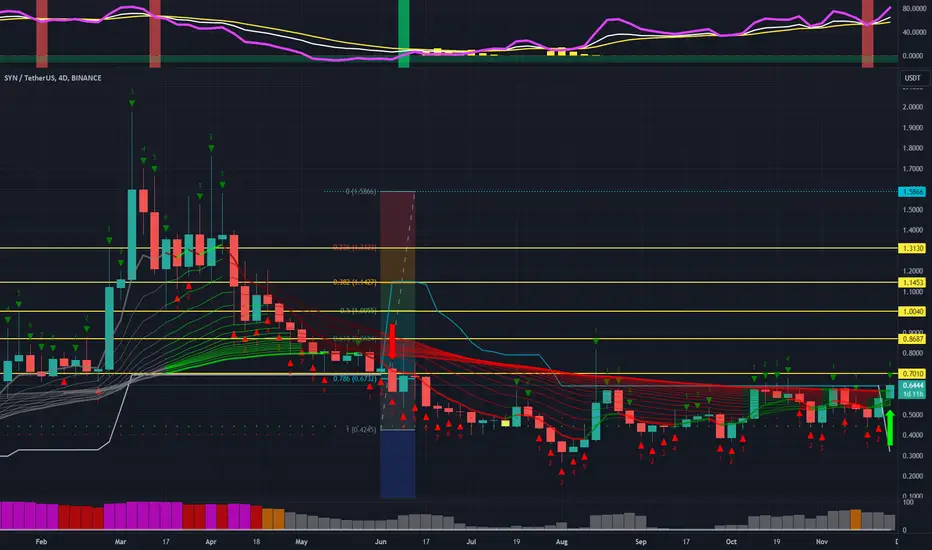
SYNUSDT // cup and handle formationAlthough there is a cup and handle formation on the chart, the targets are drawn according to Fibonacci.
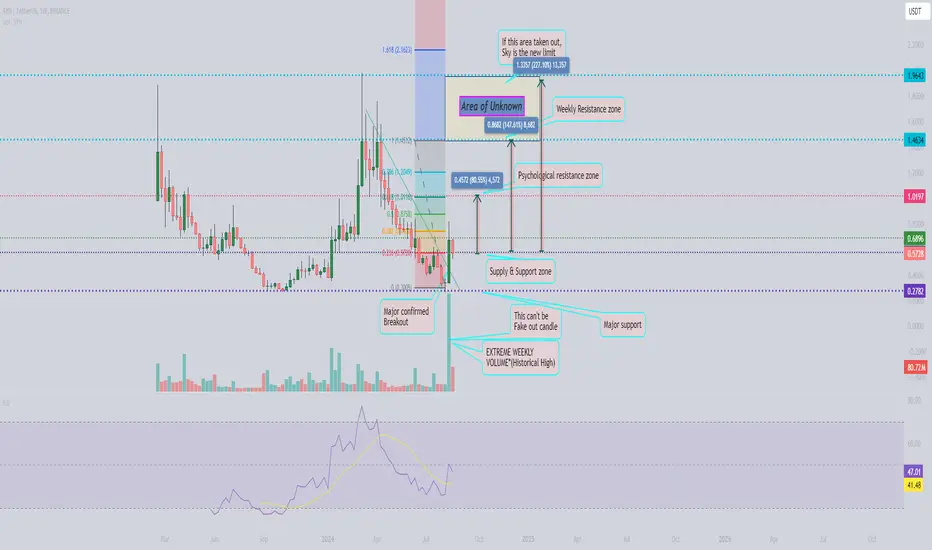
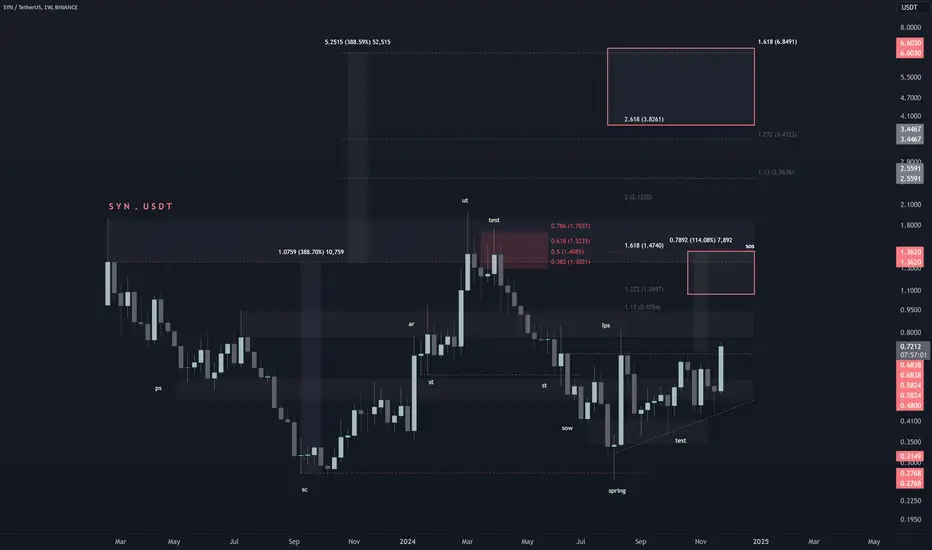
$SYN Bullish Prediction! Weekly chartGreetings to all traders,
I would like to bring to your attention a potentially lucrative bullish opportunity that has emerged in the market. The initial psychological resistance level is situated around the $1 mark (0.618 Fib), while a more substantial weekly and daily resistance zone can be found between $0.55 and $0.58 (0.216 Fib). Notably, the weekly volume candle recently reached an unprecedented high, which strongly suggests the potential for further upward momentum. This observation further reinforces the notion that the recent price action is not a deceptive "fake-out" candle.
Furthermore, the $1.46 zone (1 Fib) presents an intriguing target. Should a general bullish impulse or bullish bull wave materialize, we may witness price action extending beyond this level.
I hope this analysis provides valuable insights for your trading endeavors.
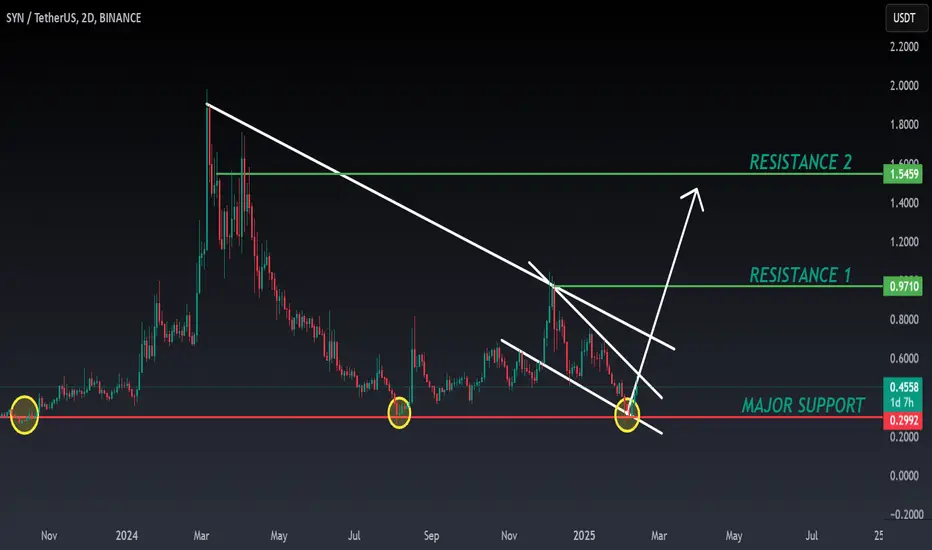
SYN ANALYSIS📊 #SYN Analysis : Update
✅ Here we can see the price is around its major support zone. Falling wedge pattern is forming and 2 times bullish move from the same support point. We would see a good breakout soon and achieve our targets
👀Current Price: $0.4542
🚀 Target Price: $0.9700
⚡️What to do ?
👀Keep an eye on #SYN price action and volume. We can trade according to the chart and make some profits⚡️⚡️
#SYN #Cryptocurrency #TechnicalAnalysis #DYOR
SYNUSDT shortSyn didn't come to the demand area. It has eql and fvg to fill. I consider a short position from the flag limit area. the first TP will be channel equilibrium, swing msb level. The second one is the lower band of the channel. The main target is the main demand area.

synusdtA nice long setup at the demand area with a eqh above. Stop can be used as a close one and as a major one, since the target is good enough.

SYNUSDTWe can attempt to buy SYNUSDT from specified level as it makes HL , also 0.786 FIB level intact indicate that it moves upward.
SL , TP mention in chart.
SYNIn general, the higher follow-up time of this currency can be a correction, but we can have a small fluctuation and a long position from it.
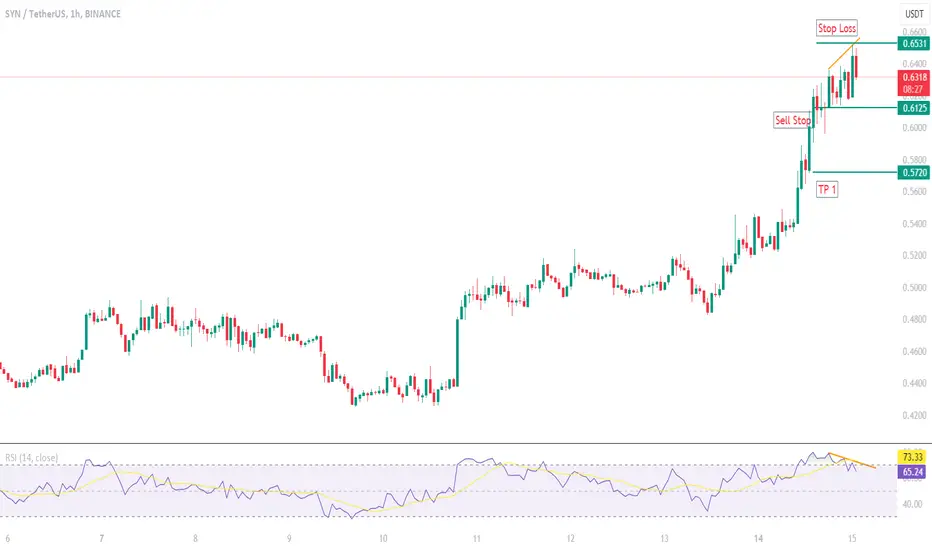
SYN/USDTKey Level Zone : 0.6350-0.6450
HMT v3.1 detected. The setup looks promising, supported by a previous upward/downward trend with increasing volume and momentum, presenting an excellent reward-to-risk opportunity.
HMT (High Momentum Trending):
HMT is based on trend, momentum, volume, and market structure across multiple timeframes. It highlights setups with strong potential for upward movement and higher rewards.
Whenever I spot a signal for my own trading, I’ll share it. Please note that conducting a comprehensive analysis on a single timeframe chart can be quite challenging and sometimes confusing. I appreciate your understanding of the effort involved.
Important Note :
Role of Key Levels:
- These zones are critical for analyzing price trends. If the key level zone holds, the price may continue trending in the expected direction. However, momentum may increase or decrease based on subsequent patterns.
- Breakouts: If the key level zone breaks, it signals a stop-out. For reversal traders, this presents an opportunity to consider switching direction, as the price often retests these zones, which may act as strong support-turned-resistance (or vice versa).
My Trading Rules
Risk Management
- Maximum risk per trade: 2.5%.
- Leverage: 5x.
Exit Strategy
Profit-Taking:
- Sell at least 70% on the 3rd wave up (LTF Wave 5).
- Typically, sell 50% during a high-volume spike.
- Adjust stop-loss to breakeven once the trade achieves a 1.5:1 reward-to-risk ratio.
- If the market shows signs of losing momentum or divergence, ill will exit at breakeven.
The market is highly dynamic and constantly changing. HMT signals and target profit (TP) levels are based on the current price and movement, but market conditions can shift instantly, so it is crucial to remain adaptable and follow the market's movement.
If you find this signal/analysis meaningful, kindly like and share it.
Thank you for your support~
Sharing this with love!
HMT v2.0:
- Major update to the Momentum indicator
- Reduced false signals from inaccurate momentum detection
- New screener with improved accuracy and fewer signals
HMT v3.0:
- Added liquidity factor to enhance trend continuation
- Improved potential for momentum-based plays
- Increased winning probability by reducing entries during peaks
HMT v3.1:
- Enhanced entry confirmation for improved reward-to-risk ratios

SYN/USDTKey Level Zone : 0.6180-0.6250
HMT v3.1 detected. The setup looks promising, supported by a previous upward/downward trend with increasing volume and momentum, presenting an excellent reward-to-risk opportunity.
HMT (High Momentum Trending):
HMT is based on trend, momentum, volume, and market structure across multiple timeframes. It highlights setups with strong potential for upward movement and higher rewards.
Whenever I spot a signal for my own trading, I’ll share it. Please note that conducting a comprehensive analysis on a single timeframe chart can be quite challenging and sometimes confusing. I appreciate your understanding of the effort involved.
If you find this signal/analysis meaningful, kindly like and share it.
Thank you for your support~
Sharing this with love!
HMT v2.0:
- Major update to the Momentum indicator
- Reduced false signals from inaccurate momentum detection
- New screener with improved accuracy and fewer signals
HMT v3.0:
- Added liquidity factor to enhance trend continuation
- Improved potential for momentum-based plays
- Increased winning probability by reducing entries during peaks
HMT v3.1:
- Enhanced entry confirmation for improved reward-to-risk ratios
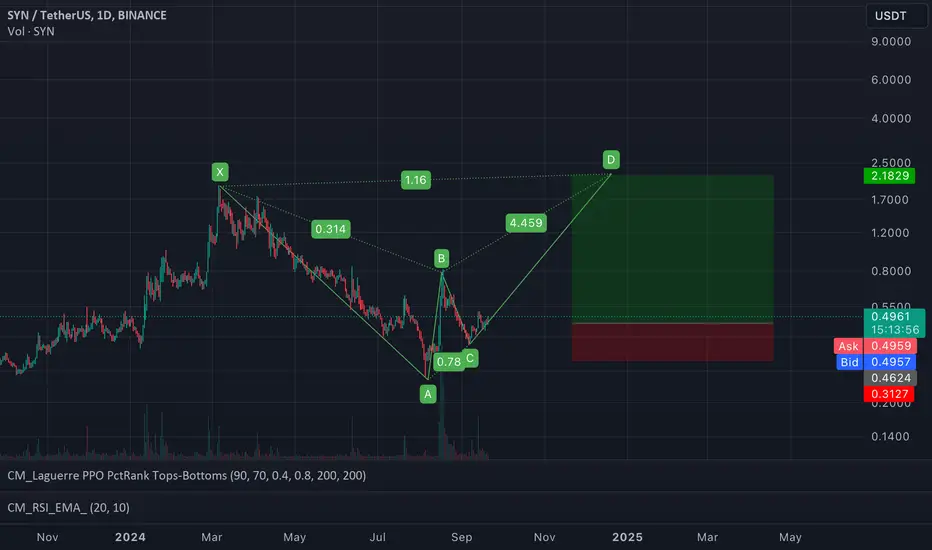
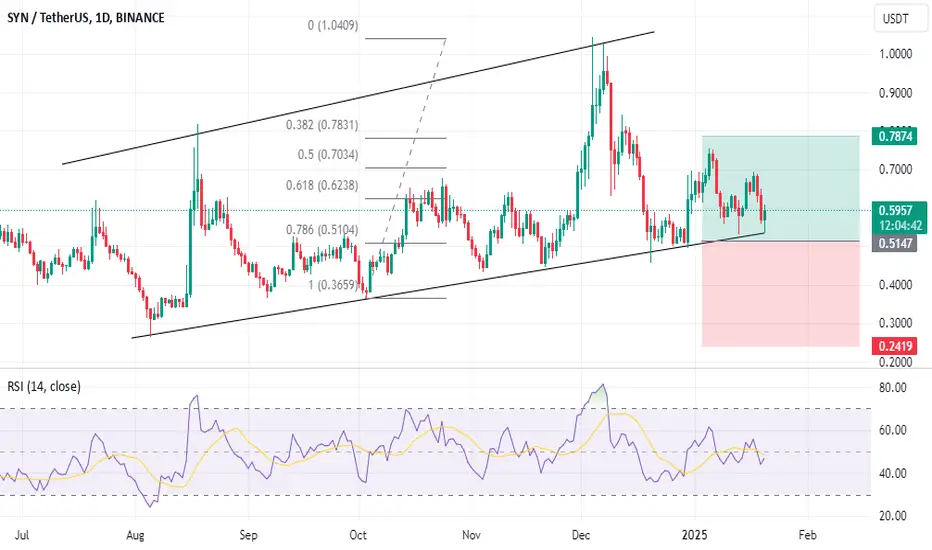
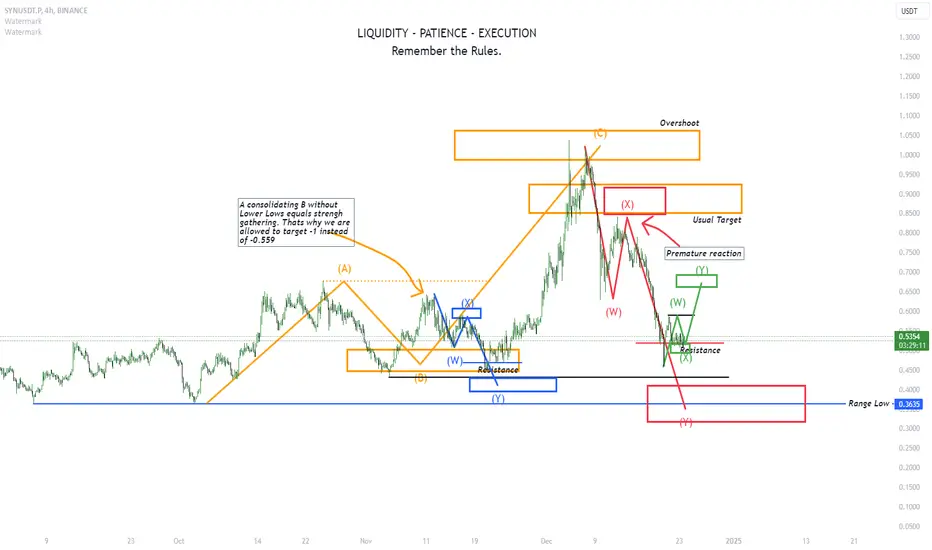
SYN about to trap some bullsWe've entered the orange structure and overshot our normal target due to consolidation in the B phase. However, the red sequence started prematurely, turning before reaching the reversal zone. This suggests the current structure may not follow typical patterns.
The forming green structure, with constantly lower lows in the X phase, is concerning, especially given Synapse's relatively new data and the untested equal lows acting like a magnet for liquidity.
Given my outlook on Bitcoin falling further, I expect the green structure to fail and the range low to be taken out before any bullish structures form. So, I'd advise caution: wait and see how the market reacts at the range low. Once we see a bullish structure, then it's time to trade. For now, patience is key.
Synapse (SYNUSDT) Primed for the Next Big Move🚀 Synapse (SYNUSDT) Primed for the Next Big Move? 🌉
Hey, fellow traders and Synapse enthusiasts! Let's break down an intriguing setup for SYN/USDT on the 9-hour chart! 📈
Current Price: $0.5882
💥 Resistance Ahead? We’re keeping a close eye on the resistance zone (R) just above $0.59, as breaking past this level could open up the door to our potential Take Profit 1 (TP1) at $0.8326. This range holds substantial liquidity and could set the pace for a bullish breakout.
🔥 Target Levels:
TP1: $0.8326 – First milestone, where momentum may consolidate.
TP2: $1.0143 – Strengthening buyer interest.
TP3: $1.25 – Eyeing mid-level resistance for the next phase.
TP4: $1.60 – 🚀 Moon mission confirmed?
📉 Pullback Potential: There's notable support around $0.55, giving SYN a solid foundation for any retests. Key long-term holders and smart money may be accumulating here. A dip could be a smart entry for risk-managed positioning.
🧠 Projection Confidence: Moderately Strong – aligning with historical support zones, Fibonacci levels, and volume trends.
Is this the moment SYN climbs the ladder of price targets, one by one? Stay tuned as the Synapse ecosystem evolves. Watch for confirmations, and always remember – good risk management is key! 🛡️💪

SYN COIN LOOKING BULISH STRONG VOLUME MORE LIQUIDITY IN UPSIDE this is the idea to trade this coin hope you making some profits from our previous calls thank you DYOR

#sym 4hIn the four-hour timeframe, due to the pattern's breakout, it could rise to the high of the major side and 1.27 of the previous wave.
It is essential to observe the stop loss.

$SYN - Sign of strength in progressSeems to be the sign of strength move here on LSE:SYN , with a measured move from the ascending triangle on our daily, that would take you into the top of the range.
Typically this is where you would expect a partial decline / consolidation while supply is absorbed.
Assuming this is correctly identified, you would expect a second test of the range high which confirms the partial decline, and statistically favors a breakout there after.
You would expect to see rising volume and strength into the second test, and escape velocity taking you into extension levels.
The measured move finds confluence with the 1.618, and could very well be where we end up in time here.
SYN is also getting ready to partySYNAPSE is getting stronger today and with this happing - a bullish signal emerged
If we take a look at the prior green candles from feb2024 we can see it like to go up fast.
Targets on chart
For any questions just leave a comment 🌟
About SYN
Securely connect every blockchain
Synapse is comprised of a cross-chain messaging framework and an economically secure method to reach consensus on the validity of cross-chain transactions, enabling developers to build truly native cross-chain apps.
Powering the most popular bridge
Synapse Bridge is built on top of the cross-chain infrastructure enabling users to seamlessly transfer assets across all blockchains. The Bridge has become the most widely-used method to move assets cross-chain, offering low cost, fast, and secure bridging.
Deep Liquidity
Swap native assets using our cross-chain AMM liquidity pools
Wide Support
Access over 16 different EVM and non-EVM blockchains with more integrations coming soon
Developer Friendly
Easily integrate cross-chain token bridging natively into your decentralized application
SYYUSDT STRONG BUYY!!!"I am analyzing the potential price movement of SYN/USDT. Based on recent trends and indicators, I see a potential upward trajectory. My target price (TP) is set at 1.87, which aligns with key resistance levels. I will continue monitoring market conditions to adjust the target if needed."
STRONG BUY !!!

SYN / Usdt BREAKOUTHello guys
As you see on the chart price breaks trendline
Important levels shown for you.
We will see 0.65$ sooooon

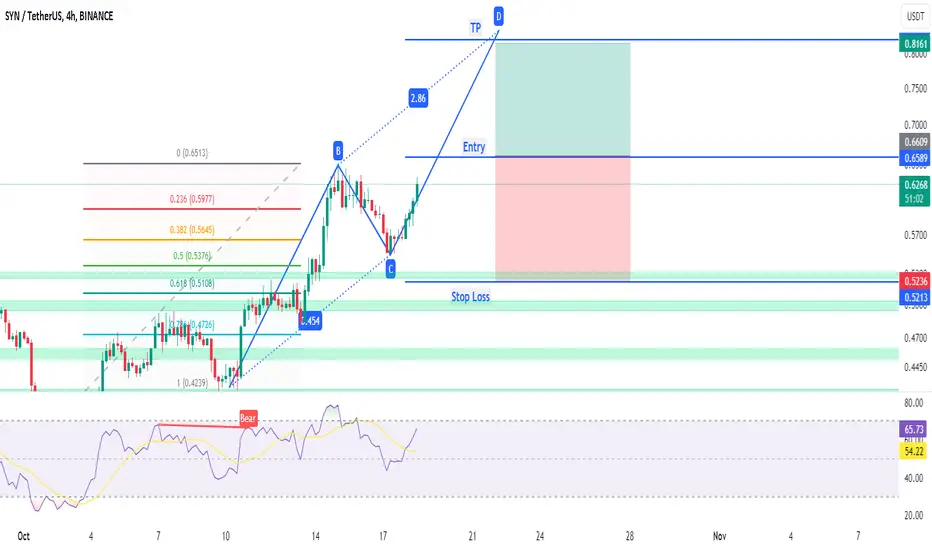
LONG TRADE ON SYN/USDT 4H TF WITH AB=CD PATTERN.Here SYN/USDT is in up trend and making bullish flag or we can say AB=CD pattern. We assume that it will go to the targeted position.
SYNUSDT Bearish ReversalSYNUSDT shows divergence on RSI and it could show reversal at this point, keep eyes and enter if it breaks the higher low.