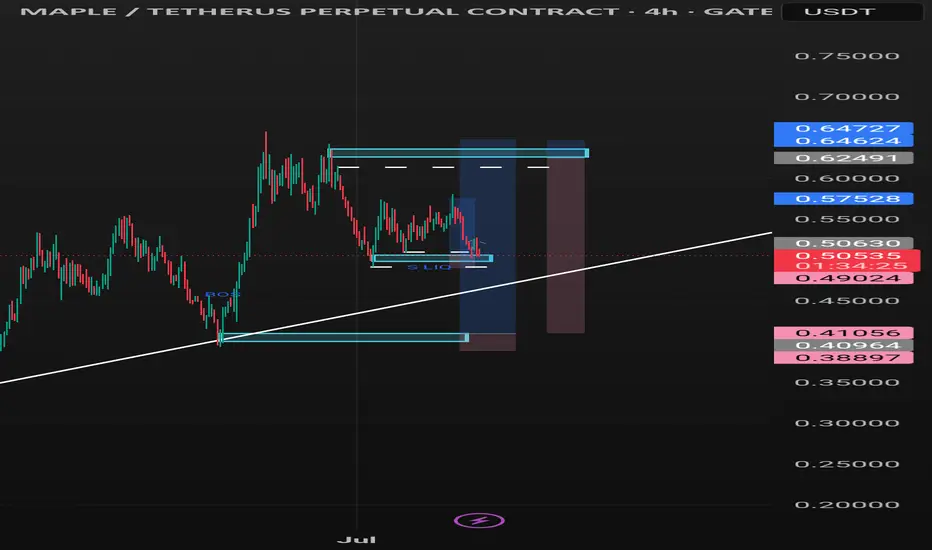
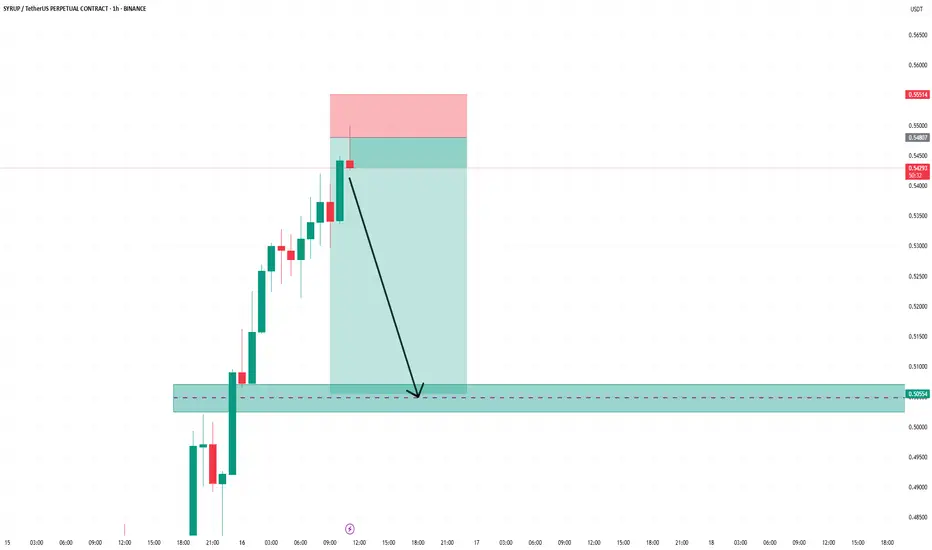
Possible upside before selling.If price holds above 0.50572, rhen we expect a push towards the previous high, then a sell that's will take it to the trendline. However if price cannot hold that support, then we expect a sell to continue as there's a trendline breakout and retest below around 0.49024
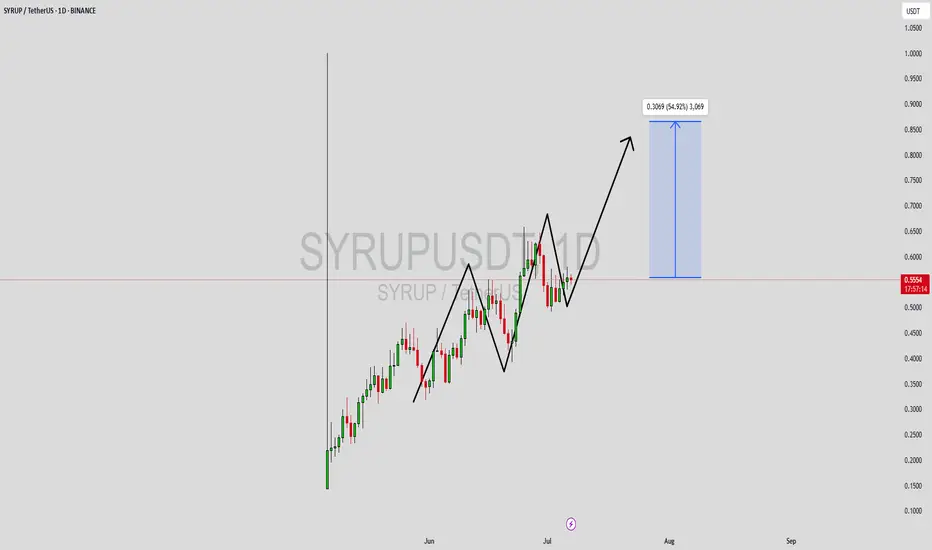
SYRUPUSDT Forming Upward ChannelSYRUPUSDT is catching the eyes of crypto traders with its steady climb and promising technical structure. The current chart shows that SYRUP is building a healthy upward channel, with good volume supporting the recent price action. This setup suggests that the pair could be preparing for another leg
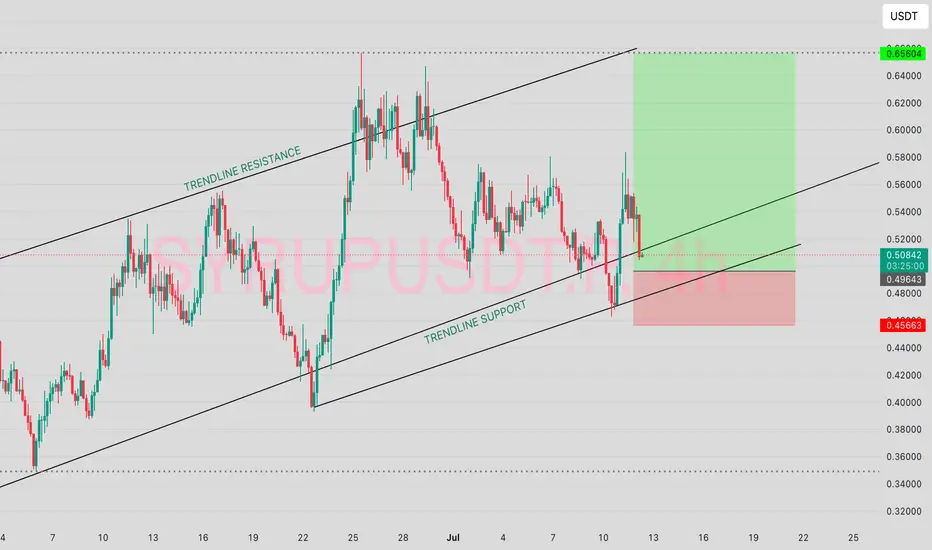
$SYRUP TRADE, BULLISH?This is my setup for the BYBIT:SYRUPUSDT.P trade. having respected the previous Trendlines, i would expect same with higher target.
I have set my target between the higher trendline and lower trendline of the support.
I'm afriad I won't be picked but if the trades gets me into the trade, then I
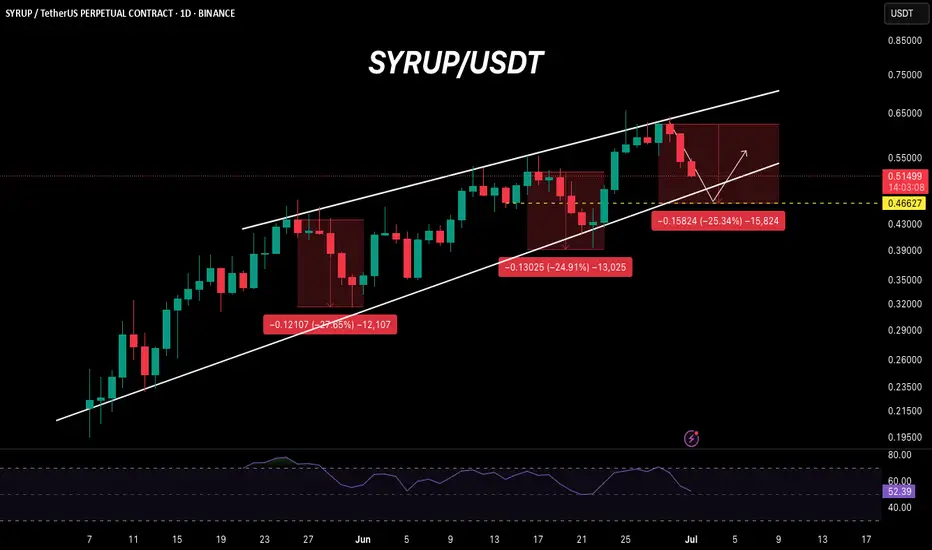
SYRUP: Likely to show some correction!Hello Traders,
Let’s analyze SYRUP on the daily timeframe.
SYRUP has been a strong performer so far and is currently going through a correction phase. It's following a similar price pattern as before and is likely to rebound from the $0.045–$0.046 range. Let's keep a close watch and aim to secure
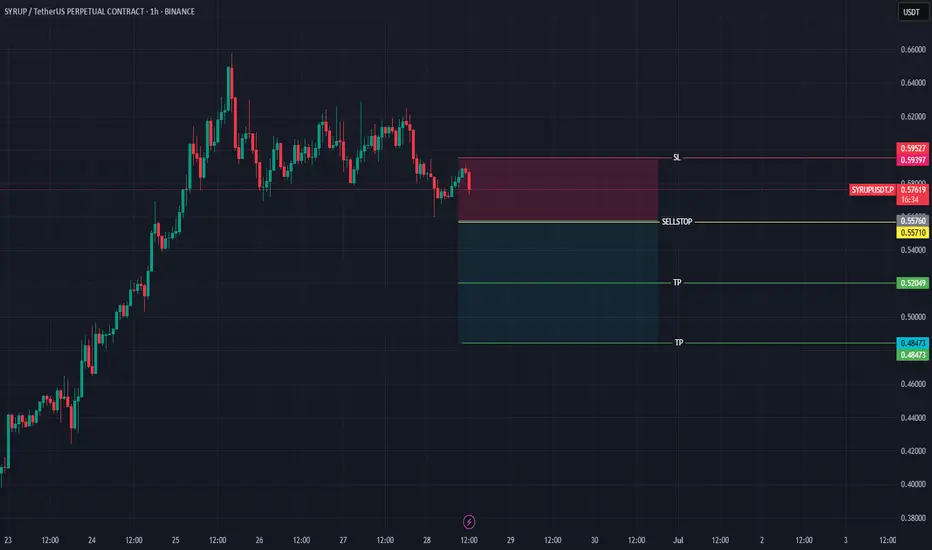
SYRUPUSDTBearish Trend continuation
SellStop and SL are mention on the chart
Note: Please move your SL to EP after TP1
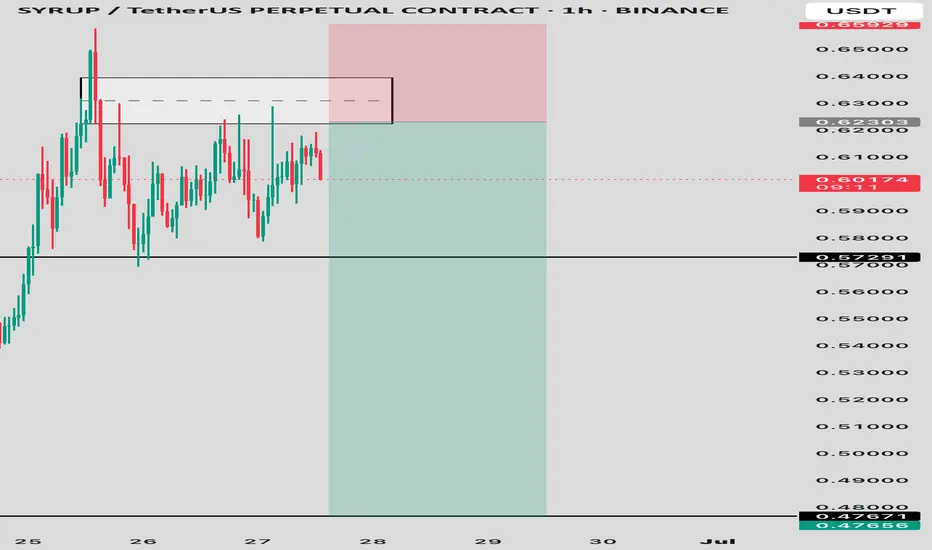
SYRUP/USDT – 1H AnalysisSYRUP has recently tapped into a major resistance zone around 0.6230, showing multiple rejections with long wicks and sharp sell-offs. This price area has acted as a supply zone, indicating strong seller presence.
Key Levels:
• Entry (supply zone): 0.62303
• First Target: 0.57291 – minor support
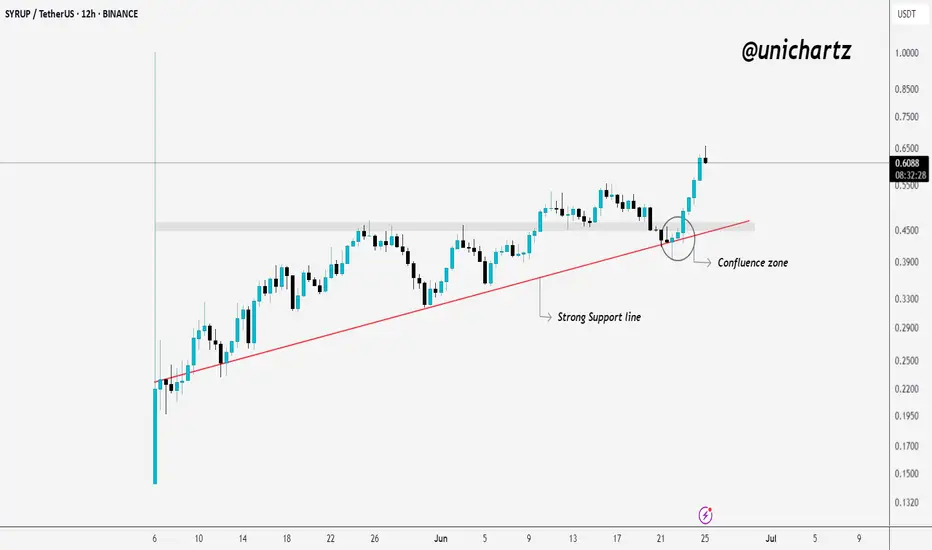
SYRUP Bounces from Confluence Zone – Bullish Continuation?SYRUP bounced cleanly from the confluence zone — where trendline and support aligned. Bulls stepped in fast.
As long as it holds above trendline, upside continuation is likely.
Wait for retest or structure before chasing.
DYOR, NFA
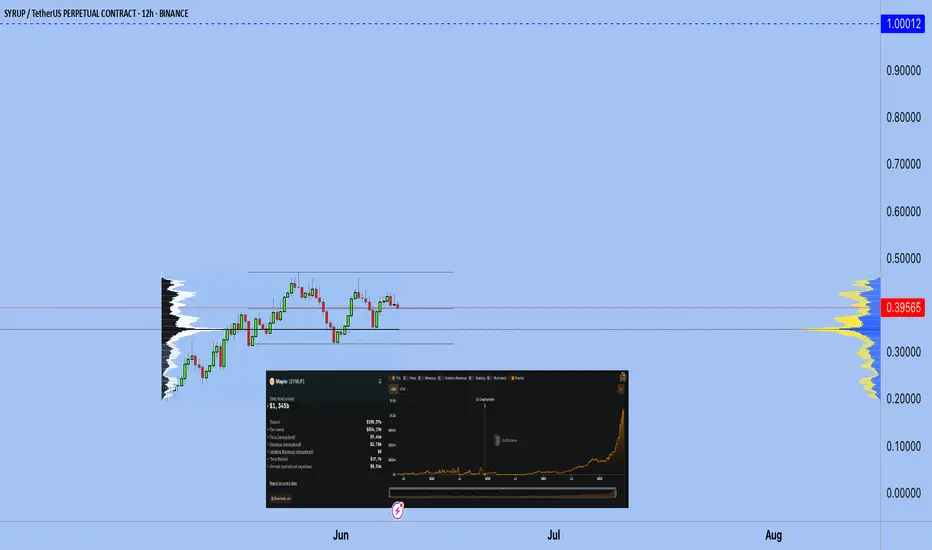
$SYRUP (formerly Maple): An Institutional-Level RelaunchMassive Reload: Brand, Token, Architecture
In May, the migration from MPL - SYRUP was completed, with the final 48-hour window taking place from May 19-21, 2025.
All products (syrupUSDC, syrupUSDT, etc.) have been integrated into the Maple ecosystem.
The Syrup.fi platform has been shut down. Uncl
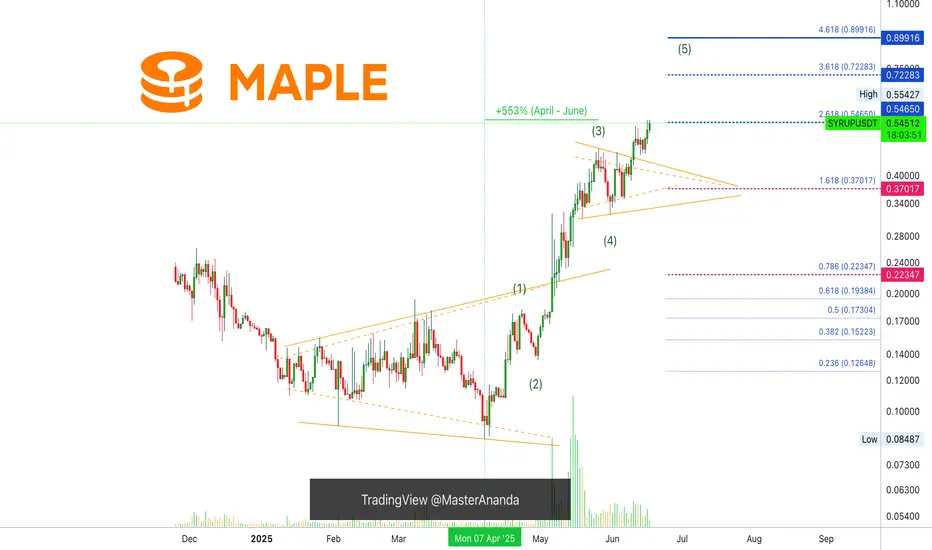
Maple (SYRUP) Bullish Impulse, Final Target & Correction Support+553% since its 7-April bottom, but the third wave is already in. Notice how the volume is super high until 15-May but then it drops as prices continue higher. This means that only the fifth wave remains. After the completion of the fifth wave there should be a correction before additional growth.
SYRUPUSDT.P - make a All Time High - SYRUPUSDT.P - make a All Time High now market
My Profit Area 0.50300
See all ideas
Summarizing what the indicators are suggesting.
Oscillators
Neutral
SellBuy
Strong sellStrong buy
Strong sellSellNeutralBuyStrong buy
Oscillators
Neutral
SellBuy
Strong sellStrong buy
Strong sellSellNeutralBuyStrong buy
Summary
Neutral
SellBuy
Strong sellStrong buy
Strong sellSellNeutralBuyStrong buy
Summary
Neutral
SellBuy
Strong sellStrong buy
Strong sellSellNeutralBuyStrong buy
Summary
Neutral
SellBuy
Strong sellStrong buy
Strong sellSellNeutralBuyStrong buy
Moving Averages
Neutral
SellBuy
Strong sellStrong buy
Strong sellSellNeutralBuyStrong buy
Moving Averages
Neutral
SellBuy
Strong sellStrong buy
Strong sellSellNeutralBuyStrong buy