SYRUPUSDT UPDATE#SYRUP
Update
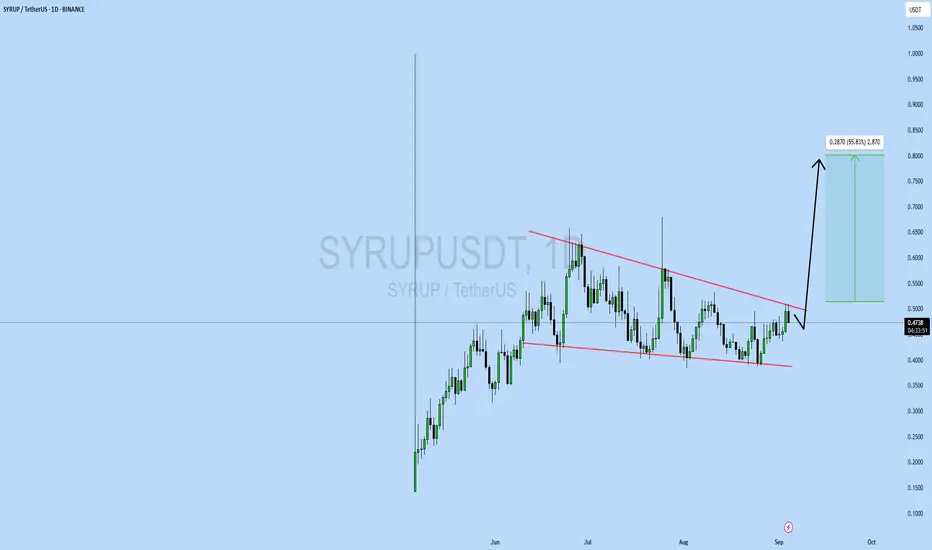
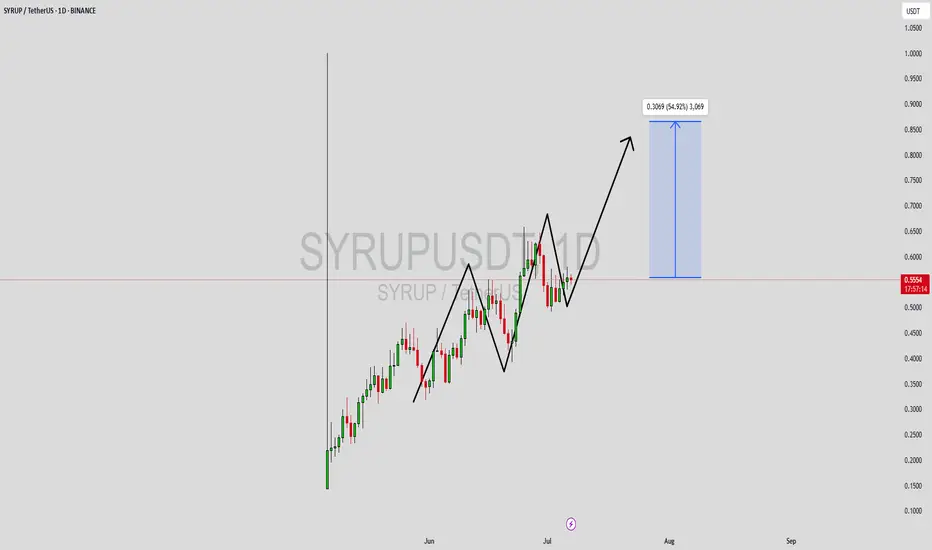
SYRUP Technical Setup
Pattern: Falling Wedge Pattern
Current Price: $0.4752
Target Price: $0.76
Target % Gain: 55.83%
Technical Analysis: SYRUP has confirmed a breakout from the falling wedge on the 1D chart, showing strength with momentum favoring bulls. A sustained close above resistance opens the path toward $0.76, supported by bullish price action.
Time Frame: 1D
Risk Management Tip: Always use proper risk management.
SYRUPUSDT trade ideas
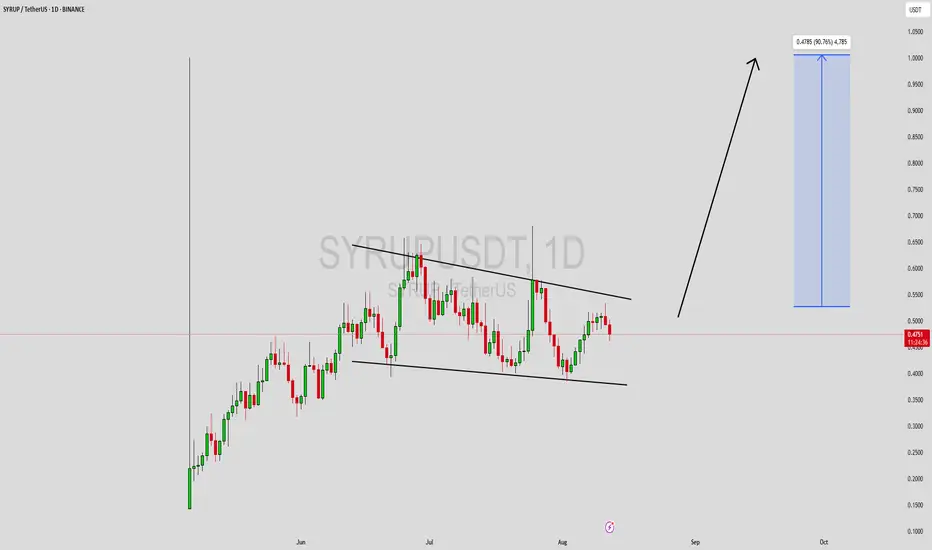
SYRUPUSDT Forming Falling WedgeSYRUPUSDT is currently displaying a strong falling wedge pattern, which is considered one of the most reliable bullish reversal signals in technical analysis. After an extended consolidation within the wedge, price action is tightening, suggesting that the downward pressure is losing strength. Historically, a breakout from this structure often leads to a sharp rally as momentum shifts in favor of buyers.
The trading volume on this pair remains steady, showing that accumulation is underway. A breakout from the wedge, supported by volume expansion, could potentially push SYRUPUSDT higher with an expected gain of around 90% to 100%+. This aligns with the projected target zone highlighted on the chart, making it an attractive opportunity for swing traders and investors tracking mid-term crypto setups.
Investor confidence is gradually increasing as this project gains visibility and traders recognize the bullish setup forming on higher timeframes. A successful breakout from the wedge could trigger a strong uptrend, driven by renewed buying interest and market sentiment favoring higher valuations.
In conclusion, SYRUPUSDT is at a critical point where a falling wedge breakout could fuel a significant bullish move. With good trading volume and improving investor interest, this pair has the potential to deliver notable upside performance in the coming sessions.
✅ Show your support by hitting the like button and
✅ Leaving a comment below! (What is You opinion about this Coin)
Your feedback and engagement keep me inspired to share more insightful market analysis with you!
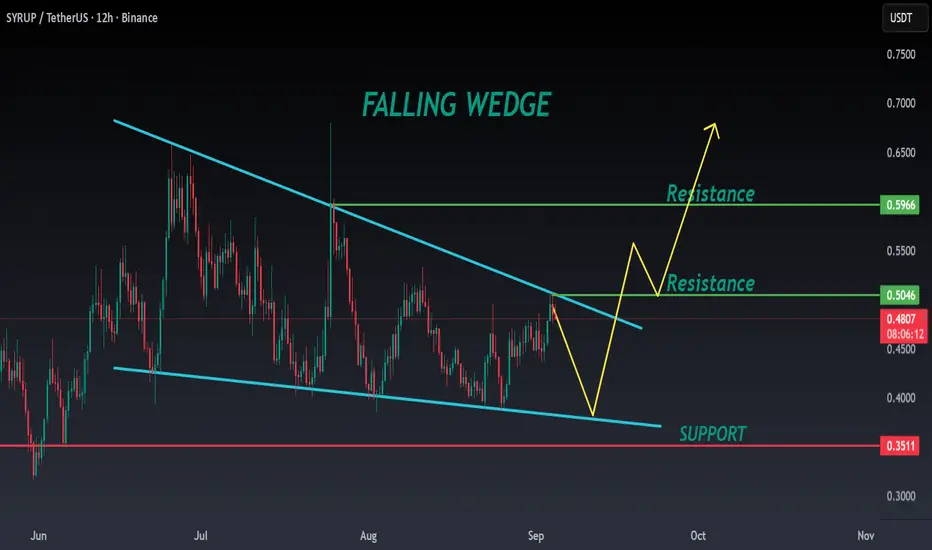
SYRUP ANALYSIS🔮 #SYRUP Analysis - Update 🚀🚀
💲 We can see that there is a formation of Falling Wedge Wedge Pattern in #SYRUP and we can see a bullish movement after a good breakout. Before that we would see a little retest and and then a bullish movement.
💸Current Price -- $0.4800
📈Target Price -- $0.5900
⁉️ What to do?
- We have marked crucial levels in the chart . We can trade according to the chart and make some profits. 🚀💸
#SYRUP #Cryptocurrency #Breakout #DYOR
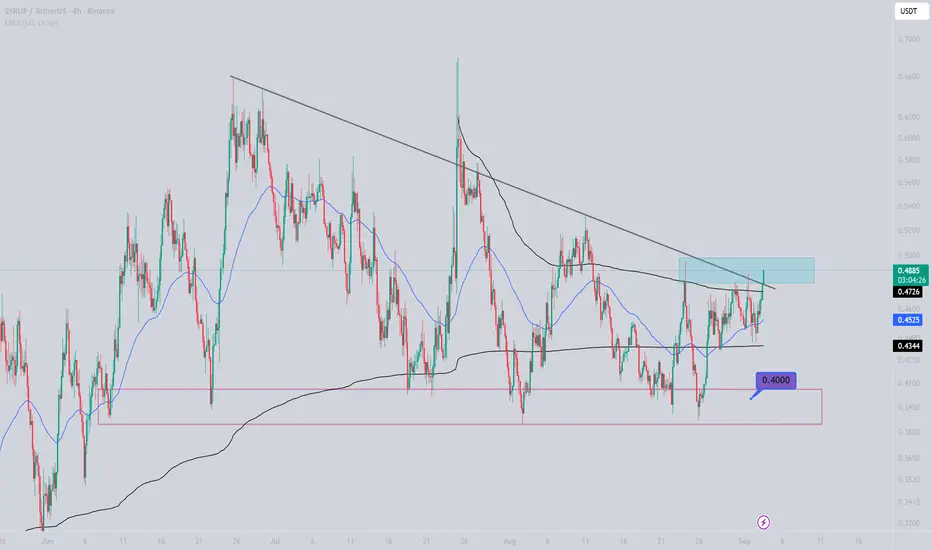
SYRUPUSDTAccording to the price chart, consolidation in the blue range in the above timeframe can be a confirmation for the growth of this currency.
The important ranges are 0.40 and 0.38, if it falls below these ranges, our optimism regarding this cryptocurrency will be lost and below these ranges we expect a deeper correction.
Don't forget risk and capital management and keep an eye on Friday's NFP data.
Best regards
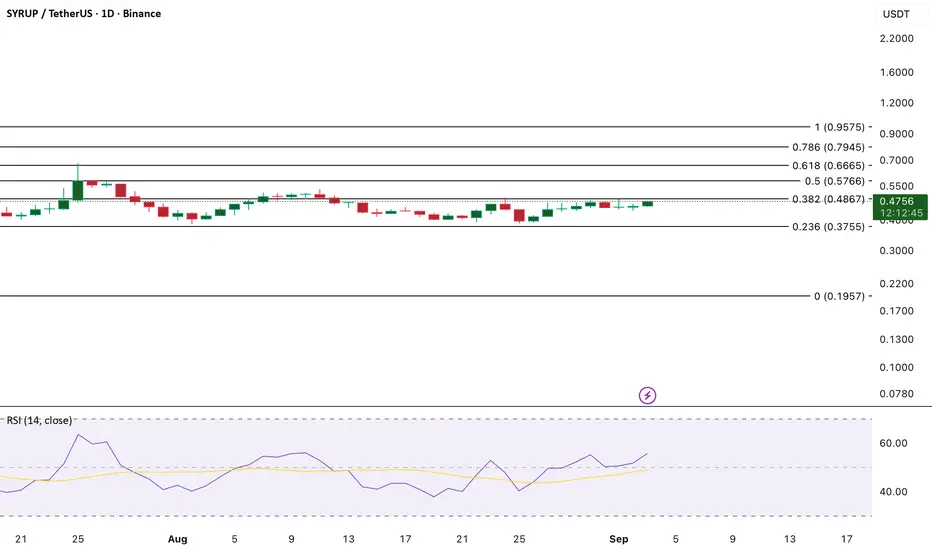
SYRUP Eyes Upside as RSI Suggests More Room to GrowSYRUP has posted a 5% gain in the past week, supported by a steadily rising RSI. Currently at 55.74, the RSI shows that the token is in an uptrend but still far from overbought territory. This leaves room for continued upside before hitting the exhaustion zone above 70.
If buying pressure persists, SYRUP could extend its gains in the near term. Conversely, a wave of profit-taking could see the token retrace.
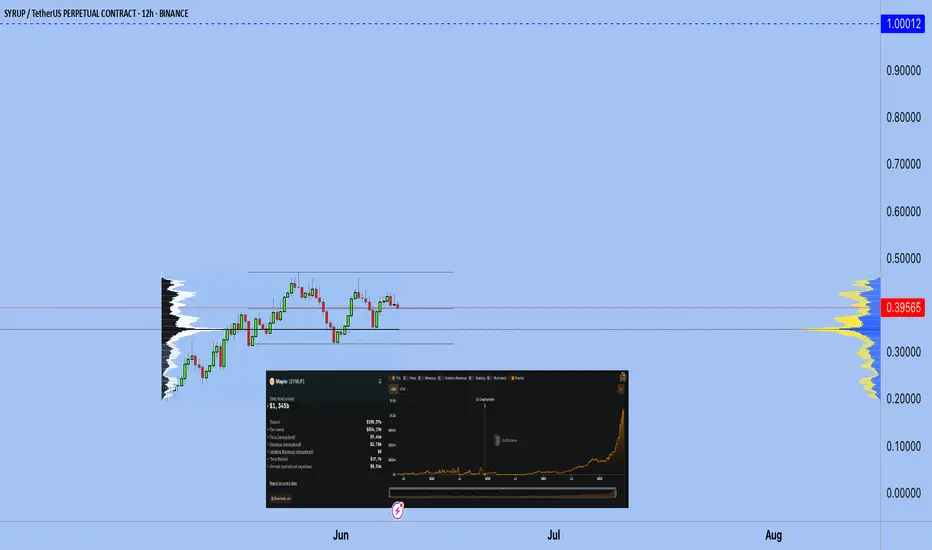
Maple Finance · Now New LowsNotice how Maple Finance (SYRUPUSDT) has been consolidating and yet produces no new lows—flat bottom.
The last four days have been closing green but Bitcoin has been dropping. Bitcoin has been dropping since 14-August, more than two weeks; why this disparity?
Why are some altcoins growing while Bitcoin retraces?
Why are so many altcoins breaking up and growing 50-100% in a single day? Some more, some less; but strong bullish breakouts are happening.
Notice that the projects retracing are those trading higher or near resistance.
Notice that the projects that are near support continue to build up strength even while Ether goes down short-term. Short-term because we obviously have a very strong rising trend.
ETHUSDT bottomed at ~$1,350 and after just a few months reached almost $5,000. No surprise if we see some sort of pause or stop. Same for Bitcoin, it has been growing for years, almost 3 years now since November 2022, the previous bear market bottom. While this is awesome, it isn't all.
See SYRUP here. Rising volume, moving above several moving averages, flat bottom and ready to grow. This is the same situation I am finding on hundreds of altcoins. It is as if the biggest explosion ever is about to take place.
It is amazing, but I will not be caught off guard. The proof is in the charts, hundreds of charts. And months the market moving either sideways or higher. This is all bullish consolidation in preparation of a major advance.
Namaste.
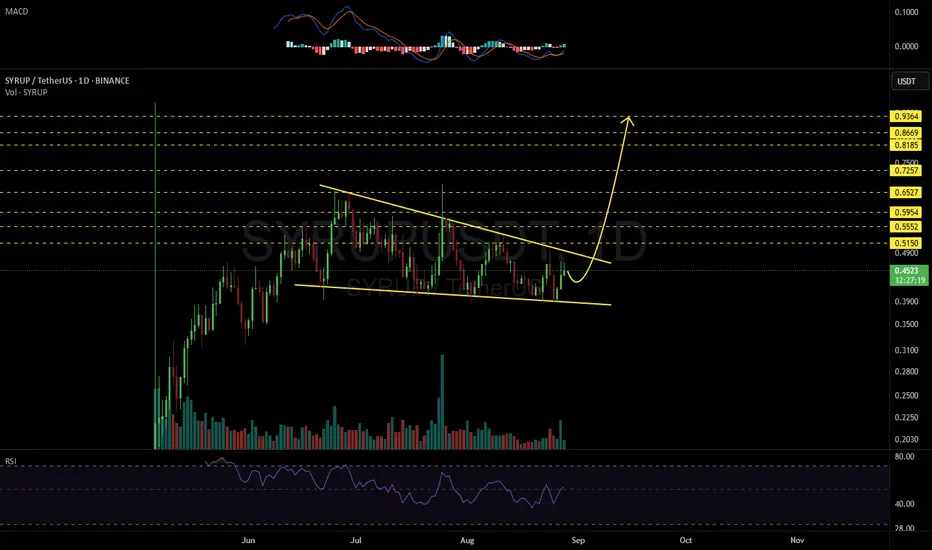
SYRUPUSDT 1D#SYRUP is moving within a falling wedge pattern on the daily chart. If it breaks out above the wedge resistance, the targets are:
🎯 $0.5150
🎯 $0.5552
🎯 $0.5954
🎯 $0.6527
🎯 $0.7257
🎯 $0.8185
🎯 $0.8669
🎯 $0.9364
⚠️ As always, use a tight stop-loss and proper risk management.
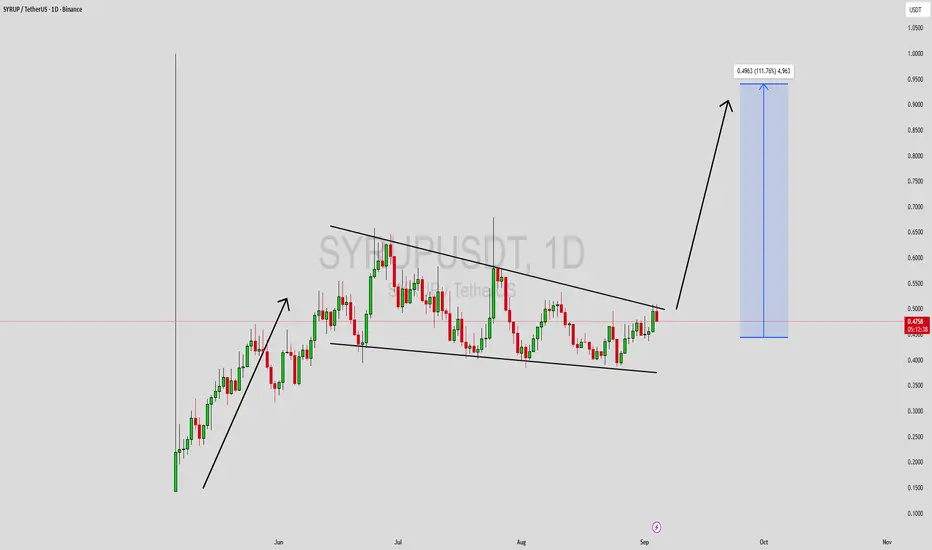
SYRUPUSDT Forming Falling WedgeSYRUPUSDT (Maple Finance) is emerging as a standout breakout candidate, supported by both powerful technical momentum and growing market enthusiasm. The recent rally of approximately 60% in just one month, fueled by a surge in futures open interest, underscores strong bullish conviction
The most compelling part of the setup is SYRUP’s falling wedge pattern, a classic bullish reversal formation characterized by converging lower highs and lower lows. Historically, such setups offer profitable upside breakouts, with measured projections often matching the estimated 80% to 90%+ gains you're tracking. A breakout above the upper trendline, ideally confirmed with volume, tends to trigger the next leg of the move.
Additionally, SYRUP has demonstrated notable performance despite a broader market slowdown, recently bucking the trend with a 23% surge following its listing on Upbit—backed by a spike in trading volume. Its ability to outperform peers in turbulent conditions adds weight to the bullish outlook.
The upside projection is supported by both chart structure and market dynamics. A confirmed wedge breakout could catalyze the targeted gains, potentially propelling the token toward higher price zones previously untested. If you're scouting for high-probability setups with attractive reward-to-risk ratios, SYRUP’s falling wedge backed by fundamental momentum makes it a compelling candidate.
✅ Show your support by hitting the like button and
✅ Leaving a comment below! (What is your opinion about this Coin)
Your feedback and engagement keep me inspired to share more insightful market analysis with you!
$SYRUPSee how sweet it looks when your analysis are respected🤩
This is BYBIT:SYRUPUSDT.P trade obeying every instructions.
Despite the slow movements, It never disrespects.
That impresses me.
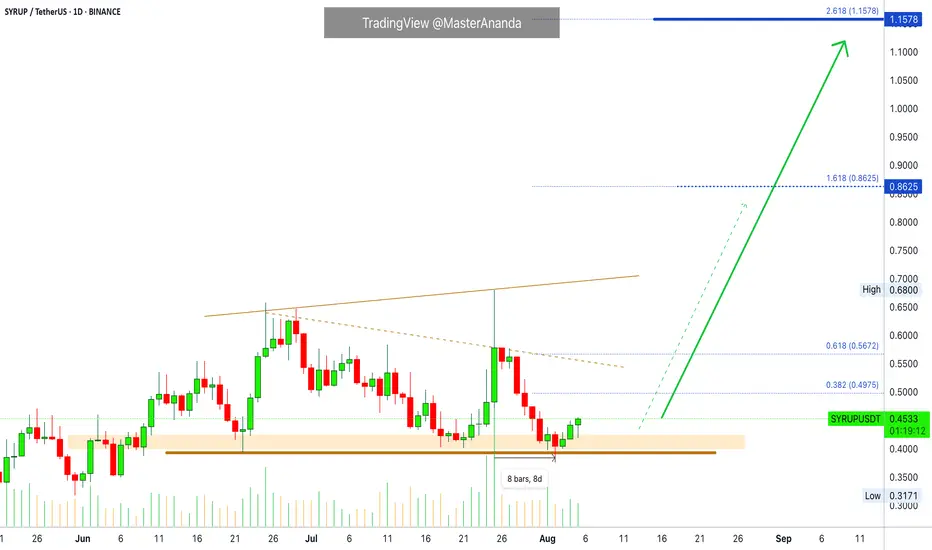
SYRUP · Higher & HigherI can see this one rising and rising and somehow I think I am not the only one that can see it. Can you see it? I see SYRUP going up and it is as if it is already happening.
Technical analysis
A several month long support is holding now. This support range was tested twice in the past and both times a bullish move developed. Now is the third time and after this support zone was activated SYRUPUSDT has been closing green. Today will be the third green day and when this happens we know what happens and what happens is that the market tends to grow really strong in the ensuing days. It gets bigger and bigger and it happens all the time. It happens after the correction or retrace ends.
A retrace just ended lasting a total of 8 days. From 25-July through 2-August. A very short retrace but the next will be a higher high and the bullish wave will be nothing like the retrace. The bullish side is many times stronger and the market will blow up next. It can take some time to start but as momentum grows, expect to see a pattern of rising prices.
Thank you for reading.
Namaste.
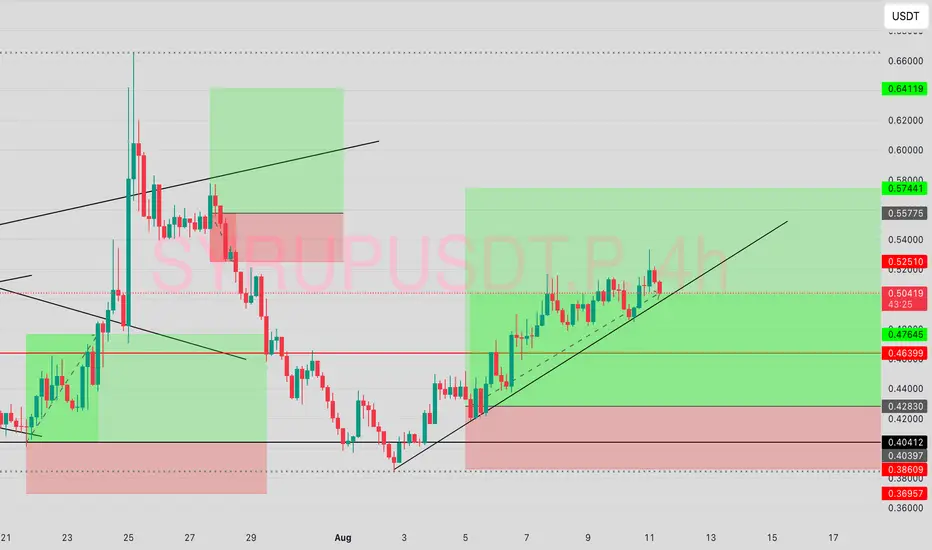
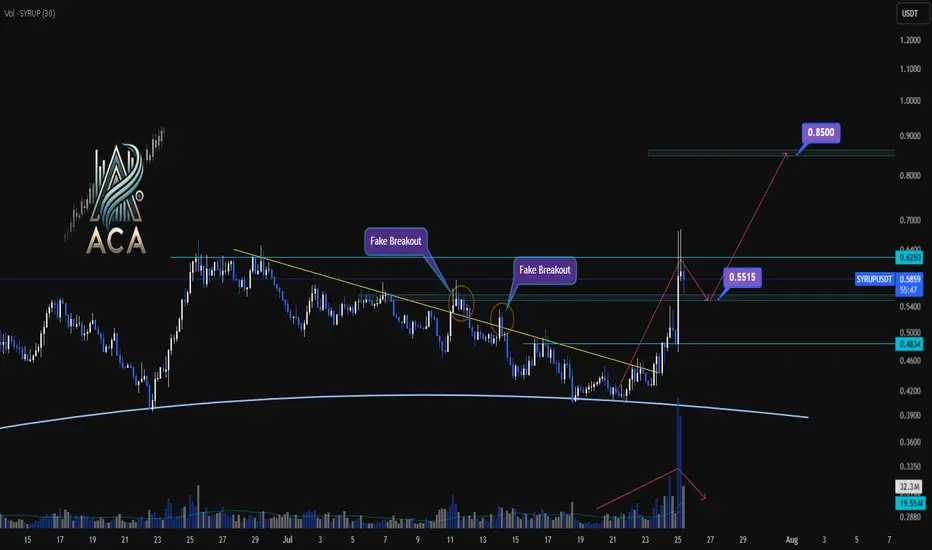
SYRUPUSDT 4H Chart Analysis | Trendline Breakout & Next MovesSYRUPUSDT 4H Chart Analysis | Trendline Breakout & Next Moves
🔍 Let’s break down the latest action on the SYRUP/USDT 4H chart and pinpoint what comes next as trend and momentum cues line up for traders.
⏳ 4-Hour Overview
- The recent breakout above the key trendline was backed by a surge in volume, providing clear momentum confirmation and pushing price toward resistance.
- Price has already reached 1.5R of the initial breakout target, a strong sign the trend is in motion.
- Upon touching the $0.6250 resistance, momentum cooled, with volatility decreasing — a classic consolidation phase after a high-energy move.
🔻 Correction & Structure
- With volume subsiding and momentum slowing post-$0.6250, we’re now expecting a corrective move down toward $0.5515.
- This retracement zone will be critical to watch for higher low formation – a bullish structural signal if supported by volume confirmation.
🔺 Long Setup:
- Should SYRUP reclaim and break above $0.6250 after setting a higher low at $0.5515, and with renewed volume, we could see another strong leg higher.
- The next major resistance sits around $0.85 — this aligns as a logical upside target based on the range extension.
📊 Key Highlights:
- Trendline breakout with sharp volume spike = momentum confirmation.
- 1.5R reached before first deep pullback; structure remains bullish above $0.5515.
- Watch for a higher low and subsequent break of $0.6250 with volume to confirm the next move to $0.85.
🚨 Conclusion:
SYRUP’s chart is at a pivotal juncture: a constructive pullback to $0.5515 could set up the next wave higher if supported by volume. A confirmed breakout above $0.6250 targets $0.85 — stay patient and wait for volume signals at key levels.
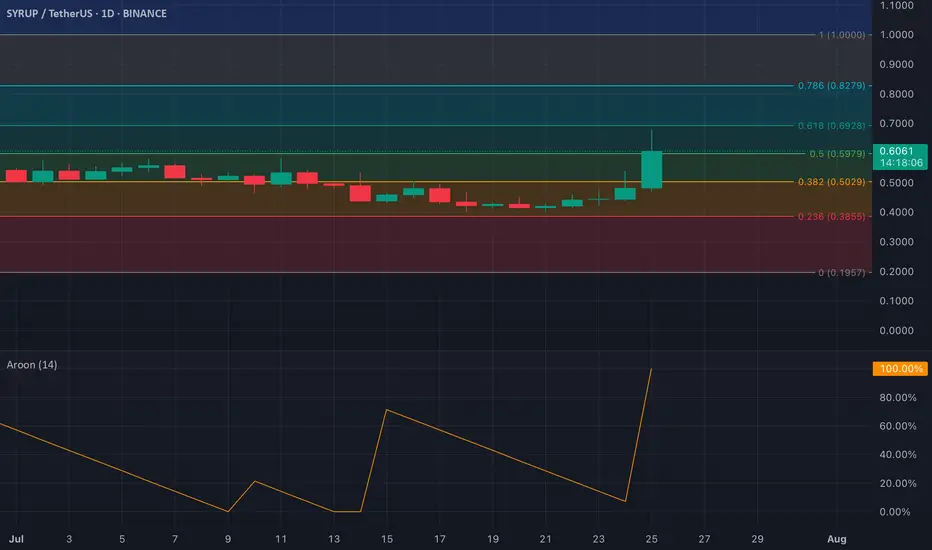
SYRUP: Strong Uptrend Confirmed by Aroon IndicatorSYRUP continues to flash bullish signals, with its Aroon Up line currently at 100%—a level that reflects strong buying momentum and suggests the uptrend is likely to persist. The Aroon indicator, a popular trend-following tool, tracks how recently an asset has recorded new highs or lows to gauge trend strength and direction.
A 100% Aroon Up reading typically signals that the asset has recently posted a new high, reinforcing the presence of sustained buy-side pressure. In SYRUP's case, this aligns with its recent breakout to a fresh local high, further boosting traders' confidence in the current rally’s momentum.
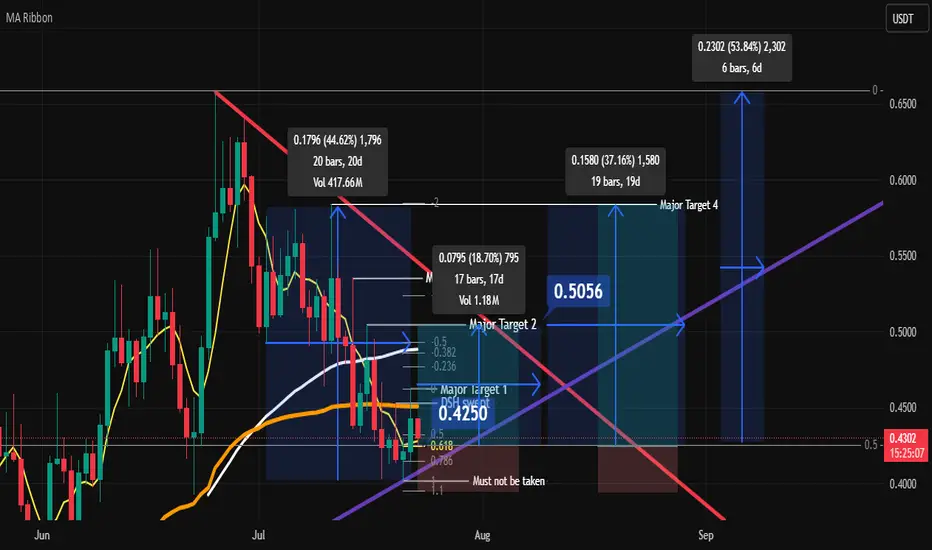
SYRUP 18% in 18 Days? Or 37% in 40?📘 Can SYRUP Do 18% in 18 Days? Or 37% in 40?
Spot Trade Journal
Entry: $0.4250
Target 1: $0.50 (+18%)
Target 2: $0.5830 (+37%)
Target 3 (Grand Slam): $0.6575 (+50%)
🧠 Idea Behind the Trade
“1% a day can change my life.”
Holding goal: 18% in 18 days, or 30–40% in 40 days
Possible extended hold: 50% in 60–90 days
✅ Entry Confluences
✅ Daily close above 5-day MA
✅ Price below anchored VWAP from initial pump
✅ Price below 50 SMA
✅ Daily swing high swept, now retracing
✅ Price sitting at 50% equilibrium of asset’s lifetime range
→ Same zone as daily swing structure = dual confluence
🛑 Invalidation & Risk
❌ Trade idea invalidated if current daily swing low breaks
⚠️ Concern: Deeper retrace toward 0.618 of lifetime range would mean drawdown
🧩 If swing low holds and higher highs form → will add to position and possibly adjust targets
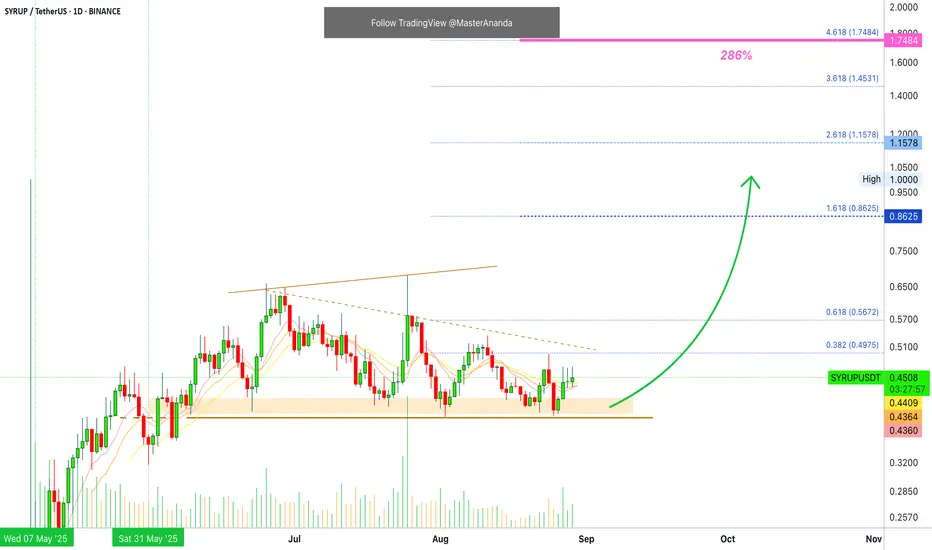
Syrup looks ready to start moving towards new ATH'sCRYPTOCAP:SYRUP has started to break out of its downtrend after revisiting the June lows. It has outperformed most of the market since April, with this month's pullback being an exception. I expect an aggressive move up into new highs. The fibs around $1 look like a good target for the short term, this would also be ~1b mc.
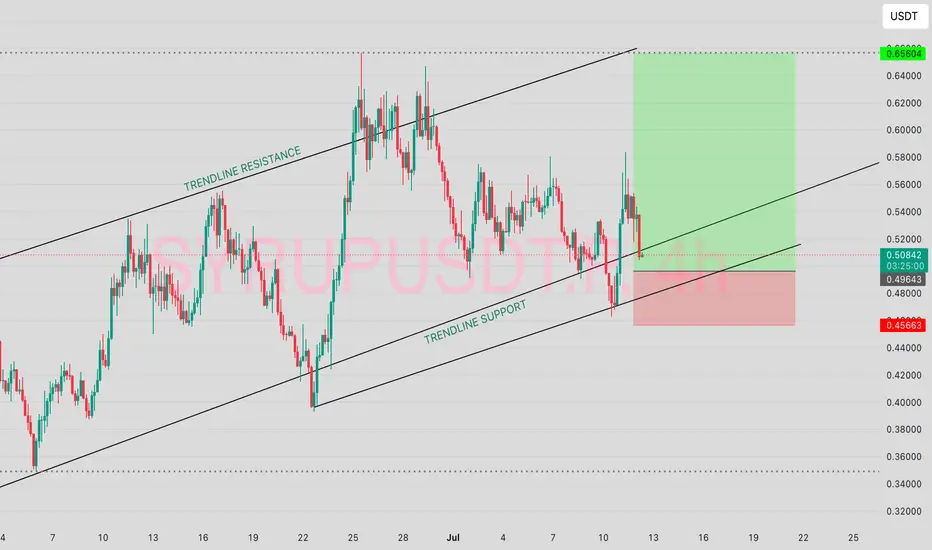
$SYRUP TRADE, BULLISH?This is my setup for the BYBIT:SYRUPUSDT.P trade. having respected the previous Trendlines, i would expect same with higher target.
I have set my target between the higher trendline and lower trendline of the support.
I'm afriad I won't be picked but if the trades gets me into the trade, then I'll feed good.
I'm nearly certain!
#NFA #DYOR
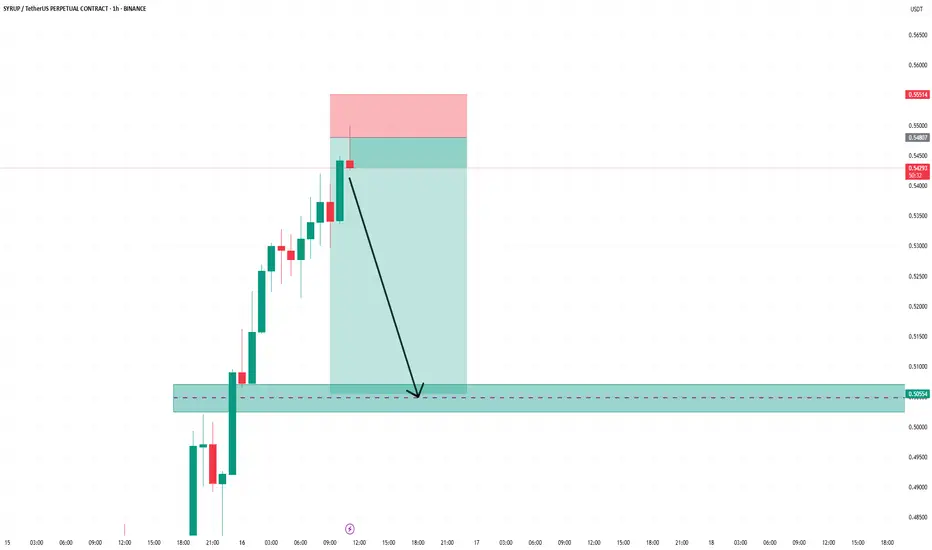
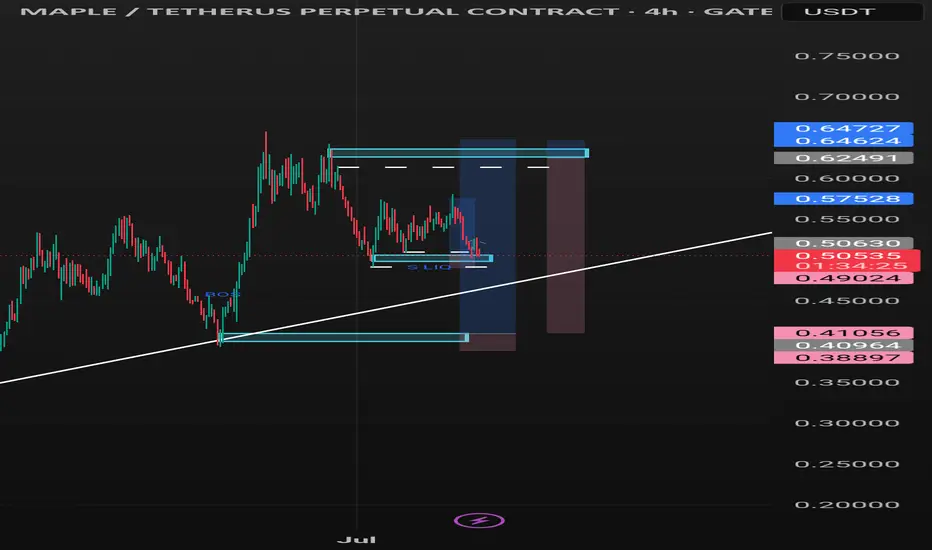
Possible upside before selling.If price holds above 0.50572, rhen we expect a push towards the previous high, then a sell that's will take it to the trendline. However if price cannot hold that support, then we expect a sell to continue as there's a trendline breakout and retest below around 0.49024
SYRUPUSDT Forming Upward ChannelSYRUPUSDT is catching the eyes of crypto traders with its steady climb and promising technical structure. The current chart shows that SYRUP is building a healthy upward channel, with good volume supporting the recent price action. This setup suggests that the pair could be preparing for another leg up, with an expected gain of around 40% to 50% from the current levels. Such potential upside makes SYRUPUSDT an attractive candidate for swing traders and medium-term investors looking for trending opportunities in the altcoin market.
SYRUP is gaining momentum as more investors begin to notice its unique project fundamentals and community-driven growth. As liquidity flows into this token, it adds further fuel to the rally, increasing the chances of sustained bullish momentum. This price action also reflects growing confidence among investors, which is crucial for any coin attempting to break out from key resistance levels. Watching how the price reacts to upcoming retests of support zones will be important for confirmation of the next move.
On the technical side, SYRUPUSDT appears to be forming a series of higher highs and higher lows, a classic sign of an established uptrend. If the token continues to respect its trendline support and buyers step in at pullbacks, there is a high probability that the projected target can be reached within a few weeks. Keep an eye on volume spikes and breakout candles for the best entry opportunities. The combination of positive market sentiment and strong chart structure makes SYRUP a token worth tracking closely.
✅ Show your support by hitting the like button and
✅ Leaving a comment below! (What is You opinion about this Coin)
Your feedback and engagement keep me inspired to share more insightful market analysis with you!
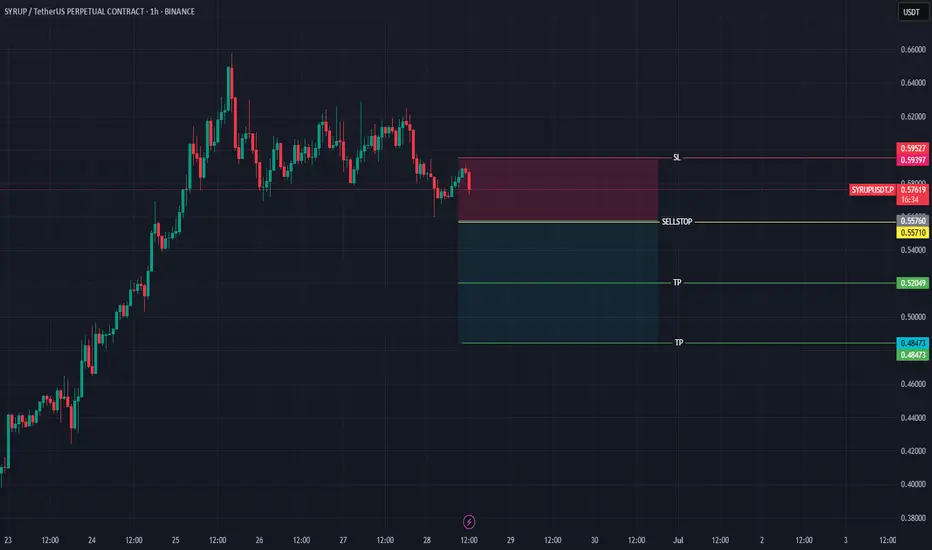
SYRUPUSDTBearish Trend continuation
SellStop and SL are mention on the chart
Note: Please move your SL to EP after TP1
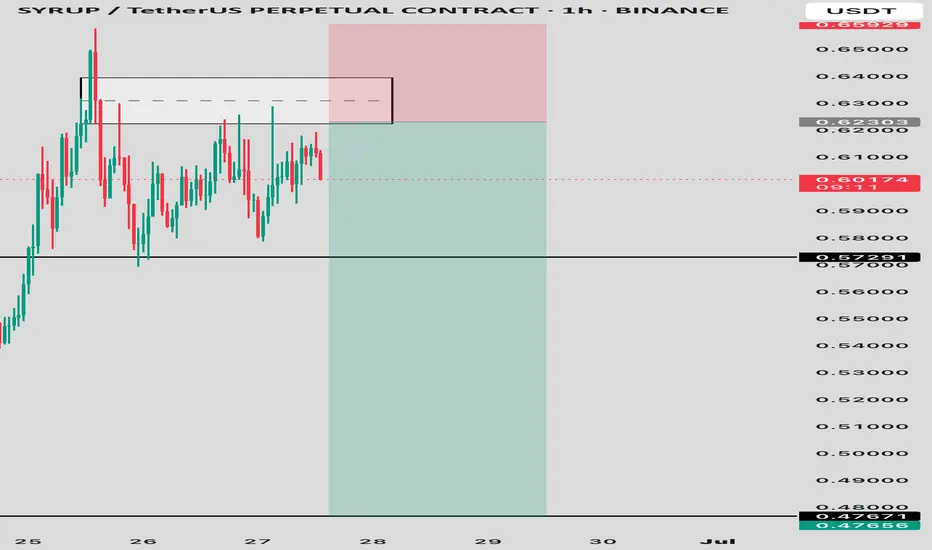
SYRUP/USDT – 1H AnalysisSYRUP has recently tapped into a major resistance zone around 0.6230, showing multiple rejections with long wicks and sharp sell-offs. This price area has acted as a supply zone, indicating strong seller presence.
Key Levels:
• Entry (supply zone): 0.62303
• First Target: 0.57291 – minor support / previous structure level
• Final Target: 0.47671 – major demand zone
• Invalidation / SL: Above 0.6580
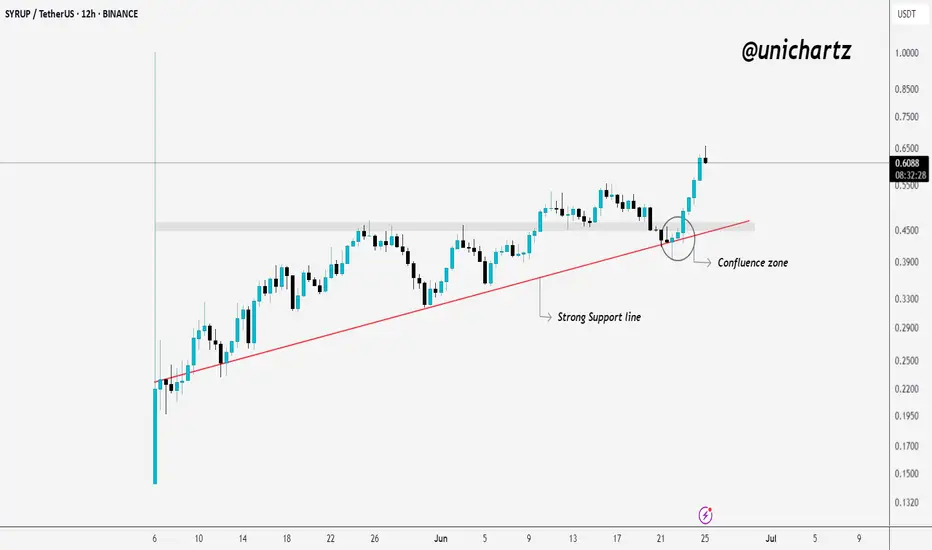
SYRUP Bounces from Confluence Zone – Bullish Continuation?SYRUP bounced cleanly from the confluence zone — where trendline and support aligned. Bulls stepped in fast.
As long as it holds above trendline, upside continuation is likely.
Wait for retest or structure before chasing.
DYOR, NFA
$SYRUP (formerly Maple): An Institutional-Level RelaunchMassive Reload: Brand, Token, Architecture
In May, the migration from MPL - SYRUP was completed, with the final 48-hour window taking place from May 19-21, 2025.
All products (syrupUSDC, syrupUSDT, etc.) have been integrated into the Maple ecosystem.
The Syrup.fi platform has been shut down. Unclaimed MPL tokens were redirected to the Syrup Strategic Fund (SSF) to support ecosystem liquidity and growth.
Key Developments & Growing Institutional Trust
Cantor Fitzgerald launched a $2B BTC lending program in partnership with Maple and FalconX (May 27) - a clear vote of confidence from the institutional world.
TVL has exceeded $1.6B, with nearly $1B in active loans - a significant milestone in the DeFi space.
Maple is expanding into Solana, launching syrupUSD:
Over $30M deployed already.
Additional $500K in incentives announced.
Chainlink CCIP is used for cross-chain communication between EVM and Solana ecosystems.
Analysis & Outlook: What the Structure Tells Us
Financial Infrastructure
Strong fundamentals: massive TVL growth and deep institutional participation.
Diversified architecture: Ethereum, Solana, and CEX liquidity all integrated into one unified system.
Behavioral & Market Signals
Despite temporary drops in on-chain activity and reduced whale holdings, the system’s DeFi structure remains robust and functional.
A short-term correction may occur due to whale profit-taking — potentially a great entry point.
What’s Next?
The launch of lstBTC — a compliant BTC yield solution — could be the next big catalyst.
Deeper Solana integration is likely to unlock new liquidity and broader user adoption.
Right now, we’re in the quiet build-up phase — when markets are silent, but infrastructure is forming. These are the moments where the best positions are taken.
I expect 1-1.4$ for 1 SYRUP
Best regards EXCAVO
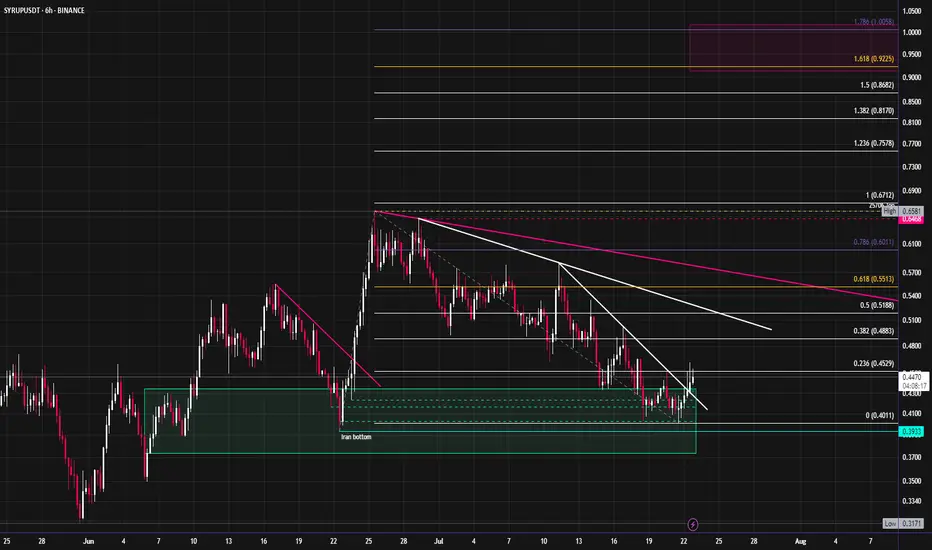
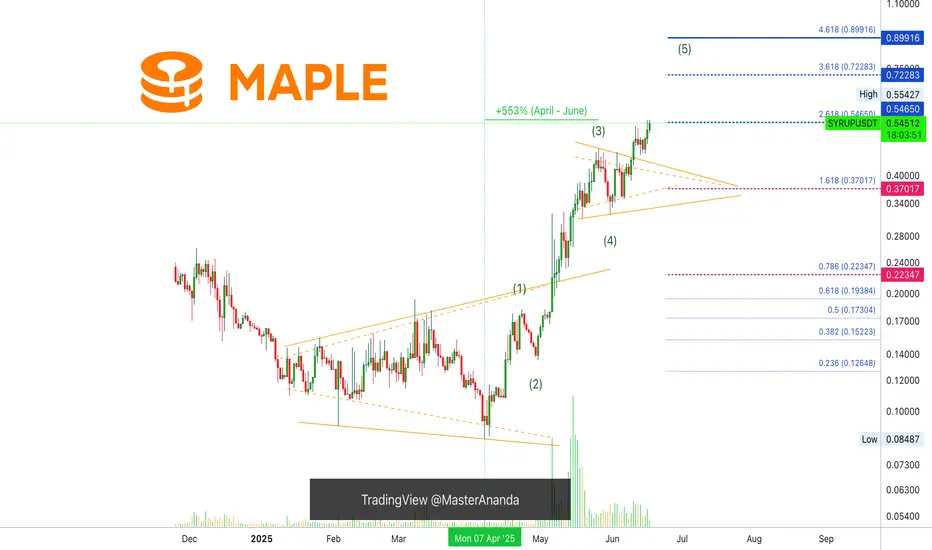
Maple (SYRUP) Bullish Impulse, Final Target & Correction Support+553% since its 7-April bottom, but the third wave is already in. Notice how the volume is super high until 15-May but then it drops as prices continue higher. This means that only the fifth wave remains. After the completion of the fifth wave there should be a correction before additional growth.
The two main targets for this current bullish impulse are shown on the chart but it can go higher of course. A number came up around $1.23 but this chart is just too young.
Once the correction starts, the main support will be where the 1.618 Fib. extension is now. Can wick lower but the 0.786 isn't likely to be tested. Maple Finance SYRUP.
Namaste.
SYRUPUSDT.P - make a All Time High - SYRUPUSDT.P - make a All Time High now market
My Profit Area 0.50300