AMP Futures - How to enable the floating data window.In this idea we will demonstrate how to access the new floating data window using TradingView.
UNFM2026 trade ideas

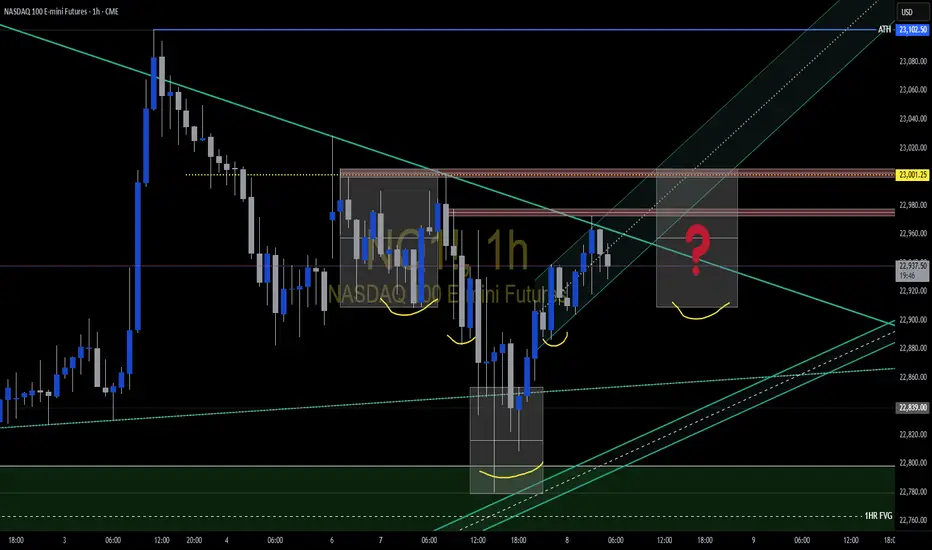
NQ Range (07-08-25)White arrow is stall/drop zone and yellow is strong short. The O/N continues to reset any drops that happen in most Reg Sessions. It appears to me that a weak/fake Euphoric Stage is being played out. The idea of chasing the NAZ (after the O/N redirect) is the game, no chase and the game will end. The O/N has been redirecting for about 2 years (can continue). Again, the recent 25% drop was erased with a Tweet & news release (10 min 2,000 point) move and a few O/N's. Just feels like a fake chase play since the pop of the bottom.
NQ Short (07-14-25)The NAZ appears to be due for a Drop Test back inside the lower range. F-M Long play and O/N lift moves seem to be loosing their effectiveness. Looking for a 22,300-200 target on drop and if not, look for U Turn under 23,300.
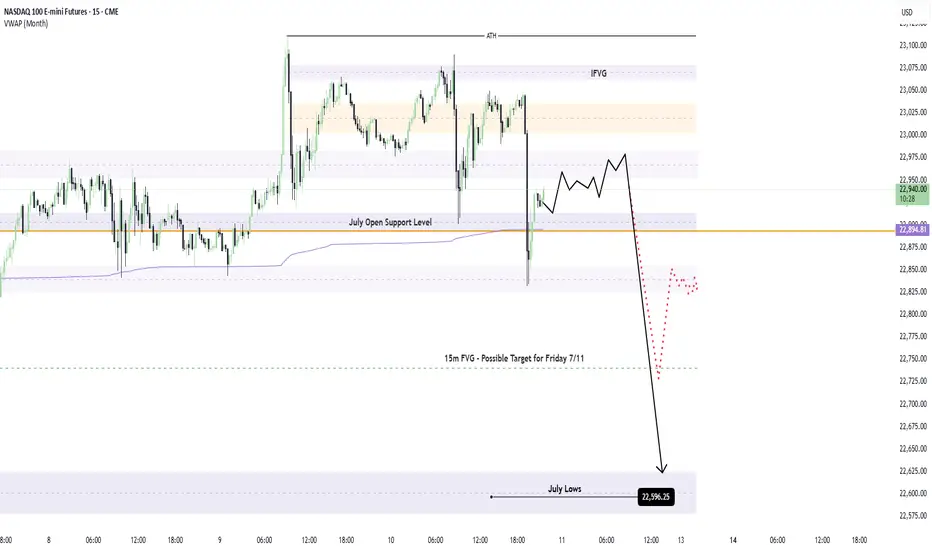
A Bearish July for Nasdaq?I hadn’t anticipated the -212 point move unfolding during the After Hours session—I'd mapped that reaction for the upcoming New York AM session open. That said, with momentum already in play, I’m maintaining my short bias. Price appears poised to revisit the July lows, with a high probability of trading through them and pressing further beneath the Monthly VWAP. I’m eyeing continuation to the downside as long as structure confirms the move.
Trade idea - Powell concept
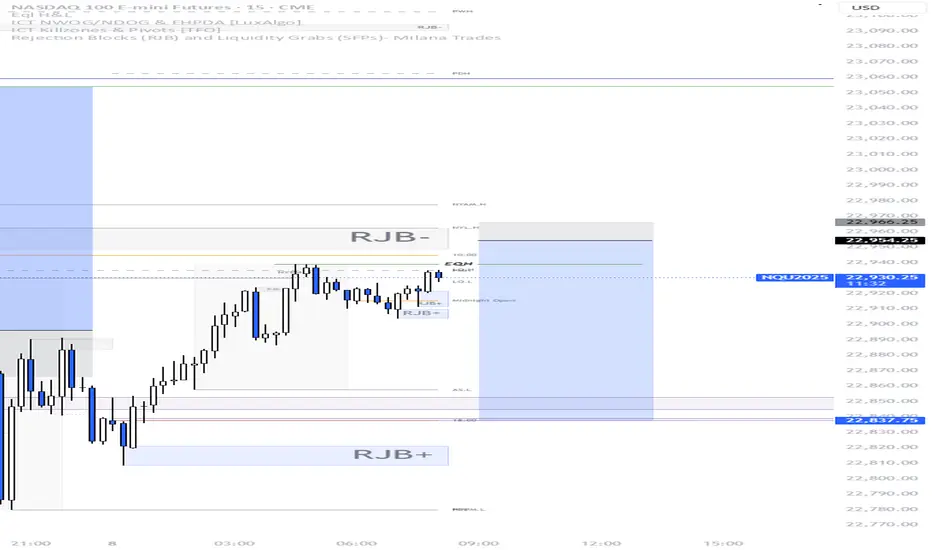
Bearish Bias coming into the day, had a low close Previous day. PXL & PXH indicates price will go lower.
IF we take out the EQH and tap the rejection block, i would not be mad to take a short there. Targeting NDOG, not mad if it gonna be a lose either :)
NASDAQ: Time For A Pullback?In this Weekly Market Forecast, we will analyze the NASDAQ for the week of July 14 - 18th.
The NASDAQ had a strong week, until Tariff Tensions Friday arrived.
This by itself doesn't mean we should start looking for sells. Just like the S&P 500, I'm expecting short term bearishness, as price goes from ERL to IRL.
With Tuesday CPI Data coming, this short term consolidation is to be expected until the news is announced.
Let the markets pick a direction, and flow with it.
Have a plan of action in place so you can react to the price action promptly!
Enjoy!
May profits be upon you.
Leave any questions or comments in the comment section.
I appreciate any feedback from my viewers!
Like and/or subscribe if you want more accurate analysis.
Thank you so much!
Disclaimer:
I do not provide personal investment advice and I am not a qualified licensed investment advisor.
All information found here, including any ideas, opinions, views, predictions, forecasts, commentaries, suggestions, expressed or implied herein, are for informational, entertainment or educational purposes only and should not be construed as personal investment advice. While the information provided is believed to be accurate, it may include errors or inaccuracies.
I will not and cannot be held liable for any actions you take as a result of anything you read here.
Conduct your own due diligence, or consult a licensed financial advisor or broker before making any and all investment decisions. Any investments, trades, speculations, or decisions made on the basis of any information found on this channel, expressed or implied herein, are committed at your own risk, financial or otherwise.

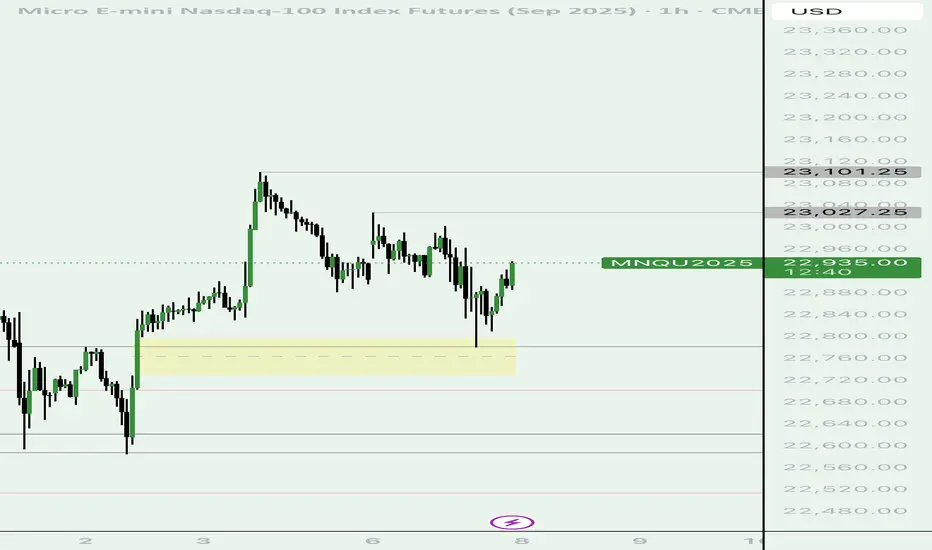
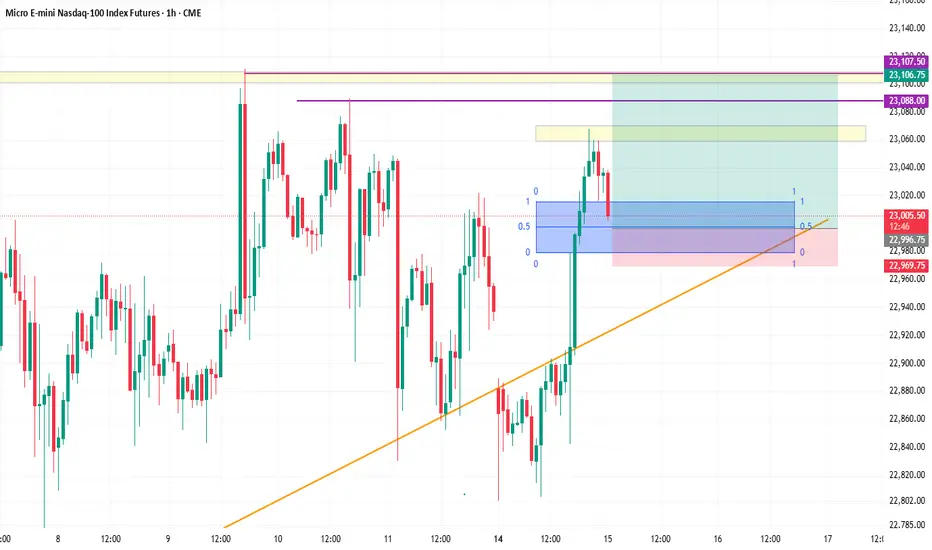
If we are still bullish futures look to expect these levels. If we are still trending bullish a return back to the old gap low found in the fib & the fvg within the 1hr time fractal .. with a continuation of higher futures - we can see the level delineating in gray lines are my upside targets to see want to reprice to in a order to continue higher.
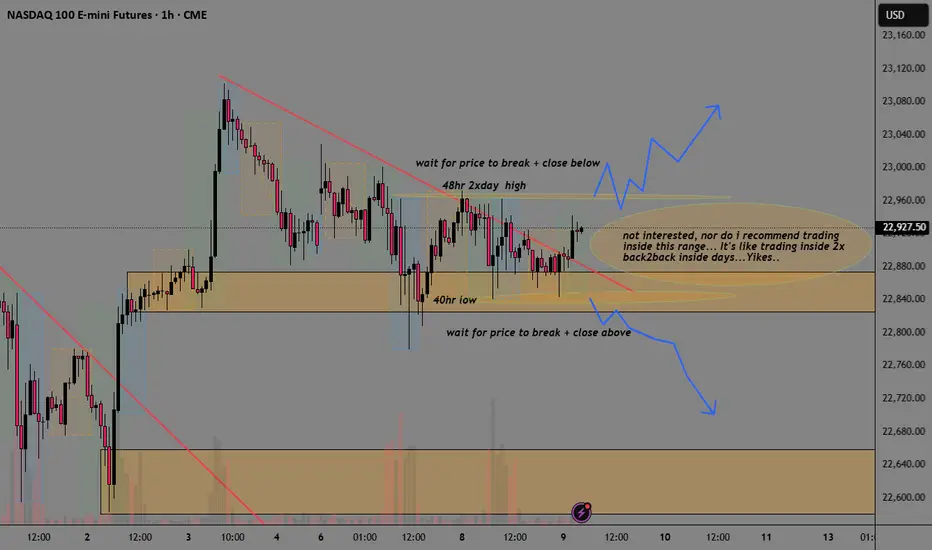
NQ Analysis ICT Liquidity Search Break-Out TradePrice is expected to open not just 1, but inside 2 previous days.
We have 2 options:
1) ICT silver bullet up my bum trader strategy traders are waiting
for liquidity search breaking highs or lows then reversing.
2) Break-out trades waiting for price to break and close above or below
24hour range and trade in direction of break-out.
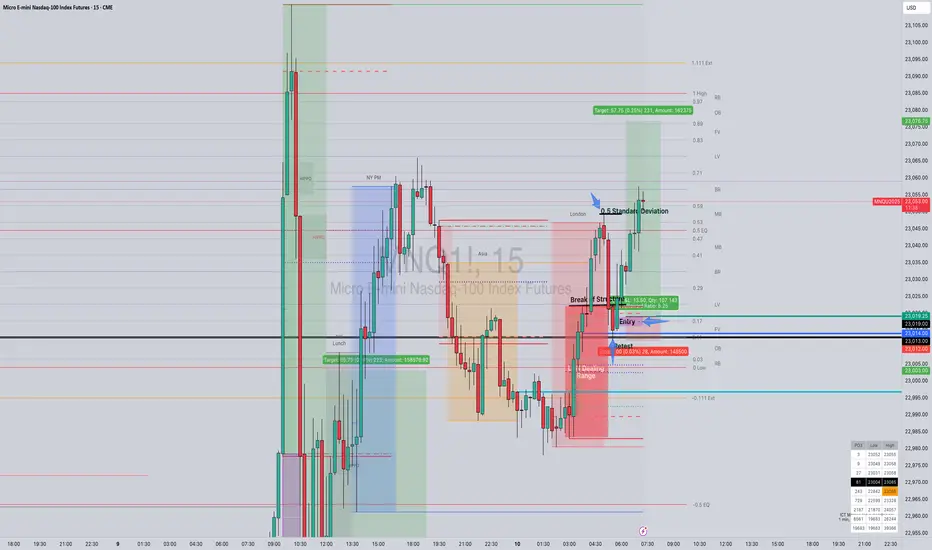
Trade Journal Entry MNQ1! – Micro E-mini Nasdaq-100 Futures
Trader: Lord MEDZ
Date: Thursday, July 10, 2025
Instrument: MNQ1! – Micro E-mini Nasdaq-100 Futures
Timeframe: 5-Minute Chart
Strategy: Master OD + IDR + DR Setup
Entry Model: Goldbach PO3 81 | M1 + FVG Confluence
🧠 Narrative & Trade Idea
This setup was based on the Master OD, Initial Dealing Range (IDR), and Dealing Range (DR) model, incorporating a Goldbach PO3 81 entry on the 1-minute chart with a confirmation retest.
London Dealing Range (LON DR) was established, followed by a Break of Structure (BoS) confirming bullish intent.
Price extended to 0.5 Standard Deviation, where profit-taking and a pullback were expected.
The pullback offered a retest of the DR high and tapped into a 1-minute Fair Value Gap (FVG) – key for PO3 81 entries.
Price also interacted with an Order Block (OB) confluence around 23,011.
Trade entry was executed cleanly with tight risk and high R:R logic.
📍 Execution Details
Entry: 23,019.00
Stop Loss: 23,011.00
Target: 23,077.00
Risk: 8.00 pts
Reward: 58.00 pts
Position Size: 12 contracts
Total Risk: $148.50
Total Reward Potential: $1,623.75
Risk/Reward Ratio: 1:8.22 ✅
🔍 Technical Confluences
✅ Clean Break of Structure from LON DR highs
✅ Retest of DR zone aligned with 1-min Fair Value Gap
✅ Price tapped into Order Block + PO3 81 criteria met
✅ Entry model: Precision M1 PO3 81 + 1m/5m alignment
✅ Target aligned with premium OB zone + 1.0 ext level
📈 Trade Outcome & Lessons
The execution respected both structure and order flow principles.
PO3 81 delivered textbook performance off the retest.
Strong emotional discipline shown by holding for full R:R.
Setup validated the predictive strength of the Master OD + IDR system with Goldbach’s entry logic.
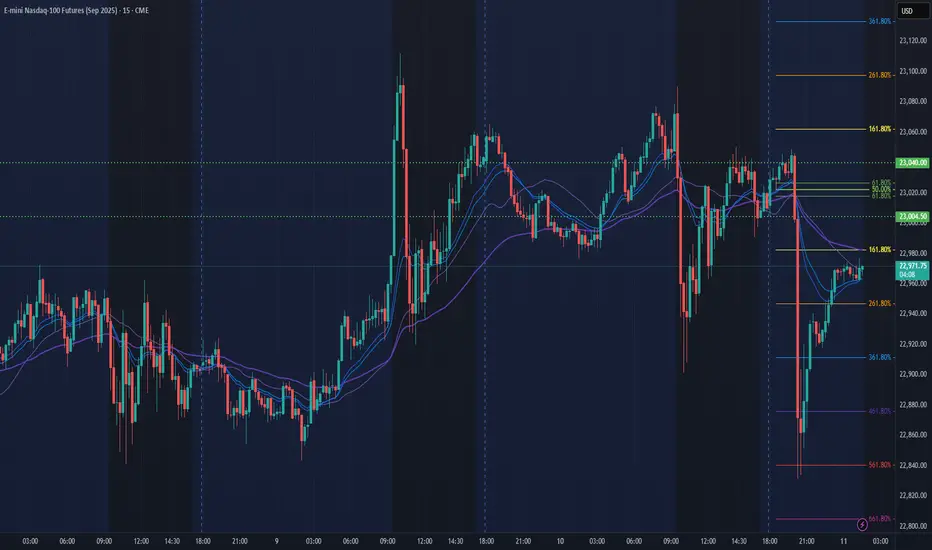
NQ Power Range Report with FIB Ext - 7/11/2025 SessionCME_MINI:NQU2025
- PR High: 23039.75
- PR Low: 23004.50
- NZ Spread: 78.75
No key scheduled economic events
High 200+ range volatility during Asian hours
Session Open Stats (As of 1:35 AM 7/11)
- Session Open ATR: 301.79
- Volume: 48K
- Open Int: 268K
- Trend Grade: Neutral
- From BA ATH: -0.6% (Rounded)
Key Levels (Rounded - Think of these as ranges)
- Long: 23239
- Mid: 21525
- Short: 20383
Keep in mind this is not speculation or a prediction. Only a report of the Power Range with Fib extensions for target hunting. Do your DD! You determine your risk tolerance. You are fully capable of making your own decisions.
BA: Back Adjusted
BuZ/BeZ: Bull Zone / Bear Zone
NZ: Neutral Zone
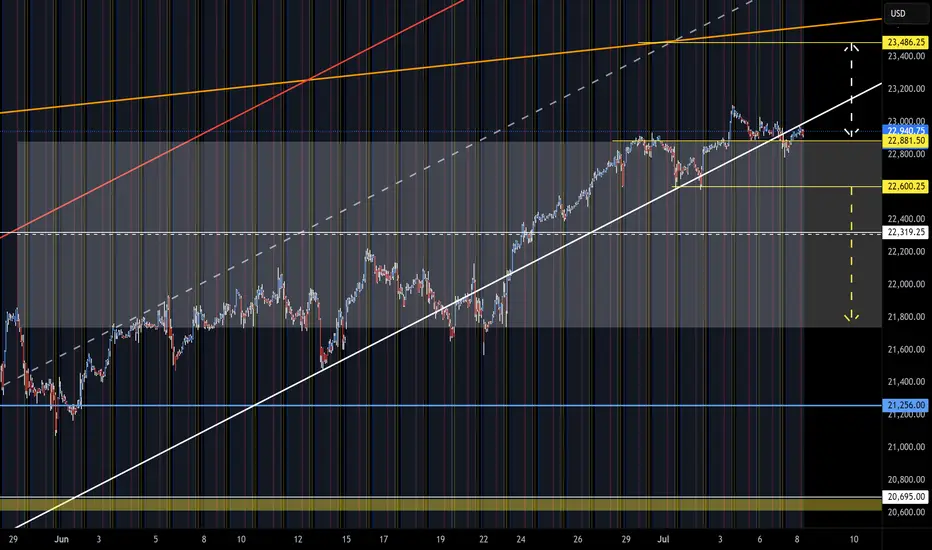
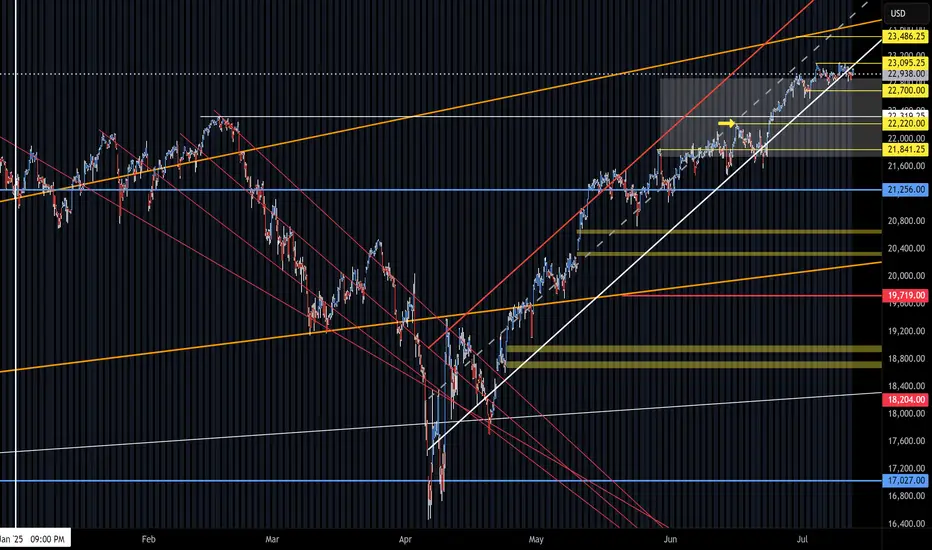
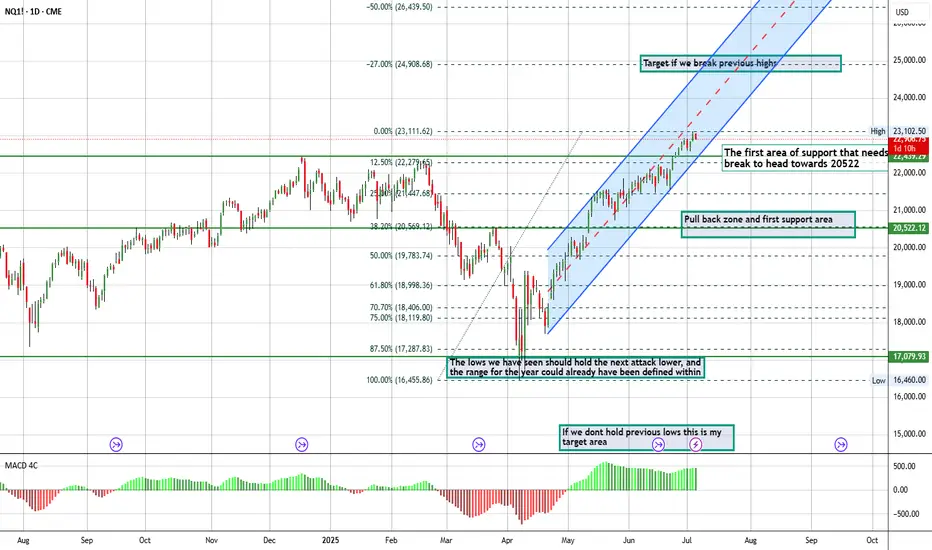
What next for the NQ Futures I updated a chart I published a month ago, when I believed we were in a correction and would not make new highs yet. We have and believe that we will see a correction from here into the end of September 2025, before we can again post gains going into the 4th quarter.
July 7 - 11: Buy Stock Indices DIPs! Watch For Gold, Oil FVGs!In this Weekly Market Forecast, we will analyze the S&P 500, NASDAQ, DOW JONES, Gold and Silver futures, for the week of July 7 - 11th.
Stock Indices are strong, so dip opportunities should present themselves next week.
Gold is bullish-neutral. Could see strength enter this market as July 9th approaches.
Silver is bullish. No reason to short it.
Oil is in a Monthly +FVG. If the FVG fails, it will confirm bearishness. Couple that with the fundamentals, I am watching for that confirmations to sell US Oil.
Enjoy!
May profits be upon you.
Leave any questions or comments in the comment section.
I appreciate any feedback from my viewers!
Like and/or subscribe if you want more accurate analysis.
Thank you so much!
Disclaimer:
I do not provide personal investment advice and I am not a qualified licensed investment advisor.
All information found here, including any ideas, opinions, views, predictions, forecasts, commentaries, suggestions, expressed or implied herein, are for informational, entertainment or educational purposes only and should not be construed as personal investment advice. While the information provided is believed to be accurate, it may include errors or inaccuracies.
I will not and cannot be held liable for any actions you take as a result of anything you read here.
Conduct your own due diligence, or consult a licensed financial advisor or broker before making any and all investment decisions. Any investments, trades, speculations, or decisions made on the basis of any information found on this channel, expressed or implied herein, are committed at your own risk, financial or otherwise.

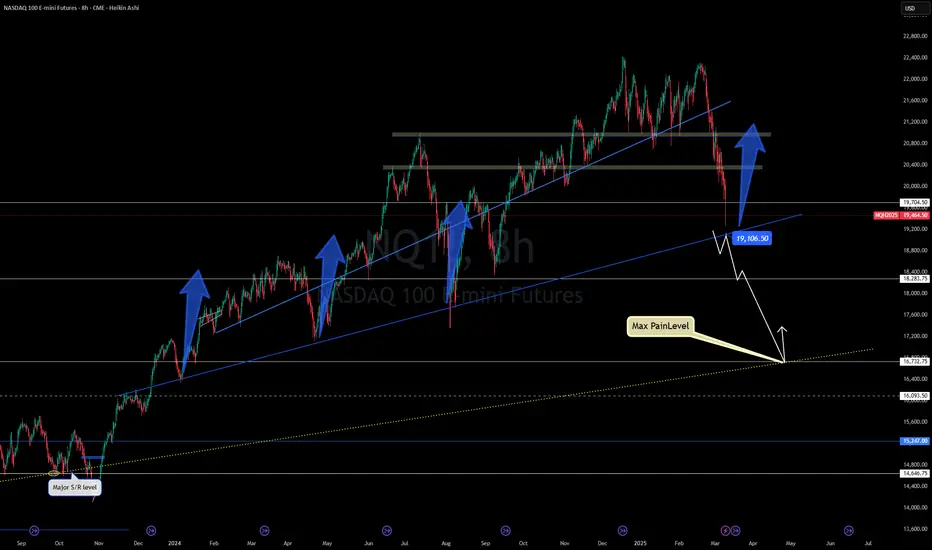
NASDAQ – Will It Hold or Collapse Further?📉🔥 NASDAQ Approaching Max Pain – Will It Hold or Collapse Further? 🚀⚠️
The NASDAQ 100 is hanging by a thread, as price approaches the key 19,106 support level. A breakdown from here could accelerate losses toward the 18,283 zone, and if things get worse, the dreaded 16,732 "Max Pain" level may be tested.
📊 Key Technical Levels:
📌 19,106 – First major support (bounce or breakdown zone).
📌 18,283 – Next key level if sellers take control.
📌 16,732 – The "Max Pain" zone, where long-term buyers may step in.
📌 15,347 – Ultimate demand zone if things spiral out of control.
🚨 Why Is Nasdaq Falling?
Tech stocks are getting destroyed, with Tesla leading the plunge.
Market panic over higher interest rates & economic uncertainty.
Bitcoin also struggling, highlighting broader risk-off sentiment.
💡 Will we see a relief rally from these levels, or is the bloodbath just getting started?
Drop your thoughts below!
One Love,
The FXPROFESSOR 💙
#Nasdaq #StockMarketCrash #TechStocks #Trading #MarketAnalysis
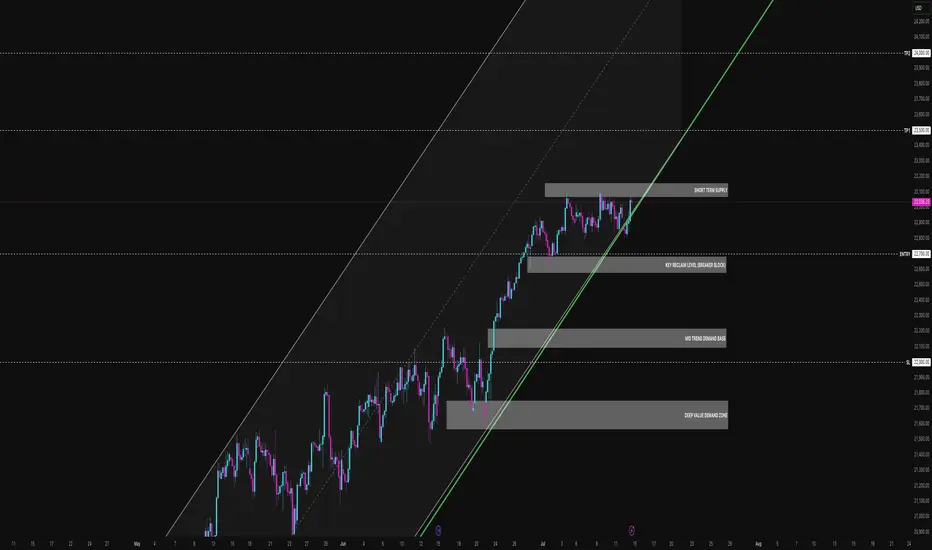
MNQ at the Supply Buffet. Will It Eat or SpitMNQ is hovering just under local highs after a textbook rally into a potential supply shelf. Price is compressing into a wedge between short-term resistance and dynamic trend line support. This is where the market reveals its hand either we break clean and run, or we roll over and unwind the entire move.
Here’s my full breakdown including swing entries, scalp options, confluence layers, and what I’m watching through the Tokyo, London, and NY sessions.
Primary trend: Bullish
Current condition: Compression under resistance (23,100 zone)
Market posture: Still within the ascending channel, but showing signs of indecision
We’re stacked on top of well-respected demand levels and riding a well-tested trend line. But price has now spent 5 sessions ranging just under short-term supply, and that opens up both breakout and breakdown scenarios depending on how it reacts in this key zone.
BULLISH SCENARIO — Trend Continuation
This play assumes the channel holds and buyers defend the 22,700 breaker block.
Primary Entry: 22,700 (Key reclaim level / breaker block)
Aggressive Entry: 22,950 (early reaction from structure front-run)
TP1: 23,500 (equal highs and channel extension)
TP2: 24,000 (clean trend extension target)
SL: 22,000 (below trend line and deep value failure)
Confluences:
Breaker block support from July 3 demand leg
Anchored VWAP from July 7 sits just above entry zone
Perfect alignment with channel midpoint and dynamic support
Buyers defended 22,700 multiple times during NY and London sessions
Macro still favouring tech risk-on
This is the continuation play. If 22,700 holds, I expect a swift push through supply with high reward potential.
BEARISH SCENARIO — Structural Breakdown
This play assumes the trend line and 22,700 level give way, confirming a change in structure.
Trigger: Clean 15m or 30m close below 22,700 and no buyer reclaim
Entry on Retest: 22,680–22,700 zone after breakdown
TP1: 22,200 (mid-trend demand base)
TP2: 21,900 (deep value demand zone)
SL: Above 22,800 (back inside structure = idea invalid)
Confluences:
Overhead supply has held 4+ sessions
Multiple liquidity sweeps above 23,100 with no follow-through
Momentum divergence + distribution signs on 5m-15m
London session often traps longs just before breakdowns
This isn’t about calling tops it’s about recognising when support fails. If 22,700 goes, the dominoes start falling.
Scalper Setup (Tokyo/London Focus)
For intraday traders hunting reactive entries with tight stops.
Short Idea:
Setup: Price sweeps into 23,090–23,130 zone during low liquidity (Tokyo/London premarket)
Trigger: Rejection wick or bearish engulfing on 5m–15m
TP: 22,950 or 22,700
SL: 23,150
Long Idea:
Setup: Quick drop into 22,950–22,900 front-run zone (pre-NY)
Trigger: Bullish engulfing or delta flip
TP: 23,100–23,200
SL: 22,850
Chart Structure Summary:
23,090–23,130 Short-Term Supply, Resistance shelf, range ceiling
22,700–22,750 Breaker Block Key structure to hold for bulls
22,200–22,400 Mid Demand Base, Trend structure, good R/R long
21,900–22,050 Deep Value Demand, Swing long zone, last line for bulls
Strategy Notes:
Use 15m for structure, 5m for entry, and 1H to confirm trend
Volume delta and order flow helps confirm traps/sweeps
Watch VWAP if price holds above, bias remains up
Don’t trade blindly into supply without confirmation let it reject or break
This isn’t just a supply test it’s a decision point for the next 300+ ticks.
The market is either:
Absorbing above demand and about to explode, or slowly distributing before a trend break.
As always don’t marry a bias. Let the levels do the talking. React, don’t predict. Let me know in the comments how you’re planning to play this.
Weekly Market Outlook: E-mini Nasdaq 100 Futures NQCME_MINI:NQ1!
It’s a quiet week for US economic news. However, the RBA and RBNZ are scheduled to announce interest rate decisions.
As has been the theme this year, markets remain highly sensitive to headline news and associated risks.
US President Trump signed the One Big Beautiful Bill Act into law at the White House.
Treasury Secretary Bessent is currently giving an interview on CNBC as we write this outlook. Explanation of the near-term impact of Trump’s BBB Act, tariffs, and trade deals will be key to monitor, as this may be fuel for further movement. The US is set to announce more trade deals in the next 48 hours, while trading partners who did not reach a deal will revert to April 2nd tariff levels, with the tariffs to take effect on August 1st.
As many as 100 smaller countries will get a set tariff rate.
How does this all translate into price action and expectations for the market?
NQ and ES are currently trading near all-time highs. RTY has potential upside as it plays catch-up. With the BBB Act signed into law, many of the investment banks anticipate a near-term positive impact on GDP.
In NQ, we are looking at the following scenarios:
Key LIS zone: 22860.50 – 22825.50
Support Zone: 22600 – 22582.25
Key Support Zone: 22000 – 22050
Scenario 1: Hold above key LIS
In this scenario, we expect new ATHs and continuing price discovery higher.
Scenario 2: Hold below key LIS
In this scenario, we expect the price to re-test the support zone at 22600 – 22582.25 and consolidate to build value higher. A break below support may lead to further short opportunities to retest the 22000 level.
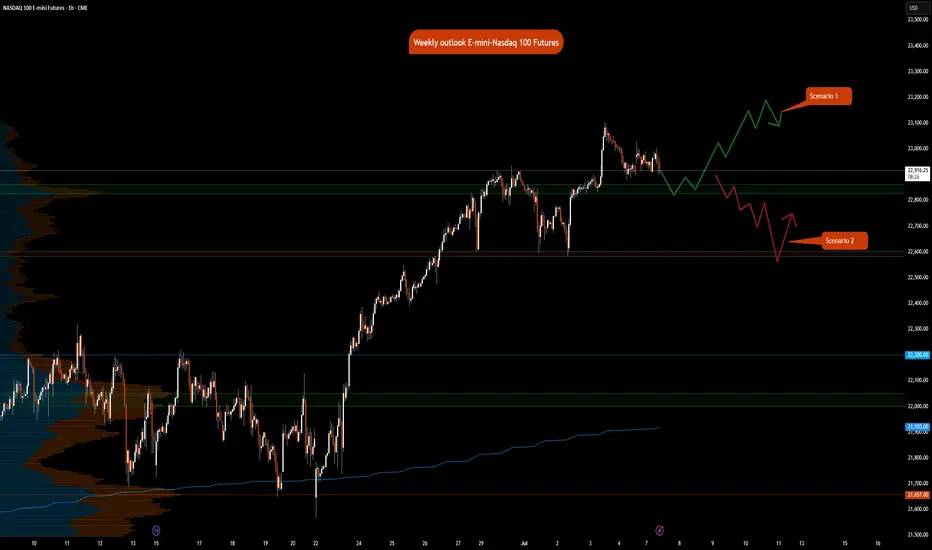
NQ Weekly Recap-Projection 13.07.2025NQ Weekly Recap + Outlook
1️⃣ Recap:
NQ made a new All-Time High, but the breakout ended up being a deviation. Price got rejected and started pulling back.
This signals potential weakness and suggests price may want to explore lower levels.
2️⃣ Bearish Scenario:
📍Target: Daily Swing low (Blue line)
📍Deeper target: Weekly Fair Value Gap (Purple zone)
I’ll look for LTF confirmations around these zones to position for potential longs.
3️⃣ Bullish Catalyst Watch:
There’s increasing speculation that Powell may resign this week.
If that happens, we could see:
✅ Strong bullish momentum
✅ Little to no retracement
✅ Immediate push into new ATHs
Weekly Plan Summary:
🔸 Scenario 1 - Pullback Continuation:
Look for reactive long setups at Daily Swing or W FFVG zone.
🔸 Scenario 2 - Powell Resignation:
Expect a breakout move with momentum — potentially no retrace.
Stay nimble. Trade what the chart confirms, not what the news promises.
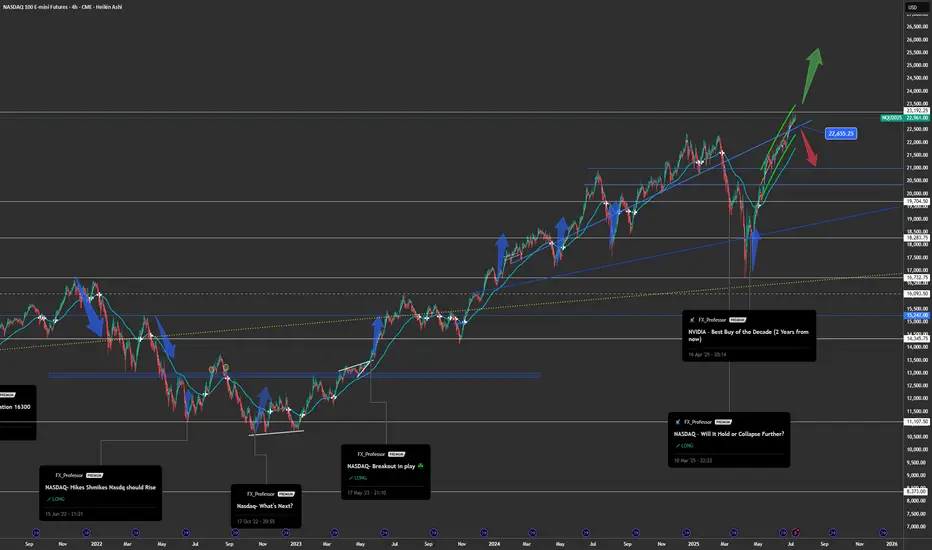
NASDAQ – Decision Point is Now: Breakout or Breakdown?📈🔍 NASDAQ at Key Inflection – Momentum or Meltdown? ⚠️💥
Hey Traders,
The NASDAQ 100 is now standing right at the make-or-break zone: 22,655. This level marks a critical retest of the recent breakout, and what happens here could define the next major move.
🔵 The Setup:
After a strong bounce and sharp rally from below 18K, we've climbed back into the tight ascending structure. But momentum is slowing…
This zone could produce either a bullish continuation to new highs — or a brutal rejection that unwinds the entire move.
📍 Structure Speaks:
Holding above 22,655 = likely continuation
Breakdown = deeper pullback toward 20,000 and lower channel support
Momentum names like NVIDIA are doing the heavy lifting again — but can they sustain the market alone?
📊 What I'm Watching:
Bullish path = measured target ~25,000+
Bearish path = test of the broader trendline near 20,000 or even the 18,200 region
Macro signals still mixed — stay nimble, not married to one bias
⚠️ Stay Sharp:
Just like in crypto, the Nasdaq can punish both bulls and bears when it enters chop mode. Structure and discipline remain your best defense.
I’ve updated the chart — fresh out the oven 🍞 — and more market ideas are following, including BTC, ETH, and BTC Dominance.
One Love,
The FXPROFESSOR 💙
Disclosure: I am happy to be part of the Trade Nation's Influencer program and receive a monthly fee for using their TradingView charts in my analysis. Awesome broker, where the trader really comes first! 🌟🤝📈
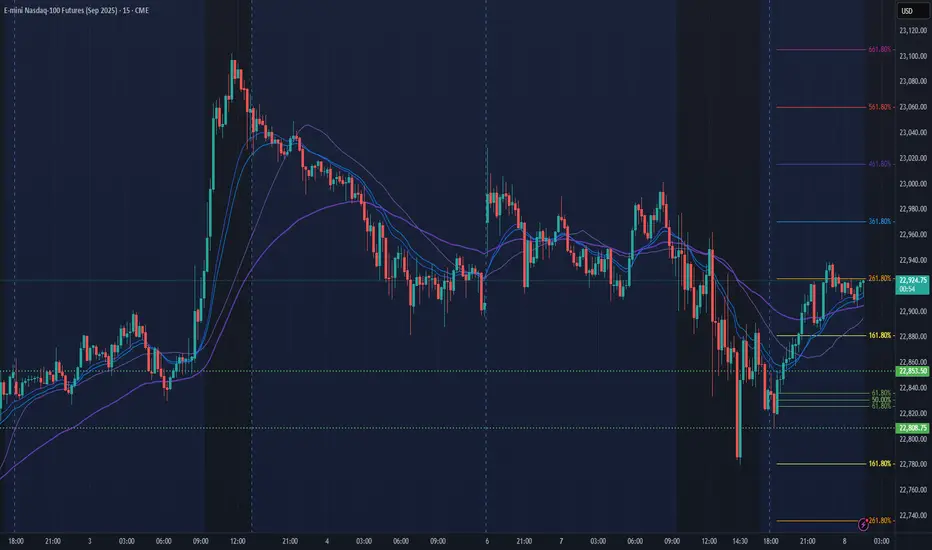
NQ Power Range Report with FIB Ext - 7/8/2025 SessionCME_MINI:NQU2025
- PR High: 22853.50
- PR Low: 22808.50
- NZ Spread: 100.5
No key scheduled economic events
Session Open Stats (As of 12:25 AM 7/8)
- Session Open ATR: 318.85
- Volume: 24K
- Open Int: 269K
- Trend Grade: Neutral
- From BA ATH: -0.8% (Rounded)
Key Levels (Rounded - Think of these as ranges)
- Long: 23239
- Mid: 21525
- Short: 20383
Keep in mind this is not speculation or a prediction. Only a report of the Power Range with Fib extensions for target hunting. Do your DD! You determine your risk tolerance. You are fully capable of making your own decisions.
BA: Back Adjusted
BuZ/BeZ: Bull Zone / Bear Zone
NZ: Neutral Zone
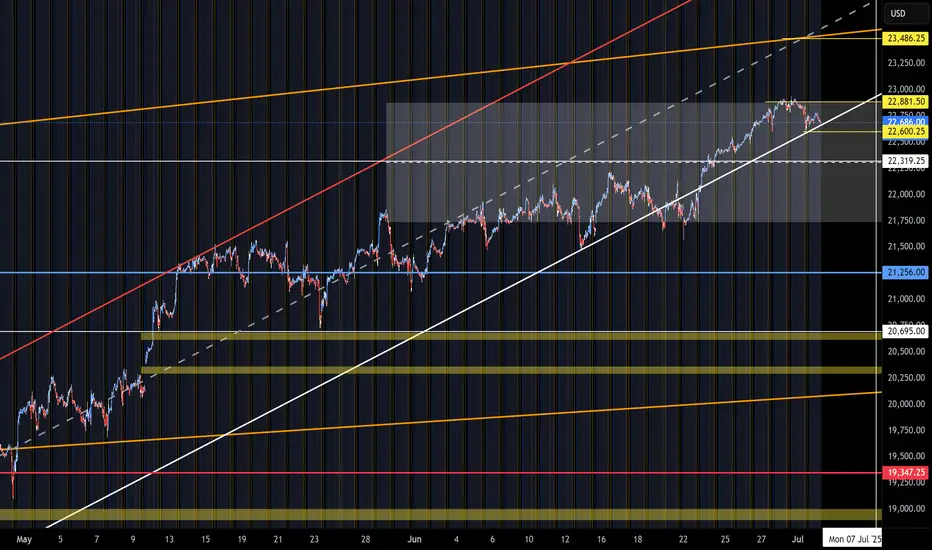
NQ Range (07-02-25)NAZ will have to get some help with a Tweet or two in order to get above KL 22,881. This Post will have Monday close as end point. Look for the long weekend to use the Pop Trick into Monday and if not, we have a decent short developing. BTD/FOMO Forever, you don't even need much volume or fundamental/technical reasons.
MNQ LongDont have the time to explain much on what is going on for this chart.
I think there is a good chance for a long position, but we will see
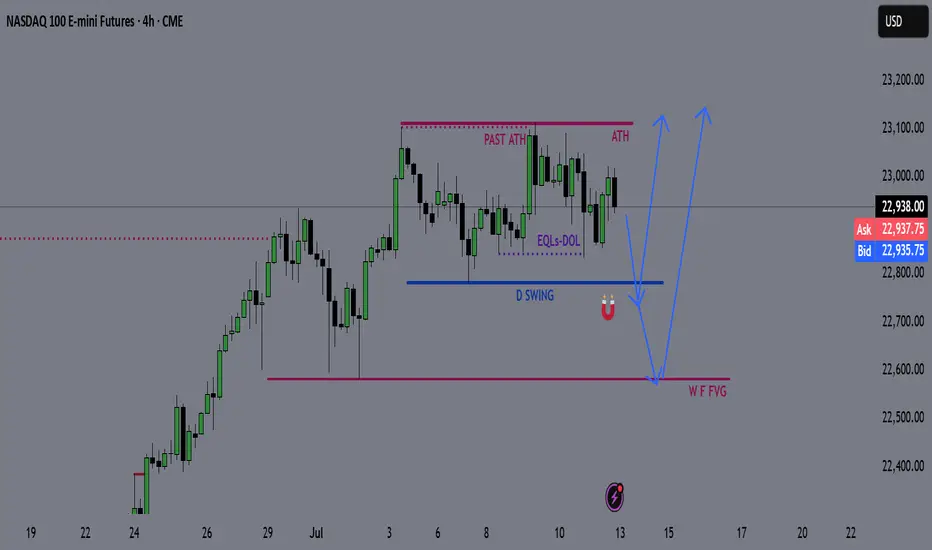
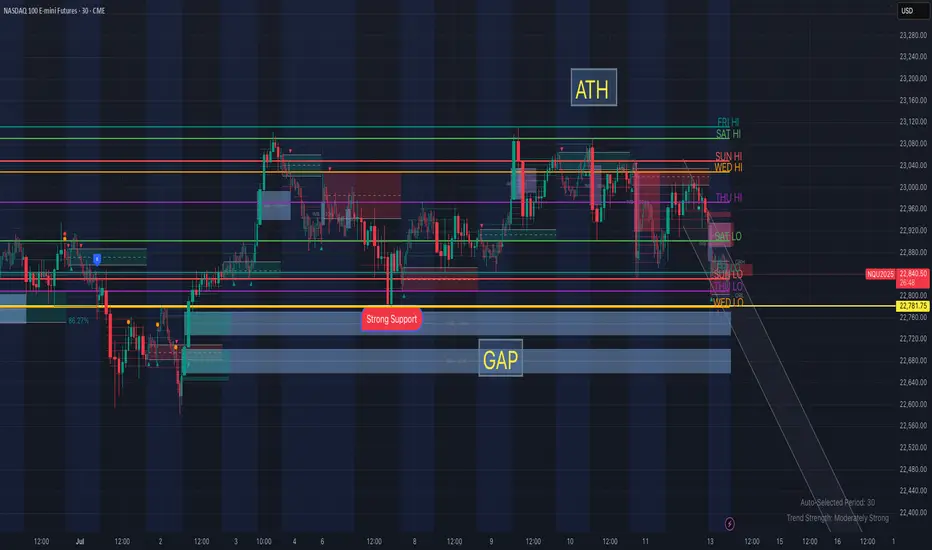
Eyes on the Gap – Discipline Over FOMO NQ📌 Waiting for High-Probability Levels to Engage
Right now, price has been stuck in a multi-week range, coiling just beneath major resistance and above strong demand. I’m not forcing trades — I’m waiting for price to reach the key gap zone and confirmed strong support near 22,781.75.
No reason to act until the market gives me a clear setup.
The real move will come from the edges — not the middle.
🔹 Support Confluence: Gap fill zone + Strong Support label
🔹 Range Context: Price capped under ATH & recycling between session highs/lows
🔹 Bias: Bullish only after sweep or confirmed hold of the lower zone
💬 Discipline is waiting when others get chopped up in the middle. Let the trap spring — then strike.
#PlaymakerTrading #GapZone #SmartMoneyLevels #NQFutures #MarketStructure #SupportAndResistance
Nasdaq ready to dropwe can see the formation of a ressistance zone in daily, and as we explore the chart the best trade for todaty is a short.
targets are in green. entry zone in blue.
have fun
all details are explained in the video.
Elektra

NQ Trend & possible patternNQ looks like it's trying to make a few INV H&S Patterns. Wait for your conformations & remember the trend is your friend.