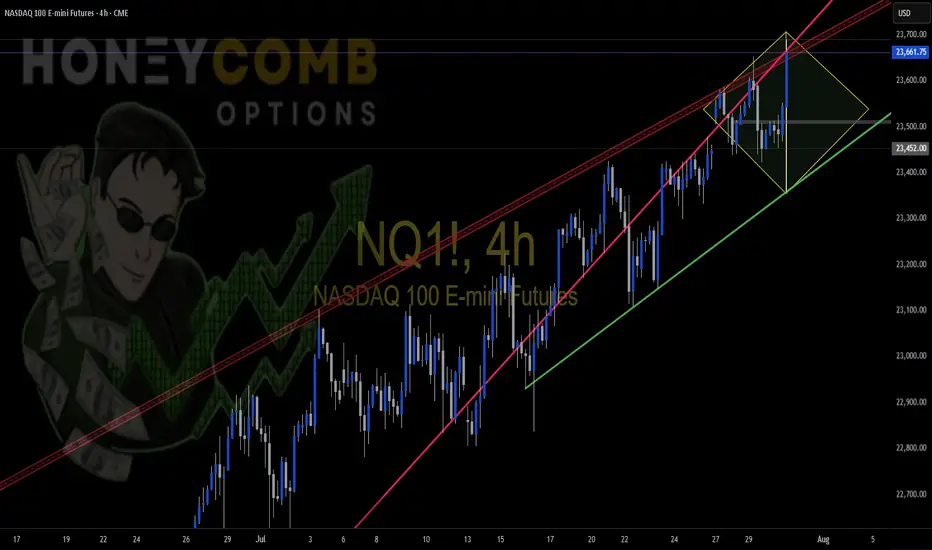
NQ Possible Diamond Top FormationPossible Diamond Top formation. This is a long play, and it may not be completed. I just wanted to show everyone what I see. Trade Safe
UNF1! trade ideas
discountsnothing much we can have lazy bulls in the day and good bull at night? We dont care, well buy it.
take it to nirvana.

NQ Range (07-23-25)The O/N slight lift back to Mid Level of range. The big Tweet regarding Japan, did show up after the close. Now we need to see how the Open Drive & Reg Session move today, may be snail lift higher 1st. The next bullish move would be F-M Long play. The selling just does not have much force or is part of the head fake prior to a decent drop test. Still Scalp Shorts to KL's and wait on some conviction selling to eventually show up.

Bias is still Bullish However its month end Overall bias is still strong bullish, do note that its coming to end of month, either we pull back a bit or continues higher till end of month then pullback. Losing 23350 and 23300, probabilities of moving lower will higher since we had short squeeze move last Friday. Max Pain is 23020 can be use as a guide off futures movement.
NQ & ES Technical AnalysisGood evening my friends... This is my first time posting something on this platform. I decided to share my analysis on NQ & ES here with you, but without sharing strategies, rules and entry techniques. Only the key levels and scenarios... I will make one or two comments every day... I am very happy to share my ideas with you!!!
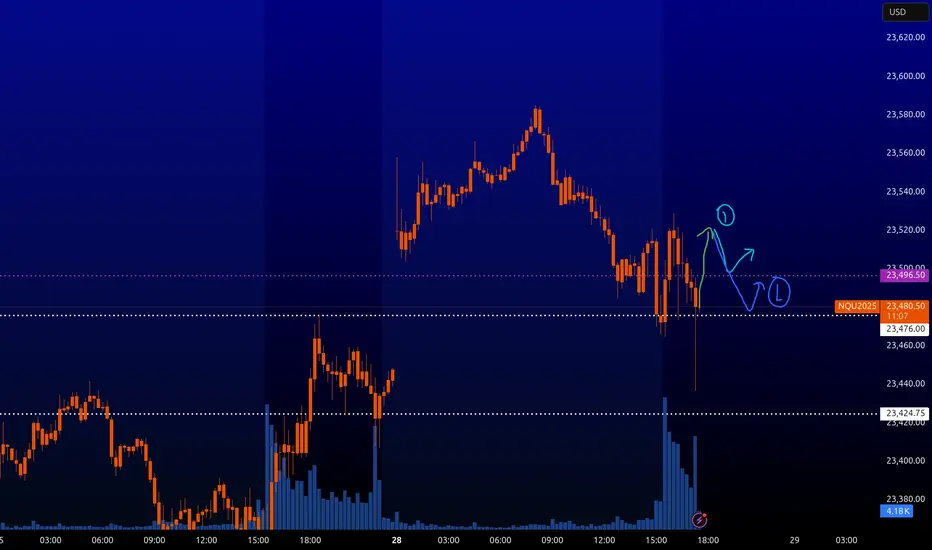
NQ : Scalping levelsHere's a very likely scenario on the NQ trade. Once the price grows back, you can take short pullbacks from these levels.
Be careful on trading on the news. It is better not to trade in them. Also, the levels are unlikely to work in illiquid times.
I will post the results of the levels and my trades in the comments if everything will be according to the scenario.
Approach Next Resistance Amid Cautious OptimismCurrent Price: 23272.25
Direction: LONG
Targets:
- T1 = 23480
- T2 = 23720
Stop Levels:
- S1 = 22990
- S2 = 22770
**Wisdom of Professional Traders:**
This analysis synthesizes insights from thousands of professional traders and market experts, leveraging collective intelligence to identify high-probability trade setups. The wisdom of crowds principle suggests that aggregated market perspectives from experienced professionals often outperform individual forecasts, reducing cognitive biases and highlighting consensus opportunities in NASDAQ Futures.
**Key Insights:**
NASDAQ Futures exhibit strong recovery potential but face technical resistance at $23420. The market momentum suggests short-term bullishness despite concerns about seasonal reversals in late August to October. Traders are advised to focus on breakout scenarios while employing risk mitigation strategies including hedges.
**Recent Performance:**
Over the past six months, NASDAQ Futures have displayed substantial volatility. After a steep drop of 27%, the index staged an impressive 40% recovery. Such swings highlight heightened risk yet underscore resilience, bolstered by strong inflows into technology stocks.
**Expert Analysis:**
Analysts caution against overcrowded positions in mega-cap tech stocks dominating NASDAQ Futures. While the rally has offered compelling returns, seasonal risks suggest potential reversals during late summer and early autumn. Diversification strategies into less-crowded sectors may enhance portfolio robustness.
**News Impact:**
Recent announcements around AI adoption, earnings beats by key technology firms, and federal monetary policy stabilization have bolstered sentiment in tech-heavy indices, including NASDAQ Futures. Continued interest in growth stocks adds fuel to the bullish narrative despite looming risk factors.
**Trading Recommendation:**
Traders should consider a LONG position based on strong bullish sentiment and favorable technical setups. However, risk factors such as seasonal reversals and crowded trades in large-cap technology stocks require prudent stop levels and diversification strategies to protect against downside vulnerabilities.
NASDAQ (Nas 100): Buyers Are In Control. Wait For LongsWelcome back to the Weekly Forex Forecast for the week of July 28 - Aug 1st.
In this video, we will analyze the following FX market:
NASDAQ (NQ1!) NAS100
The Nasdaq rose Friday to fresh highs, following a busy week of tariff updates and earnings. The index is showing no signs of bearishness.
Wait for pullbacks to FVGs to buys.
FOMC and NFP warrant caution with new entries. Wait until the news before new entries.
Enjoy!
May profits be upon you.
Leave any questions or comments in the comment section.
I appreciate any feedback from my viewers!
Like and/or subscribe if you want more accurate analysis.
Thank you so much!
Disclaimer:
I do not provide personal investment advice and I am not a qualified licensed investment advisor.
All information found here, including any ideas, opinions, views, predictions, forecasts, commentaries, suggestions, expressed or implied herein, are for informational, entertainment or educational purposes only and should not be construed as personal investment advice. While the information provided is believed to be accurate, it may include errors or inaccuracies.
I will not and cannot be held liable for any actions you take as a result of anything you read here.
Conduct your own due diligence, or consult a licensed financial advisor or broker before making any and all investment decisions. Any investments, trades, speculations, or decisions made on the basis of any information found on this channel, expressed or implied herein, are committed at your own risk, financial or otherwise.

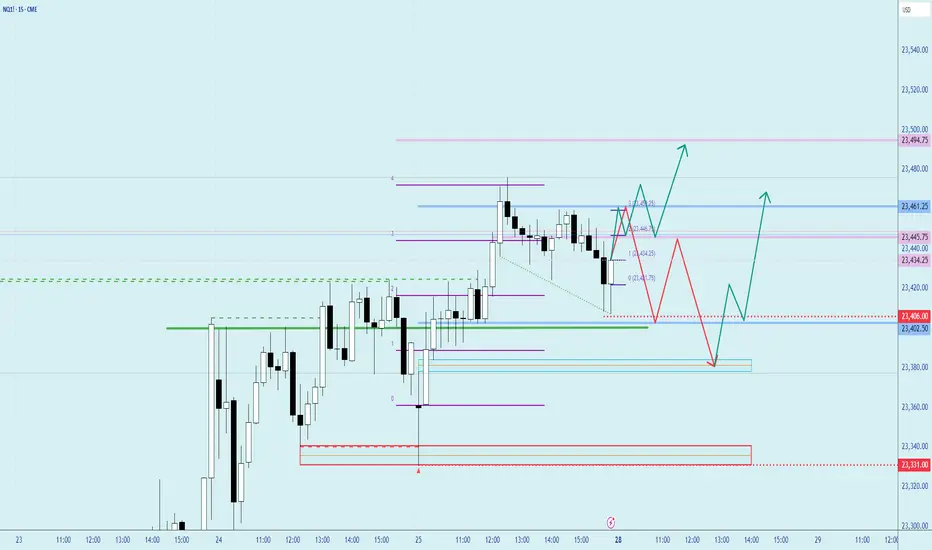
US Market open Targets for NQTarget areas for NQ at US Market open. I will use lower timeframe signals to watch for move up to higher target area or Down to lower target.

SP500 & Nasdaq Daily Trade SetupsIn this update we review the recent price action in the E-mini SP500 & Nasdaq futures contracts and identify the next high-probability trade setups and price objectives to target. To review today's video analysis, click here!

Nasdaq in future Everything's clear on chart
I wanna see a bullish move on NQ first to create a up run leg and come back to the lower 50 percent of that leg then ...

Intro to what I call Algo TradingAlgorithmic training can mean different things to different people what I mean when I say the term algorithmic trading is just things that happen automatically.
Some guys have like these really complex formulas and based on like all this really advanced mathematics. If I'm being 100% honest i'm essentially looking at pictures on a chart and looking at the patterns.
But the pictures on the chart themselves are based on really advanced mathematical formulas or they can be at least or a combination of multiple mathematical formulas that then that the result of our represented by a picture on a chart.
So I look at the pictures on the chart I analyzed them really carefully and if it looks good I use artificial intelligence to code the idea so it happens automatically based on the rules that I set.

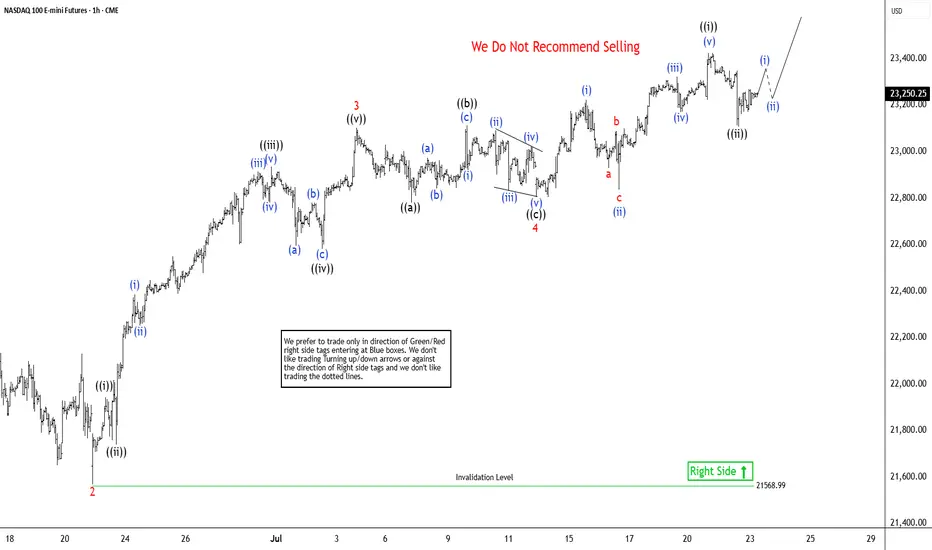
Elliott Wave View: Nasdaq Futures (NQ_F) Poised To Extend HigherThe Nasdaq Futures (NQ_F) favors higher in bullish impulse sequence from April-2025 low. It already broke above December-2024 high & expect short term pullback in 3, 7 or 11 swings to remain supported. Impulse sequence unfolds in 5, 9, 13, 17, 21….. swings count. It ended daily corrective pullback in double correction at 16460 low of 4.07.2025 low. On daily, it should extend into 28864 – 26152 area to finish April cycle before next pullback start. Above there, it favors rally in (3) of ((1)). It placed (1) of ((1)) at 21858.75 high, (2) at 21071.50 low as shallow connector & favoring upside in 5 of (3) against 7.13.2025 low. Every pullback after 4.21.2025 low was shallow & unfolded in 3, 7 or 11 swings calling for more upside as long as it stays above 5.30.2025 low. Within (3), it ended 1 at 22222 high, 2 at 21566.75 low, 3 at 23102.50 high, 4 at 22803 low & favors upsides in 5 of (3). Wave 4 as flat correction ended in 7.13.2025 low of 22803 low.
Below 3 of (3) high, it placed ((a)) at 22779.75 low, ((b)) at 23112 high & ((c)) at 22803 low as flat connector against 6.22.2025 low. Above there, it ended ((i)) at 23424.75 high as diagonal & ((ii)) at 23108 low in 3 swing pullbacks. Above there, it should continue rally in ((iii)) of 5, which will confirm above 23424.75 high to avoid double correction. Within ((i)), it placed (i) at 23222.75 high, (ii) at 22835.5 low, (iii) at 23320.75 high, (iv) at 23169.50 low & (v) at 23424.75 high. Currently, it favors upside in 5 of (3) into 23493.5 – 23934.5 area, above 7.13.2025 low before (4) pullback. Based on swing sequence, it already has enough number of swings in (3) to call the cycle completed. But as long as it stays above price trendline, passing through 2 & 4, it should continue upside into extreme area. We like to buy the next pullback in 3, 7 or 11 swings at extreme area for intraday rally. It favors upside in April-2025 cycle & expected to remain supported in (4) & later in ((2)) pullback as next buying opportunity.
NQ Targets (07-18-25)I have not posted a Target call in awhile, this one is Long to upper TZ (23,486) and Short to YTD Open level. Prior use of Diablo's to Target drop was prior to NAZ 25% drop (11/24 Post's).
We are due for some drop retesting as we watch typical Long Side Tweets, Tricks and Games start to fizzle some. Today into Monday will be a key signal.
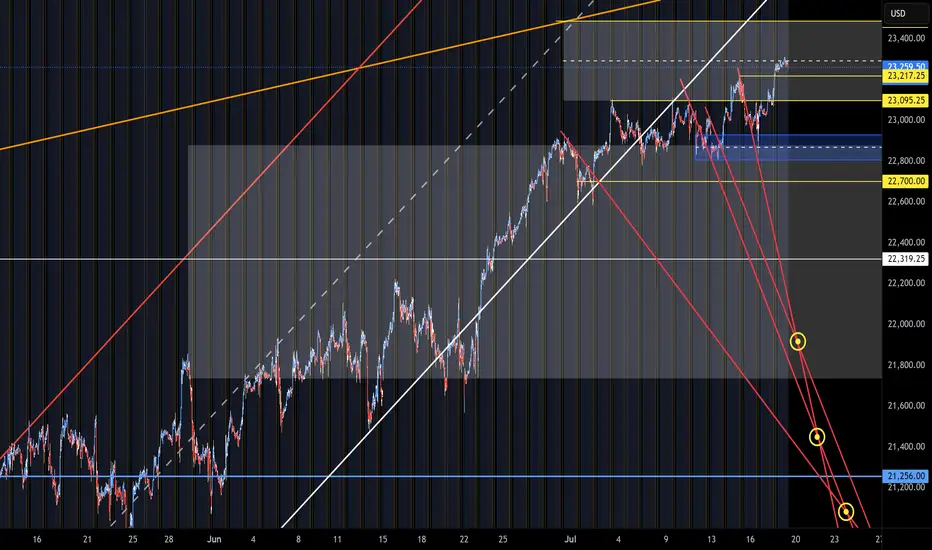
The right time to short nasdaqI shorted when the Nasdaq hit a cluster of prior highs—a well-defined resistance shelf that charts show often attracts heavy supply and stalls rallies, making it a textbook spot where sellers overpower buyers
. Fading the move at that ceiling gives a favorable risk-reward: if price rejects the level, downside potential is wide while upside is capped just beyond the barrier

NASDAQ100 15MIN CHART FROM SMAS TO NEW LOWNasdaq100 at 10 and 15min chart touches the sma600 and the sma800 so as in many other cases before, odds are are more that it will fall from here to a new low

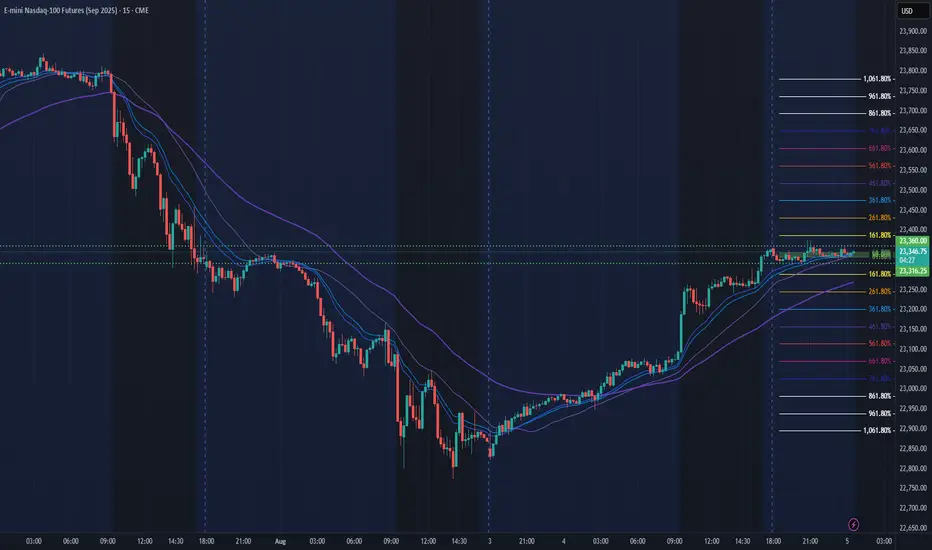
NQ Power Range Report with FIB Ext - 8/5/2025 SessionCME_MINI:NQU2025
- PR High: 23360.00
- PR Low: 23316.25
- NZ Spread: 97.75
Key scheduled economic events:
09:45 | S&P Global Services PMI
10:00 | ISM Non-Manufacturing PMI
- ISM Non-Manufacturing Prices
Session Open Stats (As of 12:35 AM 8/5)
- Session Open ATR: 294.27
- Volume: 23K
- Open Int: 278K
- Trend Grade: Long
- From BA ATH: -2.0% (Rounded)
Key Levels (Rounded - Think of these as ranges)
- Long: 23811
- Mid: 22096
- Short: 20383
Keep in mind this is not speculation or a prediction. Only a report of the Power Range with Fib extensions for target hunting. Do your DD! You determine your risk tolerance. You are fully capable of making your own decisions.
BA: Back Adjusted
BuZ/BeZ: Bull Zone / Bear Zone
NZ: Neutral Zone
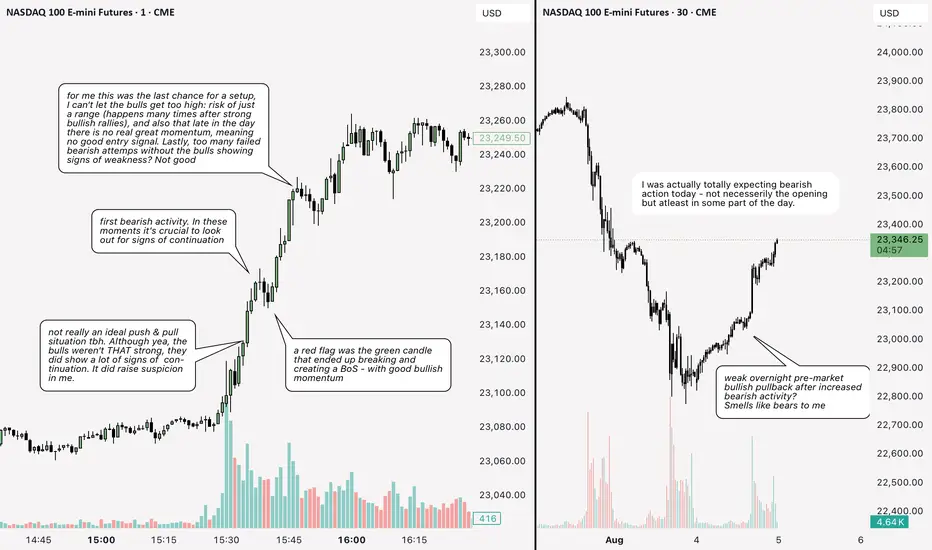
NQ: 230th trading session - recapReally good session today - won't be here tomorrow PROBABLY. I'll do a mental recap of the day after it's over. Again, I'm away for holidays. Maybe I should take the time off too. Maybe. Just maybe.
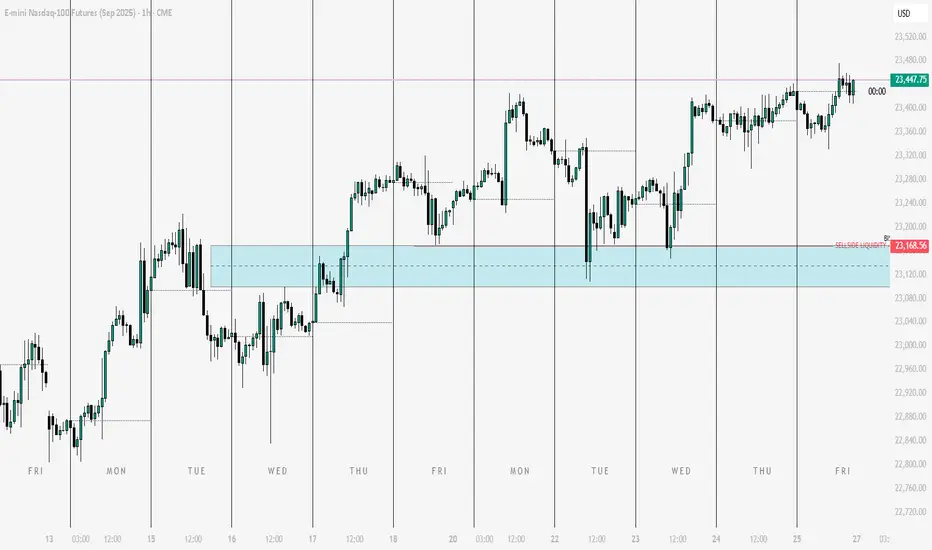
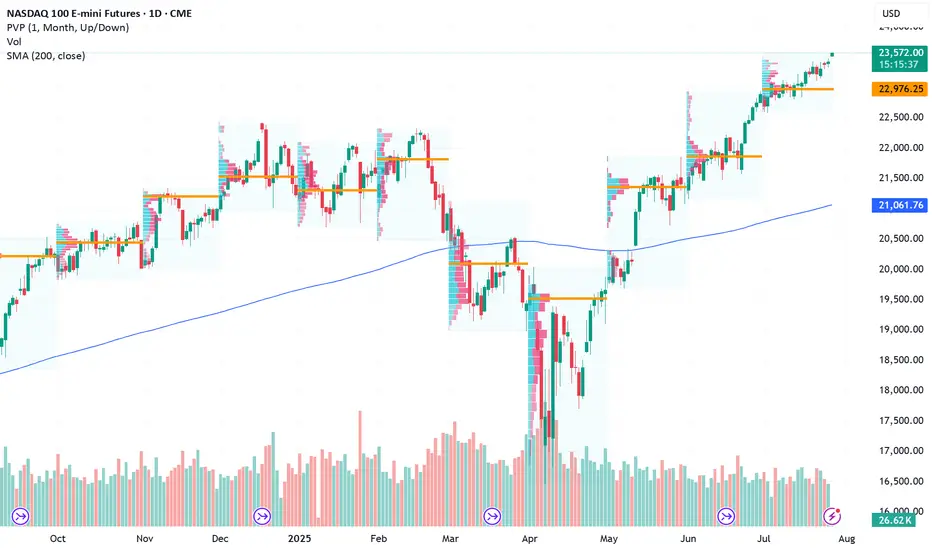
E-Mini Nasdaq Futures Markets Close at a Major Inflection PointAs the new month begins, the market just closed right at last year’s high, a critical level that could act as either resistance or new support.
These return-to-origin zones aren’t random. They often mark key decision points for institutional capital.
The question now:
Does this level hold as a launchpad, or does it reject?
What to watch :
VIX curve: contango or hedging pressure?
Bond market: confirming risk-on or signaling caution?
Breadth: is this rally broadening or narrowing?
No need to predict. Let price and flow do the talking.
See you on the inside. CME_MINI:NQ1!

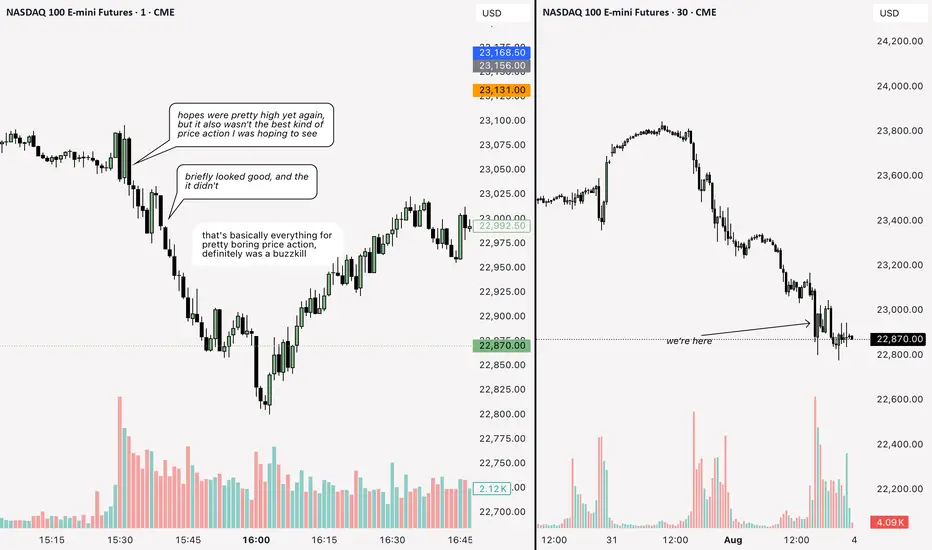
NQ: 229th trading session - recapNot a good session, price action was bad and my focus also wasn't spot on.
I on vacation for a week. I might look into the markets cuz I have maybe some time.
But next week I'll definitely return with better focus - that's actually everything holding me back rn. My inability to lock in completely.
I've got my plan, I've got my system, I've got my funded accounts. Now I just need to focus.
NQ: 228th trading session - recapI am posting this and fridays session very late. However with the benefit of hindsight (and what I actually thought a few days ago: I was not surprised seeing such a huge pullback/ bearish increase. I was actually talking about that in a few recaps a while ago. This is what I love about scalping man

Daily Orderflow on ES and NQ. 01.08.2025, NFP FridayCME_MINI:NQ1! CME_MINI:ES1!
Orderflow explanation. Sessional delivery and New York Price action

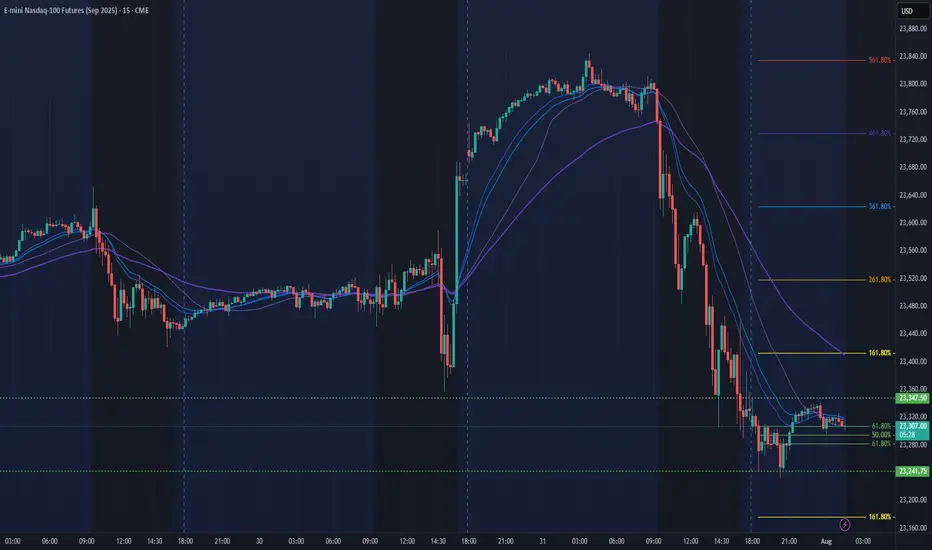
NQ Power Range Report with FIB Ext - 8/1/2025 SessionCME_MINI:NQU2025
- PR High: 23347.50
- PR Low: 23241.75
- NZ Spread: 236.0
Key scheduled economic events:
08:30 | Average Hourly Earnings
- Nonfarm Payrolls
- Unemployment Rate
09:45 | S&P Global Manufacturing PMI
10:00 | ISM Manufacturing PMI
- ISM Manufacturing Prices
Engulfing daily bar from ATH into new week lows
Session Open Stats (As of 12:45 AM 8/1)
- Session Open ATR: 262.82
- Volume: 45K
- Open Int: 280K
- Trend Grade: Long
- From BA ATH: -2.2% (Rounded)
Key Levels (Rounded - Think of these as ranges)
- Long: 23811
- Mid: 22096
- Short: 20383
Keep in mind this is not speculation or a prediction. Only a report of the Power Range with Fib extensions for target hunting. Do your DD! You determine your risk tolerance. You are fully capable of making your own decisions.
BA: Back Adjusted
BuZ/BeZ: Bull Zone / Bear Zone
NZ: Neutral Zone