UNF1! trade ideas

2025 Trading Final Boss: Daily Market Manipulation, The New NormMarking this point in history because we'll likely forget and move on.
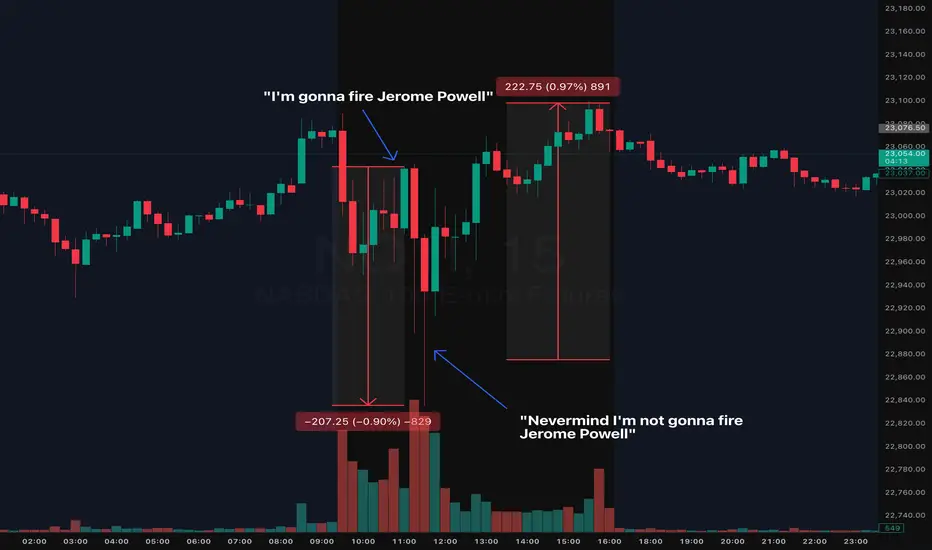
During the early hours of the July 16th NYC session, we saw indices quickly flush ( CME_MINI:NQ1! CME_MINI:ES1! ) nearly 1% on the news that Trump will fire Jerome Powell. The dip was bought almost instantly.
Shortly after the dip was bought (roughly 0.50% recovery), guess what? Trump announced, he is "not considering firing Jerome Powell". The dip then recovered and achieved a complete V to finish the day somewhat green. Make what you want of it but always use a stop loss in these tough conditions.
Welcome to 2025 Trading Final Boss
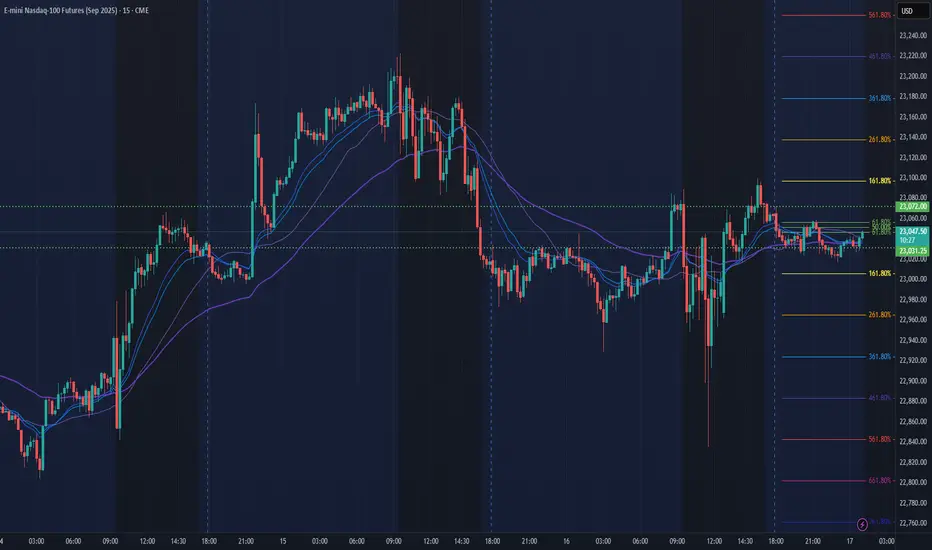
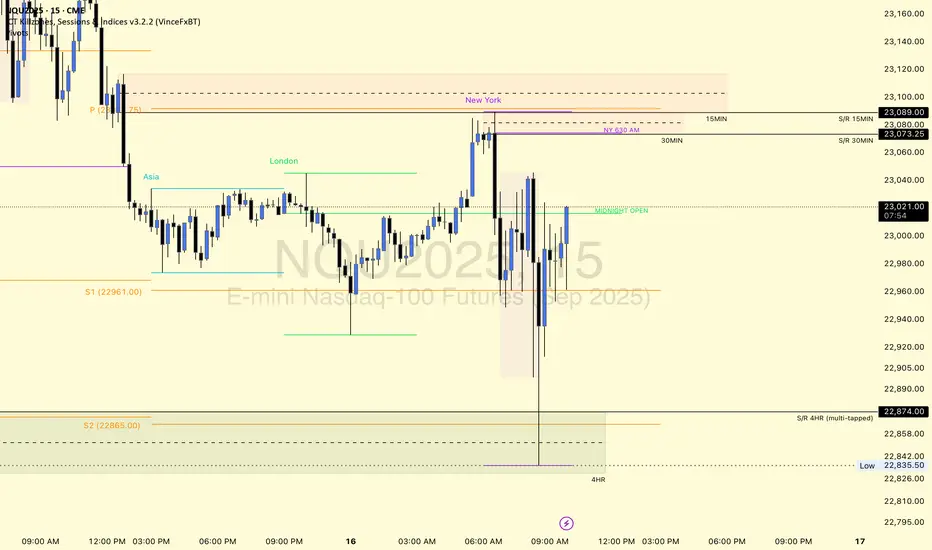
NQ Power Range Report with FIB Ext - 7/17/2025 SessionCME_MINI:NQU2025
- PR High: 23072.00
- PR Low: 23031.25
- NZ Spread: 91.25
Key scheduled economic events:
08:30 | Initial Jobless Claims
- Retail Sales (Core|MoM)
- Philadelphia Fed Manufacturing Index
Session Open Stats (As of 12:35 AM 7/17)
- Session Open ATR: 274.88
- Volume: 18K
- Open Int: 268K
- Trend Grade: Neutral
- From BA ATH: -0.8% (Rounded)
Key Levels (Rounded - Think of these as ranges)
- Long: 23239
- Mid: 21525
- Short: 20383
Keep in mind this is not speculation or a prediction. Only a report of the Power Range with Fib extensions for target hunting. Do your DD! You determine your risk tolerance. You are fully capable of making your own decisions.
BA: Back Adjusted
BuZ/BeZ: Bull Zone / Bear Zone
NZ: Neutral Zone
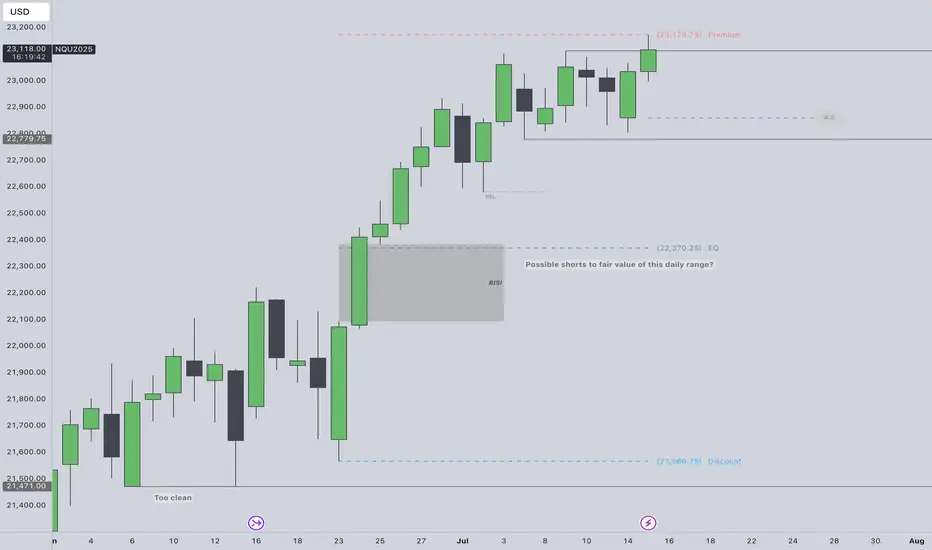
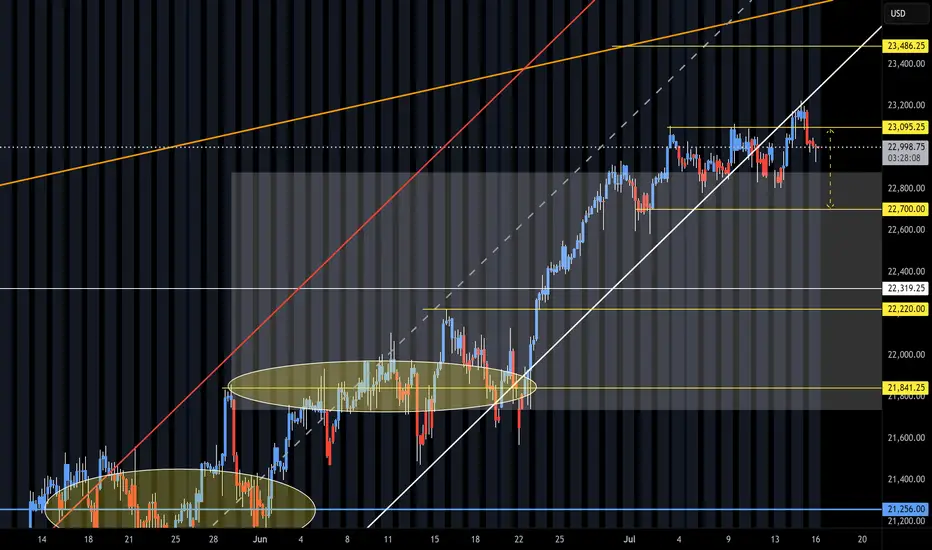
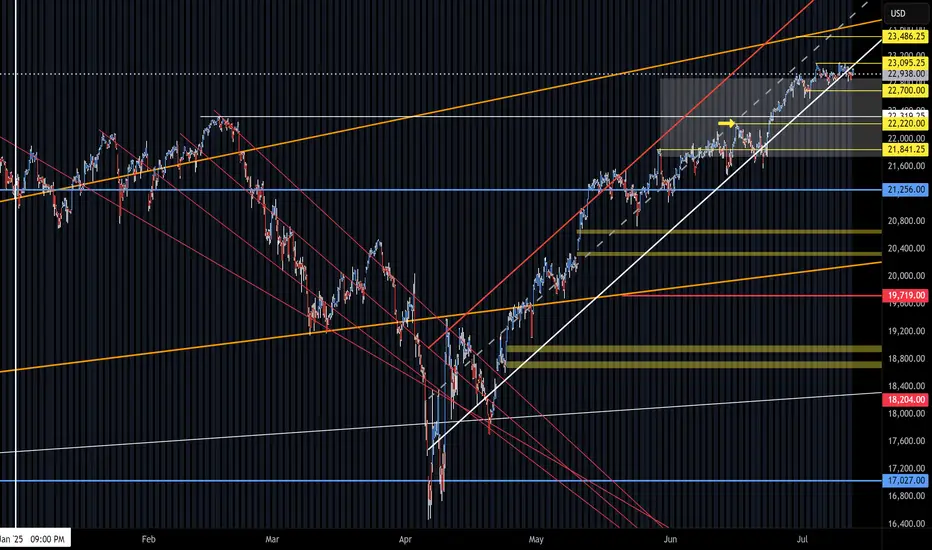
To fade all time highs or not?Not trying to fade ATH run but the SSL in this daily range looks too obvious to me. Super premium.
Price was in a consolidation July 7th - 14th. Took external range high today. I really could see shorts playing out if theres a intraweek reversal confirmed after purging the ERH.
Would need to see 1h CISD confirm intraweek reversal to the downside then trade the daily continuation lower targeting 22,779, 22,578 & EQ of the range at 22,370. Also, the daily BISI that needs sellside delivery.
CPI scheduled this week. PPI following.
2025-07-16 - priceactiontds - daily update - nasdaqcomment: Bond markets are going ballistic. Fun times ahead. Technically it’s a trading range under ath and bears are too weak to print any decent bear bar on the daily tf.
current market cycle: bull trend
key levels: 22600 - 23300
bull case: Bulls are might fine. No daily bar is closing on it’s low and we are printing bull bar after bull bar. Daily 20ema is around 22700 and as long as we stay above, bulls remain in full control. Not event imminent firing of JPow and the bond market implosion are stopping this. Truly astonishing.
Invalidation is below 22700.
bear case: Bears are pathetic. Need lower lows below 22770. That’s it. Even if we get them, daily 20ema should be support unless an event triggers big time.
Invalidation is above 23300.
short term: Neutral. Bears barely doing anything but I have no interest in buying this frenzy, given the risks we are facing. We will go down hard soon but right now nothing about this is bearish. I do think the only bearish scenario could be that Jpow resigns/gets fired tomorrow/Friday and we drop down hard to next big support around 22000. I’d be surprised if we could get that low tbh.
medium-long term - Update from 2024-06-29: No change in plans. I expect 20000 to get hit over the next 3 months and maybe 19000 again.
trade of the day: Short US open was my preferred trade today but stop had to be 23223, so far away and target was not all that big since 23000 was the obvious support. The drop down to 22835 was a bit much but given the news, it could have easily led to a much bigger sell-off if the markets weren’t ignoring literally every risk under the sun.
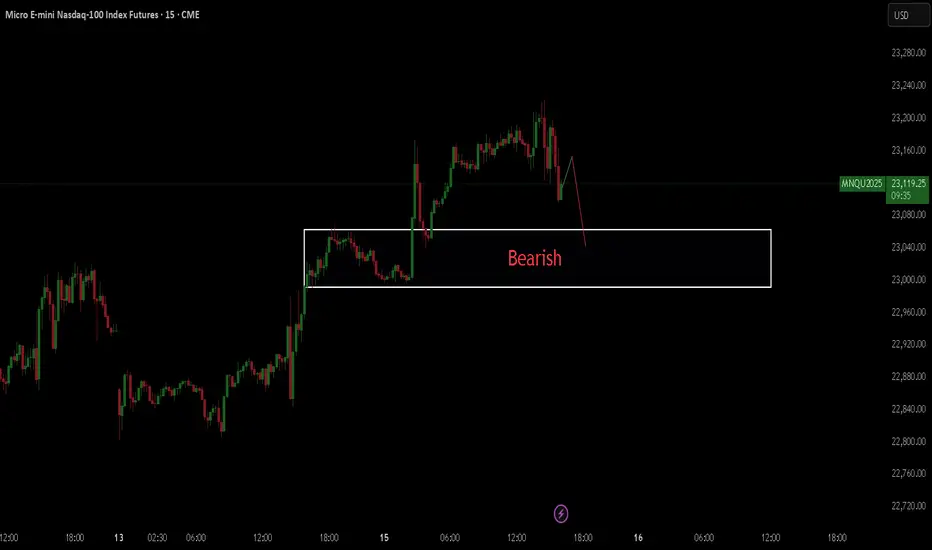
Shorting NQ Yep, weakness started to creep in on NQ this time.
Firstly, the higher timeframes shows massive divergence, even when whales tried to push the price high and continue the trend, massive shorts came in with massive volume. It only tells me that bears are in control this time, and they are coming in with force.
So technically, iam looking for a short up until 22,858
What is really confusing is that also gold is showing weakness which is really something odd, so either iam right in my analysis for Gold and NQ or iam wrong in one of them.
But we will see.

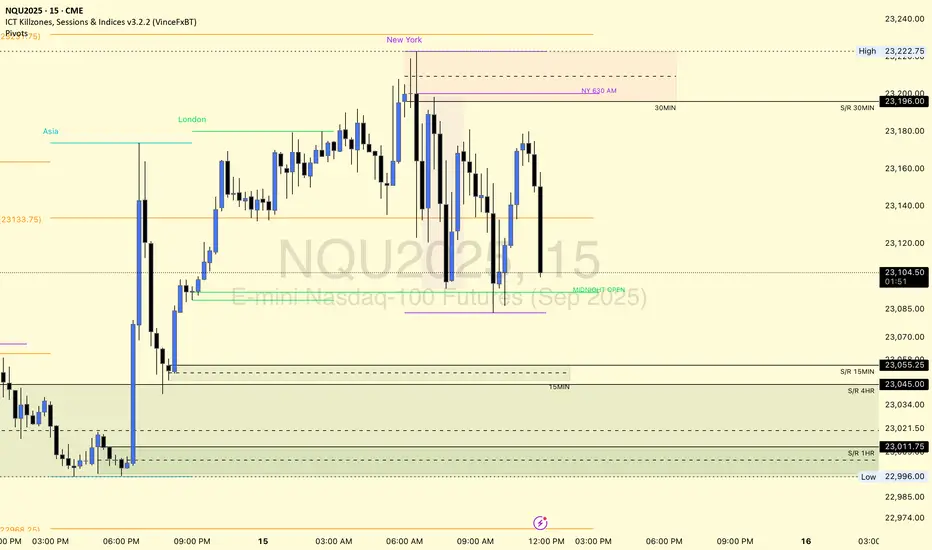
NQ Short (07-16-25)NAZ again can't hold on the Monday off session pump during the Reg Session and does hit lower zone of 22,920. Next trick is Gov't controlled news (released in off session of course) should that not lift it then KL's 881-780 may be next.
The NAZ will go lower under 780 and will be a Strong Short under 22,700. The issue is with getting past the off session propping/rigging (up). Circles to the left are drop target zones that are likely to be revisited as ultimately the NAZ goes sideways in a larger range. The current 14 day sideways moves feels like an Long Mop up or Long Trap. The NAZ will need Tweets, O/N Prop moves and Dead Zone magic lifting to stay away from the Danger Zone of sell orders near 22,881-780.
$NQ Supply and Demand Zones 7/16/25This is for SEED_ALEXDRAYM_SHORTINTEREST2:NQ chart specifically.
Posting for the YouTube fam and to hold myself accountable.
We broke through many demand zones after failing to break newer highs and the 2 news releases.

MNQ Analysis with three successful tradesAs NQ keeps hitting ATH and the bulls are in total control, I do my analysis and share my thoughts.

NASDAQ Trade setupWill wait for NQ to sweep the swing low and then look for longs from there, We might also see SMT with ES around these zones.

NQ - Long Scalp/SwingYo everyone. Here is what I'm seeing for NWQ today. I'm very bullish because of market structure.
Confirmations:
Bullish 1HR Break of Structure
Intermediate Lows holding
Multiple Bullish FVGs
We may not get an entry lower but we ARE going up.
Happy trading!

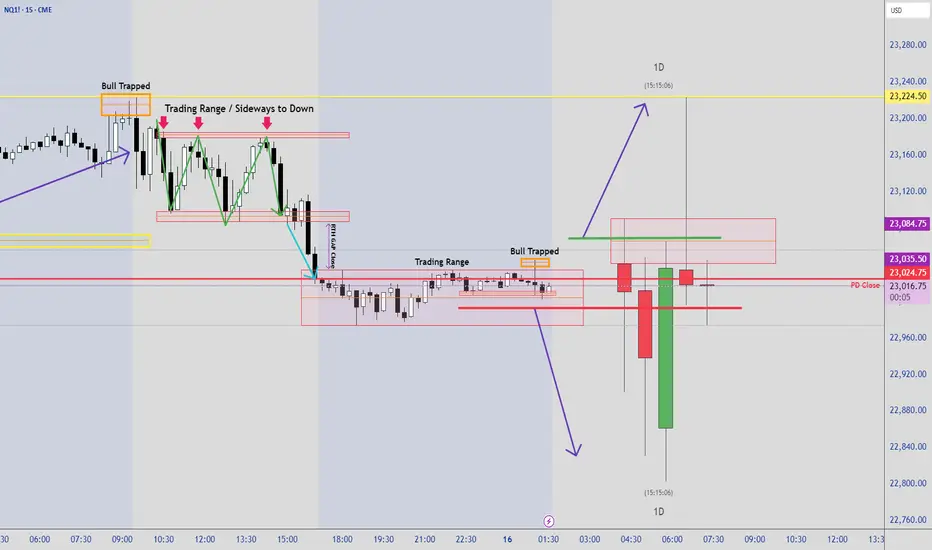
2nd Leg Down Likely on the DailyNews impact yesterday pushes the market higher only to reverse throughout the day. A retest of swing low is expected for a bearish continuation. With another news coming, perhaps a minor pullback then chop and drop.
NQ Power Range Report with FIB Ext - 7/16/2025 SessionCME_MINI:NQU2025
- PR High: 23034.25
- PR Low: 22973.75
- NZ Spread: 135.5
Key scheduled economic events:
08:30 | PPI
10:30 | Crude Oil Inventories
AMP margins raised overnight for expected PPI volatility
Session Open Stats (As of 12:25 AM 7/16)
- Session Open ATR: 277.22
- Volume: 27K
- Open Int: 277K
- Trend Grade: Neutral
- From BA ATH: -0.8% (Rounded)
Key Levels (Rounded - Think of these as ranges)
- Long: 23239
- Mid: 21525
- Short: 20383
Keep in mind this is not speculation or a prediction. Only a report of the Power Range with Fib extensions for target hunting. Do your DD! You determine your risk tolerance. You are fully capable of making your own decisions.
BA: Back Adjusted
BuZ/BeZ: Bull Zone / Bear Zone
NZ: Neutral Zone
DIYWallSt Trade Journal: Perfect Morning Signals & Rate Cut bets07/15/25 Trade Journal, and ES_F Stock Market analysis
EOD accountability report: +404.50
Sleep: 7 hours
Overall health: Good
VX Algo System Signals from (9:30am to 2pm)
— 8:41 AM Market Structure flipped bullish on VX Algo X3!
— 9:33 AM VXAlgo ES X1 Sell Signal (triple sell)
— 9:40 AM Market Structure flipped bearish on VX Algo X3!
— 1:20 PM VXAlgo ES X1 Buy signal (triple buy)
What’s are some news or takeaway from today? and What major news or event impacted the market today?
We got great signals at the start of the day and that really helped with today's trading. I had some meetings today and stufff to take care of so i decided to lock out the funded account around noon and called a day.
News
— 9:54 AM
*TRADERS STICK TO BETS ON SEPTEMBER FED RATE CUT AFTER INFLATION REPORT
What are the critical support levels to watch?
--> Above 6295= Bullish, Under 6285= Bearish
Video Recaps -->https://tradingview.sweetlogin.com/u/WallSt007/#published-charts

NQ Short (07-14-25)The NAZ appears to be due for a Drop Test back inside the lower range. F-M Long play and O/N lift moves seem to be loosing their effectiveness. Looking for a 22,300-200 target on drop and if not, look for U Turn under 23,300.
NASDAQ BEARISHHello, with my skills and my analysis I see that the Nasdaq market has a good chance of falling.
$NQ Supply and Demand Zones 7/15/25This for sharing my S/D zones for SEED_ALEXDRAYM_SHORTINTEREST2:NQ specifically.
Daily Market Outlook. 16.07.2025, CPI dayGold Short and NQ order flow explained. Along with the Dollar Index

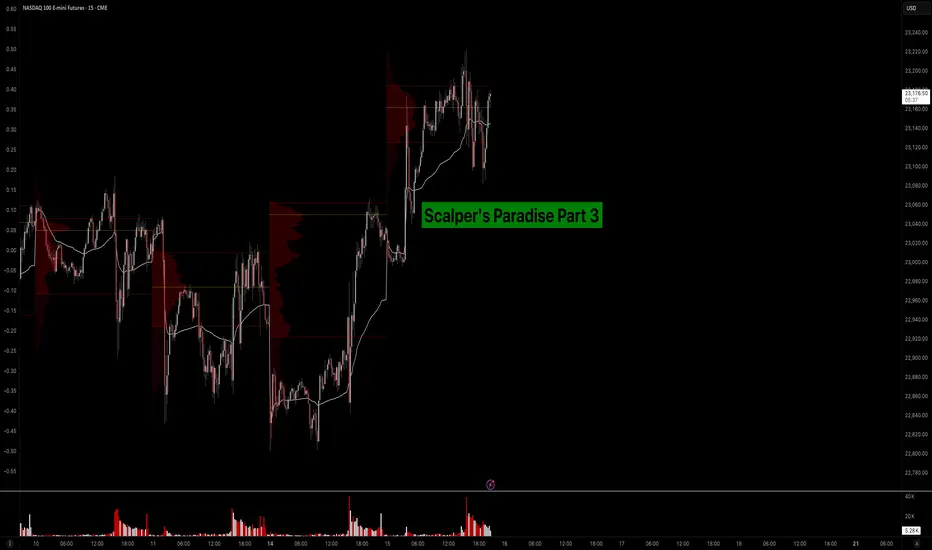
Scalper’s Paradise Part 3 – The Power of Order Flow and DOMWelcome back to Scalper’s Paradise! In this third part of the series, I want to take you into one of the most powerful tools in professional trading: Order Flow and the Depth of Market (DOM).
I chose this topic because during my time as an institutional trader, this was our entire world. We didn’t use indicators. We didn’t guess. We traded exclusively based on what we could see happening live in the DOM and Time & Sales. Every decision was made tick by tick, based on real market activity.
That experience shaped the way I view markets forever—and today, I want to share that perspective with you.
What Is Order Flow, Really?
To me, Order Flow is the most honest information the market can give you. It doesn’t predict, it reveals. It shows who is actually making moves right now. When I was sitting at my institutional desk, I didn’t look at moving averages or oscillators. I looked at who was being aggressive: were market buyers lifting offers, or were sellers smashing the bid?
Watching the tape (Time & Sales) and the footprint chart was like watching a fight unfold in real time. No filters, no guesses. Just raw interaction between buyers and sellers. That’s where real decisions are made.
The DOM: My Daily Reality as a Trader
The DOM (Depth of Market) was the first thing I looked at every morning, and the last thing I closed at night. It shows all visible limit orders resting at each price level. But there’s a catch: not everything you see is real.
In the institution, we were trained to spot real interest versus manipulation. Stacked bids might look strong, but if they disappear the moment price drops tells you that there was never a true intent. Iceberg orders were more interesting, when price gets hit again and again and doesn’t move, that usually meant someone was absorbing quietly.
Reading the DOM is like reading an X-ray of the market’s intentions. And yes, there’s a lot of noise, a lot of deception. But once you learn to read through it, it’s the most powerful tool you’ll ever have.
How We Used Order Flow on the Institutional Side
At the institution, we never chased price. That was rule number one. We let the market come to us (meaning: we used Limit Orders as often as possible) and we used Order Flow to guide every decision.
One of the most important concepts was absorption . If we needed to build a large long position, we didn’t just slam the ask. We would let sellers come in and hit our bids again and again and again. If price didn’t break lower, that told us we were in control.
On the flip side, when we needed to move the market , we switched gears. We used market orders aggressively to push through key levels, forcing reactions, triggering stops, and creating follow-through.
And yes, there were times when we intentionally created traps . We’d push price into obvious zones, make it look like a breakout, then fade it, because we knew how the market reacts afterwards. Order Flow was the only way to read those games in real time.
How You Can Use This as a Retail Trader
I know what you might be thinking: “I’m just a retail trader, how can I possibly use tools like Order Flow or DOM the way institutions do?”
The good news is: you don’t have to compete with institutions, you just need to read their intentions.
Here’s how I would approach it today:
1) Open a footprint chart and look for imbalances, areas where one side is clearly more aggressive. Watch for absorption or sudden volume spikes.
2) Watch the Time & Sales feed. Is there a flurry of trades hitting the ask, but price isn’t moving? That’s someone selling into strength.
3) Use the DOM around key areas like VWAP, previous day high/low, or liquidity clusters. Are orders getting pulled? Is size appearing suddenly? These are all signals.
You don’t need to be early. Let the big player act first, then confirm what you’re seeing across Order Flow and DOM. When everything aligns, that’s your edge.
Bringing It All Together
In Part 1, I shared how we used VWAP and Volume Profile as benchmarks to evaluate execution quality. In Part 2, I showed you how I identify institutional activity using raw volume and 10-second charts. And now, in Part 3, you’ve seen the real-time decision-making tools: Order Flow and DOM.
These aren’t indicators. They’re not theories. They’re the actual battlefield where institutions operate and where I learned to trade.
My goal with this series has always been simple: to give you access to the same mindset I used at the institutional level, but through a lens that makes sense for your reality as a retail trader.
Don’t try to outsmart the market. Observe it. Align with the big players. Let their behavior guide your decisions.
That’s how I learned to trade professionally—and it’s exactly how you can start thinking and acting like a pro, even without the size.
Part 1:
Part 2:
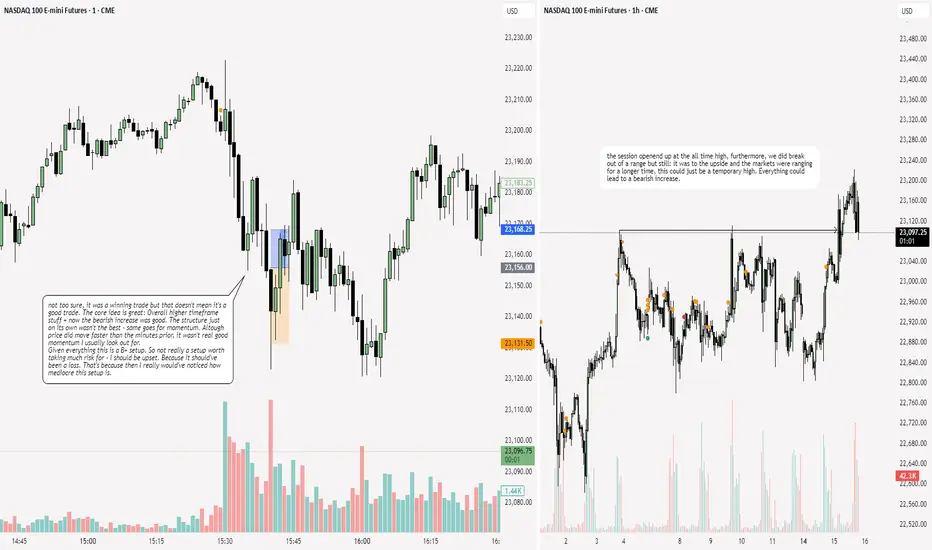
NQ: 218th trading session - recapYeaaa although I did make $2,000 profits it wasn't the best thing ever. I mean I gotta cut myself some slack: The higher timeframe bias was pretty good. And the structure wasn't too shabby. It really was the momentum that turned an A+/S tier setup into a B+ setup which is a HUGE jump.
MNQ LongDont have the time to explain much on what is going on for this chart.
I think there is a good chance for a long position, but we will see
H2 or High 2H2 or High 2 from Al Brooks teachings is an Entry Point. With the news coming , will this continue to trend upwards until the news ??
