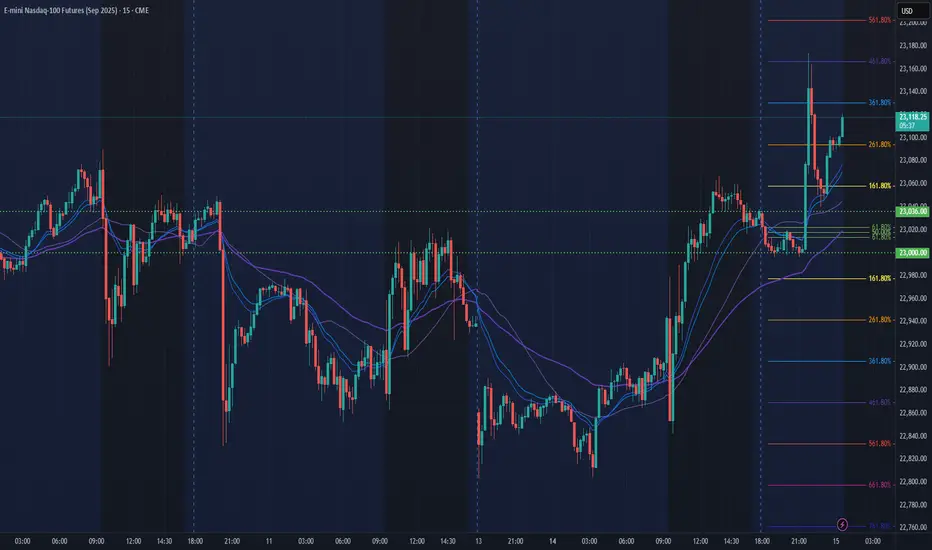
NQ Power Range Report with FIB Ext - 7/15/2025 SessionCME_MINI:NQU2025
- PR High: 23036.00
- PR Low: 23000.00
- NZ Spread: 80.5
Key scheduled economic events:
08:30 | CPI (Core|MoM|YoY)
Asian hours vol spike breakout swing into new ATHs
Session Open Stats (As of 12:15 AM 7/15)
- Session Open ATR: 290.39
- Volume: 42K
- Open Int: 276K
- Trend Grade: Neutral
- From BA ATH: -0.3% (Rounded)
Key Levels (Rounded - Think of these as ranges)
- Long: 23239
- Mid: 21525
- Short: 20383
Keep in mind this is not speculation or a prediction. Only a report of the Power Range with Fib extensions for target hunting. Do your DD! You determine your risk tolerance. You are fully capable of making your own decisions.
BA: Back Adjusted
BuZ/BeZ: Bull Zone / Bear Zone
NZ: Neutral Zone
UNF1! trade ideas
Market Watch UPDATES! Stock Indices, Gold, Silver, US OILWelcome to the Market Watch Updates for Monday, July 14th.
In this video, we will give the forecast updates for the following markets:
S&P500, NASDAQ, DOW JONES, GOLD, SILVER and US OIL.
Enjoy!
May profits be upon you.
Leave any questions or comments in the comment section.
I appreciate any feedback from my viewers!
Like and/or subscribe if you want more accurate analysis.
Thank you so much!
Disclaimer:
I do not provide personal investment advice and I am not a qualified licensed investment advisor.
All information found here, including any ideas, opinions, views, predictions, forecasts, commentaries, suggestions, expressed or implied herein, are for informational, entertainment or educational purposes only and should not be construed as personal investment advice. While the information provided is believed to be accurate, it may include errors or inaccuracies.
I will not and cannot be held liable for any actions you take as a result of anything you read here.
Conduct your own due diligence, or consult a licensed financial advisor or broker before making any and all investment decisions. Any investments, trades, speculations, or decisions made on the basis of any information found on this channel, expressed or implied herein, are committed at your own risk, financial or otherwise.

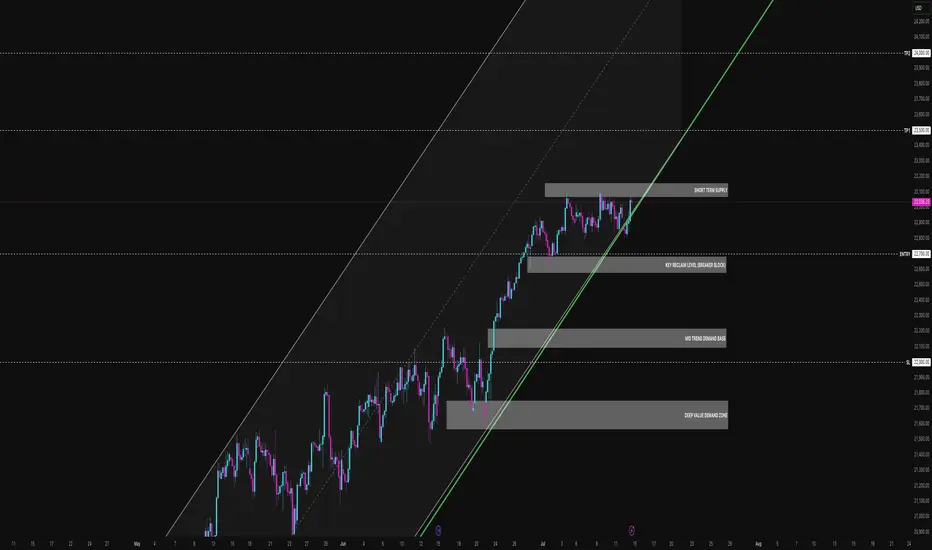
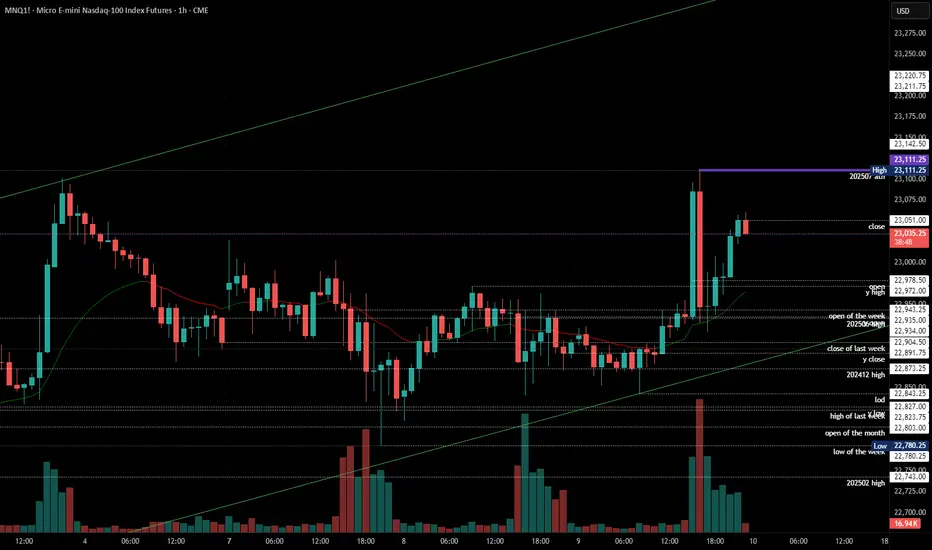
MNQ at the Supply Buffet. Will It Eat or SpitMNQ is hovering just under local highs after a textbook rally into a potential supply shelf. Price is compressing into a wedge between short-term resistance and dynamic trend line support. This is where the market reveals its hand either we break clean and run, or we roll over and unwind the entire move.
Here’s my full breakdown including swing entries, scalp options, confluence layers, and what I’m watching through the Tokyo, London, and NY sessions.
Primary trend: Bullish
Current condition: Compression under resistance (23,100 zone)
Market posture: Still within the ascending channel, but showing signs of indecision
We’re stacked on top of well-respected demand levels and riding a well-tested trend line. But price has now spent 5 sessions ranging just under short-term supply, and that opens up both breakout and breakdown scenarios depending on how it reacts in this key zone.
BULLISH SCENARIO — Trend Continuation
This play assumes the channel holds and buyers defend the 22,700 breaker block.
Primary Entry: 22,700 (Key reclaim level / breaker block)
Aggressive Entry: 22,950 (early reaction from structure front-run)
TP1: 23,500 (equal highs and channel extension)
TP2: 24,000 (clean trend extension target)
SL: 22,000 (below trend line and deep value failure)
Confluences:
Breaker block support from July 3 demand leg
Anchored VWAP from July 7 sits just above entry zone
Perfect alignment with channel midpoint and dynamic support
Buyers defended 22,700 multiple times during NY and London sessions
Macro still favouring tech risk-on
This is the continuation play. If 22,700 holds, I expect a swift push through supply with high reward potential.
BEARISH SCENARIO — Structural Breakdown
This play assumes the trend line and 22,700 level give way, confirming a change in structure.
Trigger: Clean 15m or 30m close below 22,700 and no buyer reclaim
Entry on Retest: 22,680–22,700 zone after breakdown
TP1: 22,200 (mid-trend demand base)
TP2: 21,900 (deep value demand zone)
SL: Above 22,800 (back inside structure = idea invalid)
Confluences:
Overhead supply has held 4+ sessions
Multiple liquidity sweeps above 23,100 with no follow-through
Momentum divergence + distribution signs on 5m-15m
London session often traps longs just before breakdowns
This isn’t about calling tops it’s about recognising when support fails. If 22,700 goes, the dominoes start falling.
Scalper Setup (Tokyo/London Focus)
For intraday traders hunting reactive entries with tight stops.
Short Idea:
Setup: Price sweeps into 23,090–23,130 zone during low liquidity (Tokyo/London premarket)
Trigger: Rejection wick or bearish engulfing on 5m–15m
TP: 22,950 or 22,700
SL: 23,150
Long Idea:
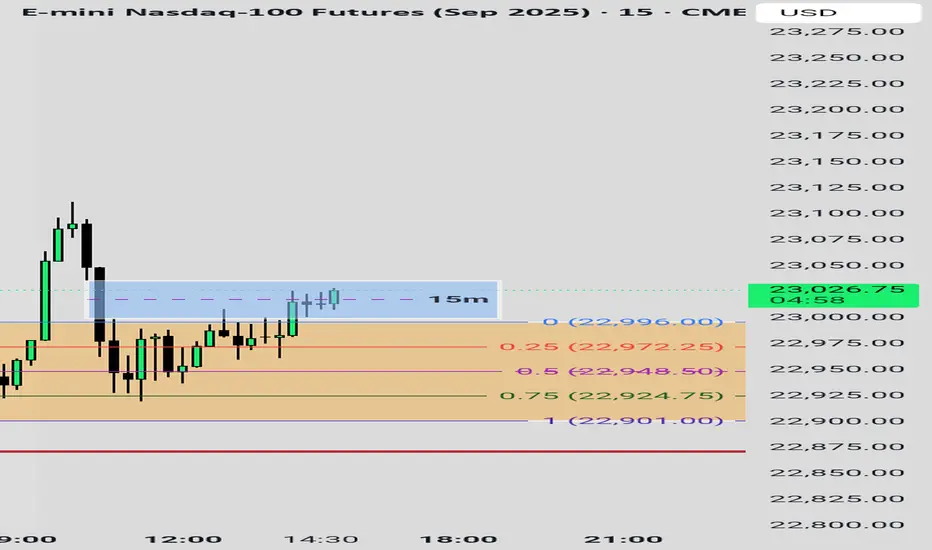
Setup: Quick drop into 22,950–22,900 front-run zone (pre-NY)
Trigger: Bullish engulfing or delta flip
TP: 23,100–23,200
SL: 22,850
Chart Structure Summary:
23,090–23,130 Short-Term Supply, Resistance shelf, range ceiling
22,700–22,750 Breaker Block Key structure to hold for bulls
22,200–22,400 Mid Demand Base, Trend structure, good R/R long
21,900–22,050 Deep Value Demand, Swing long zone, last line for bulls
Strategy Notes:
Use 15m for structure, 5m for entry, and 1H to confirm trend
Volume delta and order flow helps confirm traps/sweeps
Watch VWAP if price holds above, bias remains up
Don’t trade blindly into supply without confirmation let it reject or break
This isn’t just a supply test it’s a decision point for the next 300+ ticks.
The market is either:
Absorbing above demand and about to explode, or slowly distributing before a trend break.
As always don’t marry a bias. Let the levels do the talking. React, don’t predict. Let me know in the comments how you’re planning to play this.
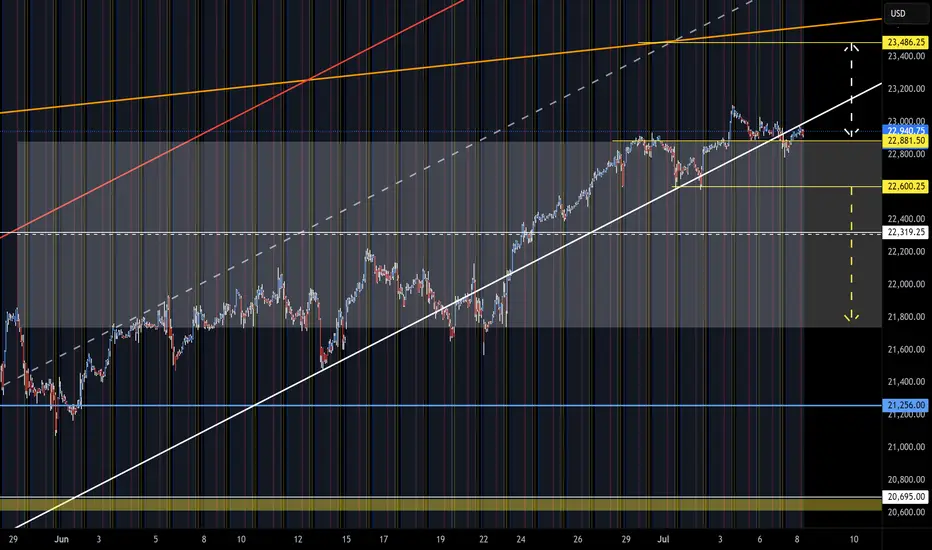
MNQ LONGHere we go again with confusing charts.
So to begin with, iam bullish until the orange trendline is broken, if its not broken and the price is still reacting positively to it as its doing so far, then iam very much bullish.
Also you should be aware that there is divergence started to show up on the daily and it looks massive on the 4h tf, also price swept last high and moved lower, even though the trend is still intact, it still shows some weakness.
my confidence in this setup is 7 out of 10
Since the price action is bearish for now, then if you want you can take some short until 22840, then go long from here.
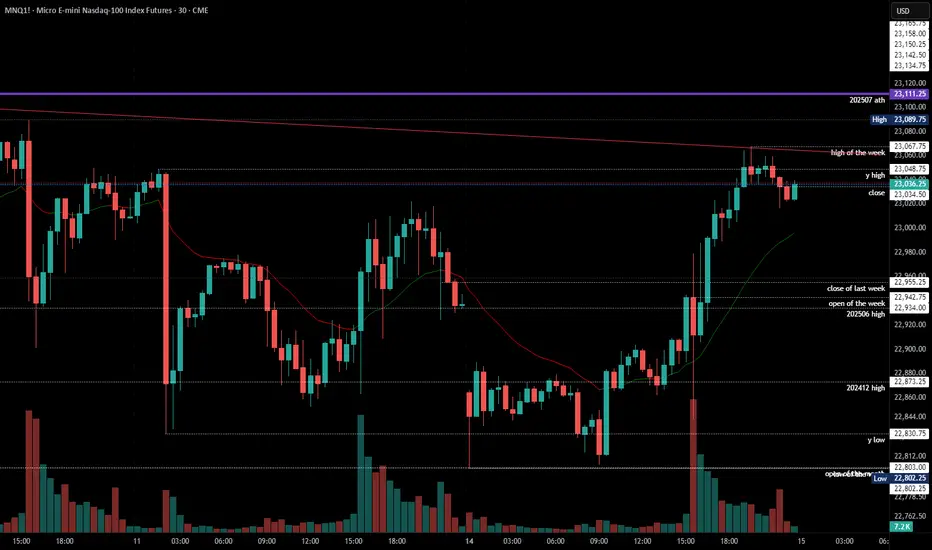
2025-07-14 - priceactiontds - daily update - nasdaqGood Evening and I hope you are well.
nasdaq e-mini futures
comment:
The biggest surprise for next week would be a huge gap down Sunday futures open and having that gap stay open. If bears could actually do something like that and trap all bulls who bought above 22600, that would be amazing.
Spoiler: Bears could not. Another gap down and bear trap. It’s sad but the reality. Don’t expect strong bears all of the sudden.
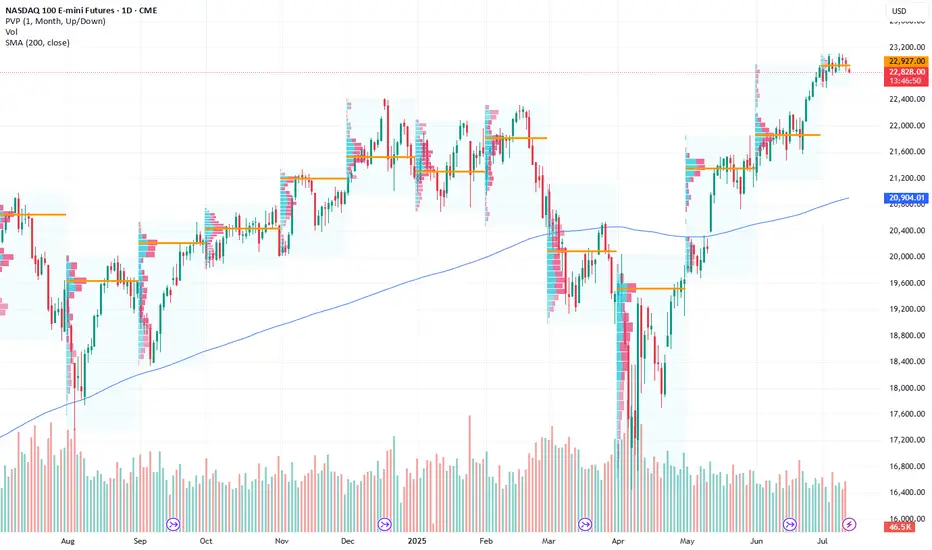
current market cycle: bull trend
key levels: 22000 - 23100
bull case: Bulls defended 22800 which is still as bullish as it gets. Don’t make it more complicated than it is. We are going sideways under the ath, can print a new one any given day. Since I don’t have any targets above 23100ish, I won’t make stuff up here. I only wait for the profit taking to begin to look for shorts.
Invalidation is below 22700.
bear case: Bears are sad. Need a daily close below 22700. If they prevent bulls from printing a new ath above 23111, I would be surprised. No need to write more here until we see much much bigger selling pressure.
Invalidation is above 23500.
short term: Neutral. Bears not doing enough and bulls going sideways under ath. No interest in buying, so I am neutral until big bears come around.
medium-long term - Update from 2024-06-29: No change in plans. I expect 20000 to get hit over the next 3 months and maybe 19000 again.
trade of the day: Long the double bottom above 22800 or the retest on US open around 22830. Bears failed to print consecutive good looking 30m/1h bear bars, so a reversal was the most likely outcome after the double bottom.
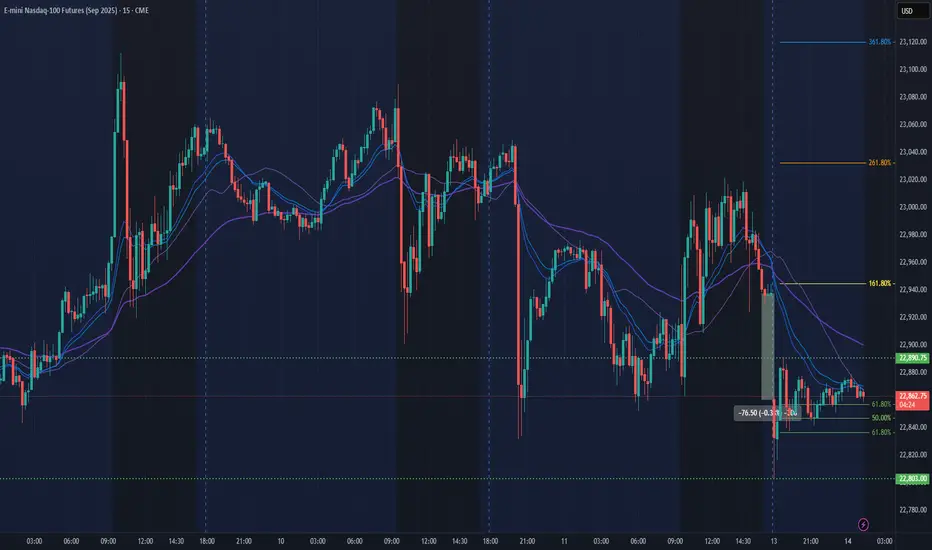
07/14 Nasdaq TradeThis time I had to wait for the red candle to create the wick for me to enter. I just needed that because we already had enough volume. Nasdaq is dangerous with this type of time frames. So review
Yellow Part: Variation
Blue Part: The wick that the red candle was creating for me to enter mroe confidently and using the wick as a stop loss.
Red Part: Execute the volume is on your side

NQ: 217th trading session - recapI'm back after a week and it feels great. I do think I really needed a break. I'm back with a new mindset, with optimism and a redifined plan. Here are some questions I will need to answer for myself:
- bullish times & sales increase - Watch out for it?
- breakeven for short scalps?

NASDAQ Futures: Consolidation Signals Potential Bearish Trend NeCurrent Price: 22959.0
Direction: SHORT
Targets:
- T1 = 22400
- T2 = 22200
Stop Levels:
- S1 = 23150
- S2 = 23320
**Wisdom of Professional Traders:**
This analysis synthesizes insights from thousands of professional traders and market experts, leveraging collective intelligence to identify high-probability trade setups. The wisdom of crowds principle suggests that aggregated market perspectives from experienced professionals often outperform individual forecasts, reducing cognitive biases and highlighting consensus opportunities in NASDAQ Futures.
**Key Insights:**
NASDAQ Futures are currently consolidating after reaching new highs earlier this quarter. This period of range-bound activity is marked by a decreasing daily trading range, suggesting market indecision among investors. The emergence of lower highs and lower lows in recent sessions signals a potential bearish momentum in the near term, with key support levels being monitored closely.
Additionally, macroeconomic factors such as global geopolitical tensions and tariff developments are contributing to investor caution. Recent data highlights the sensitivity of this asset to broader market sentiment. A break below key support might further solidify bearish sentiment, creating downside momentum.
**Recent Performance:**
In recent weeks, NASDAQ Futures rallied to achieve an all-time high but have since moved into a phase of consolidation. Price action has narrowed considerably, with the daily range contracting to 158 points from 192 points, reflecting decreasing volatility. The consolidation reflects growing caution in the market amidst an environment of tightening economic conditions and continued uncertainty.
**Expert Analysis:**
Market analysts have pointed out that consolidation following a strong rally is not uncommon. However, technical indicators are showing early signs of weakness. NASDAQ Futures currently trade near critical support levels aligned with the 50-day simple moving average (SMA). A breakdown below these levels could trigger a more significant correction to the downside. Resistance at $23,200 remains strong, and the inability to breach this level confirms bearish sentiment. Furthermore, a lack of supportive macroeconomic catalysts could prolong this period of weak momentum or further amplify the downside risks.
**News Impact:**
Recent market news includes heightened geopolitical tensions and the continued ripple effects of economic tariffs. These developments have dampened sentiment across equity markets, contributing to heightened caution and consolidation trends. Investors should carefully analyze updates on these fronts, as any resolution or escalation has the potential to swing markets significantly.
**Trading Recommendation:**
Given the consolidation observed in the NASDAQ Futures and the emerging signs of bearish momentum, a short position with targets at $22,400 and $22,200 is recommended. This setup is aligned with technical indicators and key macroeconomic concerns currently influencing market dynamics. Stop levels are set at $23,150 and $23,320 to manage risk in case of unexpected bullish reversals.
NQ Power Range Report with FIB Ext - 7/14/2025 SessionCME_MINI:NQU2025
- PR High: 22890.50
- PR Low: 22803.00
- NZ Spread: 195.0
No key scheduled economic events
0.33% weekend gap to previous week low, unfilled
Session Open Stats (As of 1:15 AM 7/14)
- Session Open ATR: 289.88
- Volume: 36K
- Open Int: 270K
- Trend Grade: Neutral
- From BA ATH: -1.0% (Rounded)
Key Levels (Rounded - Think of these as ranges)
- Long: 23239
- Mid: 21525
- Short: 20383
Keep in mind this is not speculation or a prediction. Only a report of the Power Range with Fib extensions for target hunting. Do your DD! You determine your risk tolerance. You are fully capable of making your own decisions.
BA: Back Adjusted
BuZ/BeZ: Bull Zone / Bear Zone
NZ: Neutral Zone
NASDAQ: Time For A Pullback?In this Weekly Market Forecast, we will analyze the NASDAQ for the week of July 14 - 18th.
The NASDAQ had a strong week, until Tariff Tensions Friday arrived.
This by itself doesn't mean we should start looking for sells. Just like the S&P 500, I'm expecting short term bearishness, as price goes from ERL to IRL.
With Tuesday CPI Data coming, this short term consolidation is to be expected until the news is announced.
Let the markets pick a direction, and flow with it.
Have a plan of action in place so you can react to the price action promptly!
Enjoy!
May profits be upon you.
Leave any questions or comments in the comment section.
I appreciate any feedback from my viewers!
Like and/or subscribe if you want more accurate analysis.
Thank you so much!
Disclaimer:
I do not provide personal investment advice and I am not a qualified licensed investment advisor.
All information found here, including any ideas, opinions, views, predictions, forecasts, commentaries, suggestions, expressed or implied herein, are for informational, entertainment or educational purposes only and should not be construed as personal investment advice. While the information provided is believed to be accurate, it may include errors or inaccuracies.
I will not and cannot be held liable for any actions you take as a result of anything you read here.
Conduct your own due diligence, or consult a licensed financial advisor or broker before making any and all investment decisions. Any investments, trades, speculations, or decisions made on the basis of any information found on this channel, expressed or implied herein, are committed at your own risk, financial or otherwise.

NASDAQ TRADING IDEA FOR 14-18 JULY 2025The price of NASDAQ is ranging between daily supply zone (23100) and daily demand (22830) and respecting trendline to find next liquidity control at h1 base at 22904 or H4/H1 liquidity control at 22864. I am looking for long opportunities at that area depend on how the price action for and wait confirmation before taking long position.
The price will continue to rise if daily supply breakout and form a new higher high at daily timeframe.
The market will shift direction if the daily demand breakout and I’m focusing to find opportunity taking short position at important key level/zone.

NQ Range (07-08-25)White arrow is stall/drop zone and yellow is strong short. The O/N continues to reset any drops that happen in most Reg Sessions. It appears to me that a weak/fake Euphoric Stage is being played out. The idea of chasing the NAZ (after the O/N redirect) is the game, no chase and the game will end. The O/N has been redirecting for about 2 years (can continue). Again, the recent 25% drop was erased with a Tweet & news release (10 min 2,000 point) move and a few O/N's. Just feels like a fake chase play since the pop of the bottom.
7/11 Trade with NasdaqEven though I don't trade NASDAQ the set up was too good to ignore.
1. Variation: The bears were losing strength and there was a lot of variety (red and blue candles).
2. Wick: The Bullish candle with the long wick rejecting the support area was all I needed to know to get excited.
3. Volume: I need a big candle to confirm the trend is ready to reverse so I went in.!!

Nasdaq ready to dropwe can see the formation of a ressistance zone in daily, and as we explore the chart the best trade for todaty is a short.
targets are in green. entry zone in blue.
have fun
all details are explained in the video.
Elektra

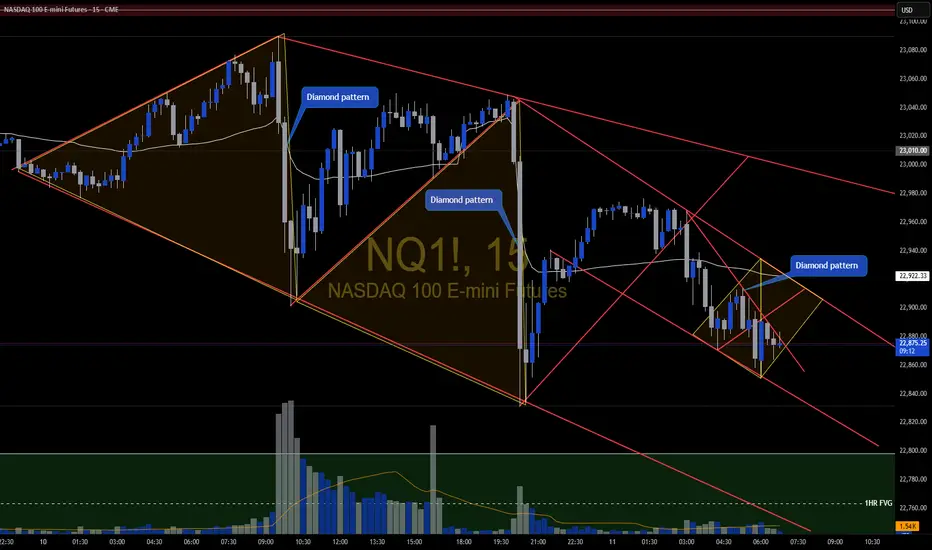
NQ Diamond Repeating patterns You can see the formation of the diamond patterns keep repeating. Big moves come from these. Enter after confirmation & retest.
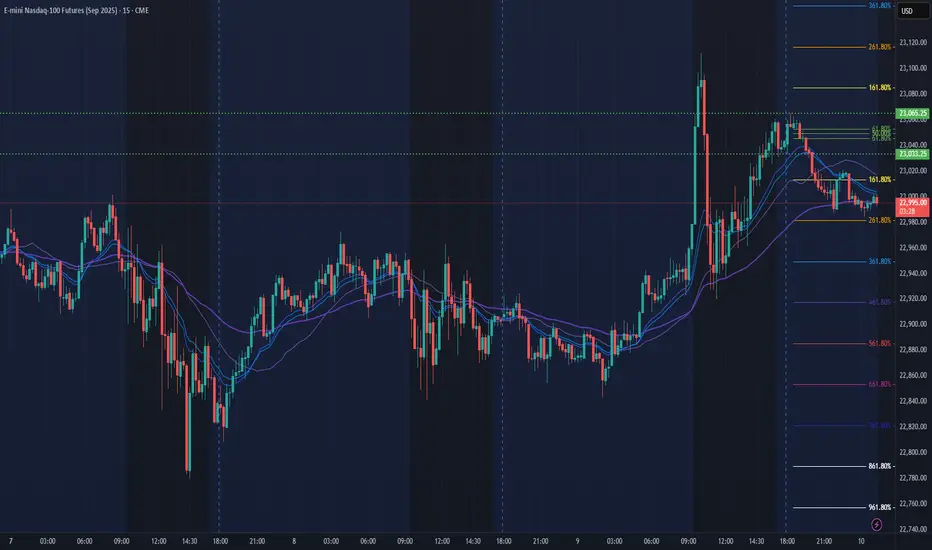
NQ Power Range Report with FIB Ext - 7/11/2025 SessionCME_MINI:NQU2025
- PR High: 23039.75
- PR Low: 23004.50
- NZ Spread: 78.75
No key scheduled economic events
High 200+ range volatility during Asian hours
Session Open Stats (As of 1:35 AM 7/11)
- Session Open ATR: 301.79
- Volume: 48K
- Open Int: 268K
- Trend Grade: Neutral
- From BA ATH: -0.6% (Rounded)
Key Levels (Rounded - Think of these as ranges)
- Long: 23239
- Mid: 21525
- Short: 20383
Keep in mind this is not speculation or a prediction. Only a report of the Power Range with Fib extensions for target hunting. Do your DD! You determine your risk tolerance. You are fully capable of making your own decisions.
BA: Back Adjusted
BuZ/BeZ: Bull Zone / Bear Zone
NZ: Neutral Zone
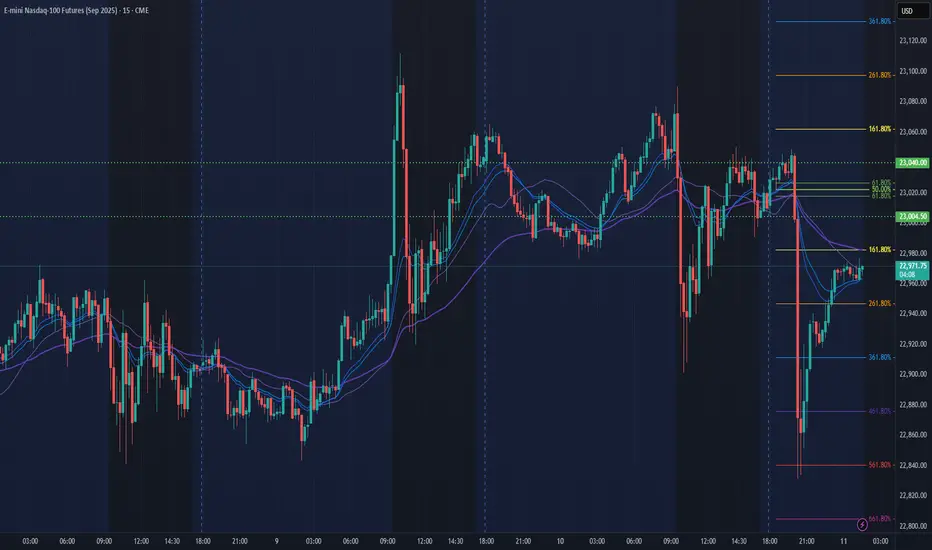
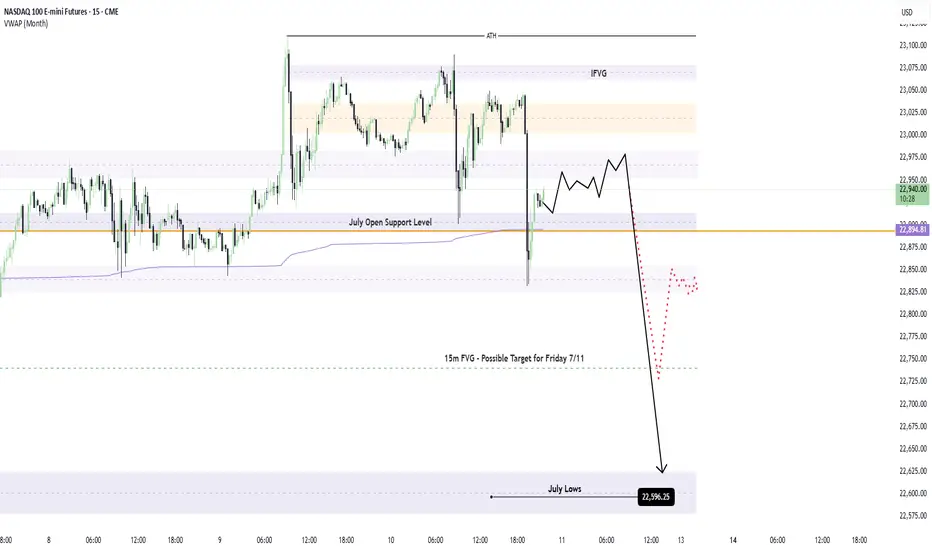
A Bearish July for Nasdaq?I hadn’t anticipated the -212 point move unfolding during the After Hours session—I'd mapped that reaction for the upcoming New York AM session open. That said, with momentum already in play, I’m maintaining my short bias. Price appears poised to revisit the July lows, with a high probability of trading through them and pressing further beneath the Monthly VWAP. I’m eyeing continuation to the downside as long as structure confirms the move.
NASDAQ – Decision Point is Now: Breakout or Breakdown?📈🔍 NASDAQ at Key Inflection – Momentum or Meltdown? ⚠️💥
Hey Traders,
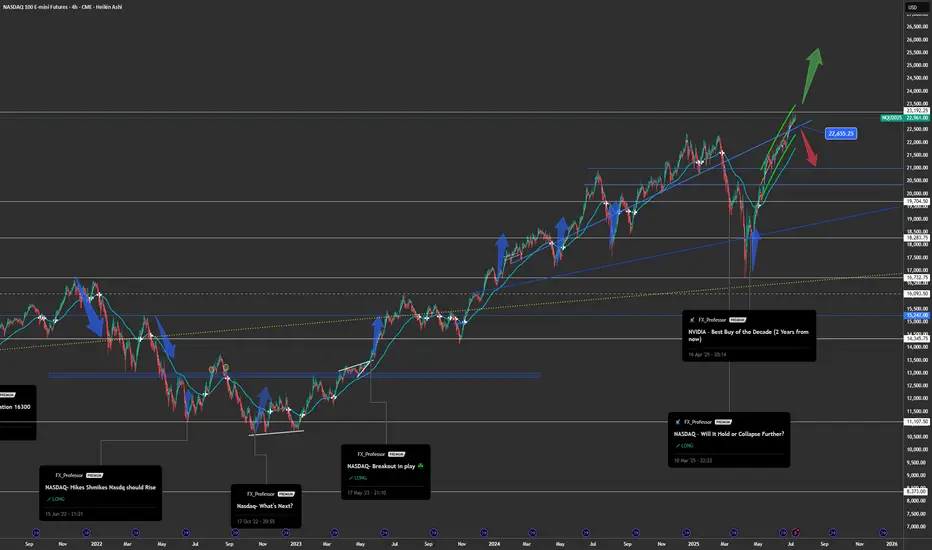
The NASDAQ 100 is now standing right at the make-or-break zone: 22,655. This level marks a critical retest of the recent breakout, and what happens here could define the next major move.
🔵 The Setup:
After a strong bounce and sharp rally from below 18K, we've climbed back into the tight ascending structure. But momentum is slowing…
This zone could produce either a bullish continuation to new highs — or a brutal rejection that unwinds the entire move.
📍 Structure Speaks:
Holding above 22,655 = likely continuation
Breakdown = deeper pullback toward 20,000 and lower channel support
Momentum names like NVIDIA are doing the heavy lifting again — but can they sustain the market alone?
📊 What I'm Watching:
Bullish path = measured target ~25,000+
Bearish path = test of the broader trendline near 20,000 or even the 18,200 region
Macro signals still mixed — stay nimble, not married to one bias
⚠️ Stay Sharp:
Just like in crypto, the Nasdaq can punish both bulls and bears when it enters chop mode. Structure and discipline remain your best defense.
I’ve updated the chart — fresh out the oven 🍞 — and more market ideas are following, including BTC, ETH, and BTC Dominance.
One Love,
The FXPROFESSOR 💙
Disclosure: I am happy to be part of the Trade Nation's Influencer program and receive a monthly fee for using their TradingView charts in my analysis. Awesome broker, where the trader really comes first! 🌟🤝📈
NQ Power Range Report with FIB Ext - 7/10/2025 SessionNQ Power Range Report with FIB Ext - 7/10/2025 Session
CME_MINI:NQU2025
- PR High: 23065.25
- PR Low: 23033.25
- NZ Spread: 71.5
Key scheduled economic events:
08:30 | Initial Jobless Claims
13:00 | 30-Year Bond Auction
Session Open Stats (As of 12:35 AM 7/10)
- Session Open ATR: 300.61
- Volume: 20K
- Open Int: 270K
- Trend Grade: Neutral
- From BA ATH: -0.4% (Rounded)
Key Levels (Rounded - Think of these as ranges)
- Long: 23239
- Mid: 21525
- Short: 20383
Keep in mind this is not speculation or a prediction. Only a report of the Power Range with Fib extensions for target hunting. Do your DD! You determine your risk tolerance. You are fully capable of making your own decisions.
BA: Back Adjusted
BuZ/BeZ: Bull Zone / Bear Zone
NZ: Neutral Zone
NASDAQ analysis NASDAQ has been making ATH regularly. We analyise to see where to take entry based on price action.

2025-07-09 - priceactiontds - daily update - nasdaqGood Evening and I hope you are well.
comment: Bears just need to do more. As long as we are not leaving behind bear gaps, bulls keep buying the dips. Wait for long pullbacks if we keep making higher lows. The bull channel is also still valid.
current market cycle: bull trend
key levels: 22700 - 23300
bull case: As long as Bulls stay comfortably above 22500, they are fine and sideways is a very bullish correction for them. Bears are certainly not doing much, so bulls buy every dip. Nothing changed. Might go up to 23300 or higher. No one knows where it will end but it’s likely orange face will end it and he will make sure he announces it in his private Epstein-and-Friends signal group in advance. Some put options 3-6m are fine to buy I think.
Invalidation is below 22700.
bear case: Bears are just not doing enough. Need something below 22700 and most likely an event to be the catalyst for it. I will leave it at that.
Invalidation is above 23500.
short term: Neutral until US-EU tariff shit show get’s a nice tweet or so. We will go down hard again. Be patient.
medium-long term - Update from 2024-06-29: No change in plans. I expect 20000 to get hit over the next 3 months and maybe 19000 again.
trade of the day: Long US open was a bit obvious but buying the huge drop was not.
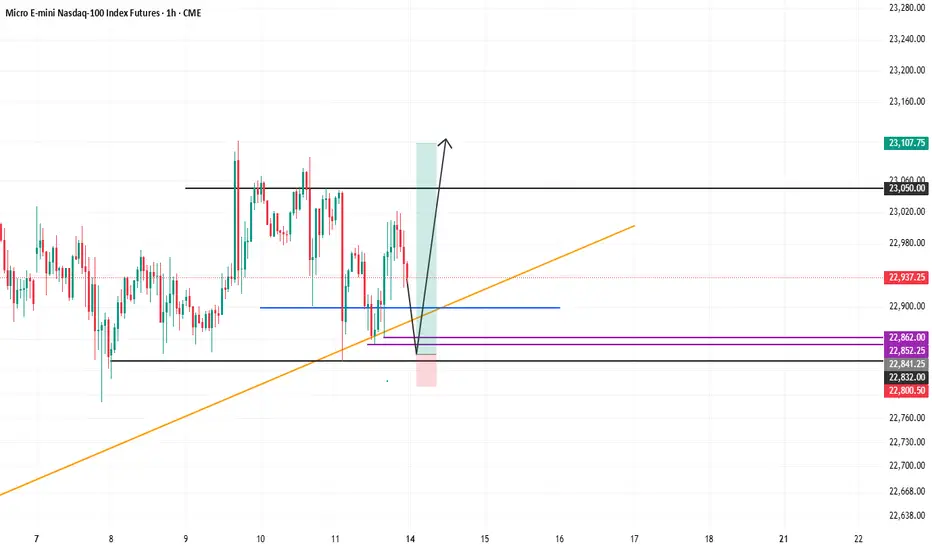
MNQ setups Ok, So since i just woke up so i wont describe much on this chart.
What i would like to see is the following, price retraces to the blue box (where there is too much liq before that blue box), then continue upwards.
also if the price just closes above 23000, then its also good to wait until the price reaches back to 22860 and then go long from there.
You can also take some counter trend trades in between if the price doesn't show momentum to continue upwards. That would happen if the price closes below 22900.
