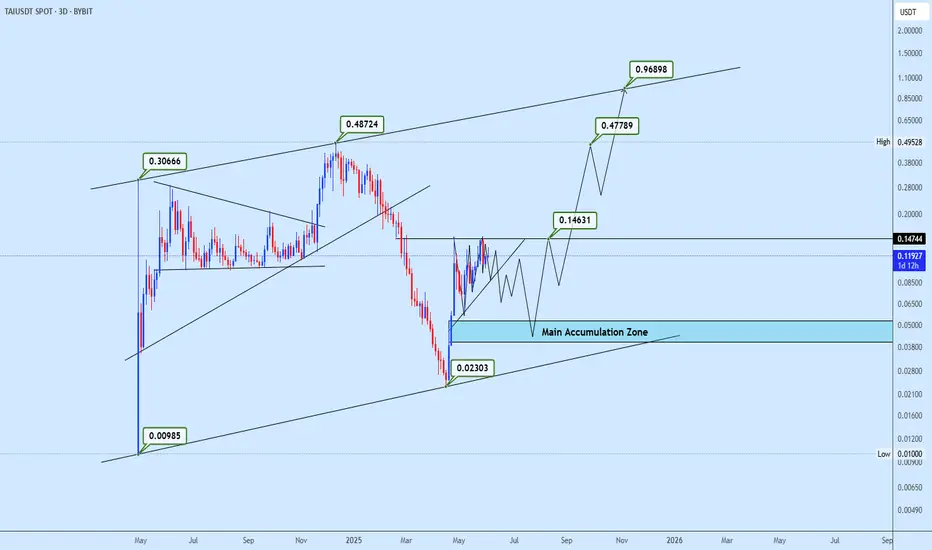
TAIAUSDT Eyeing Re-accumulation Within Ascending ChannelTAIAUSDT continues to develop within a potential ascending channel structure, clearly respecting both dynamic support and resistance boundaries. The lower boundary near 0.02303 serves as a key support level, while the upper boundary around 0.48774 marks a significant resistance zone and the projecte
#TAI/USDT#TAI
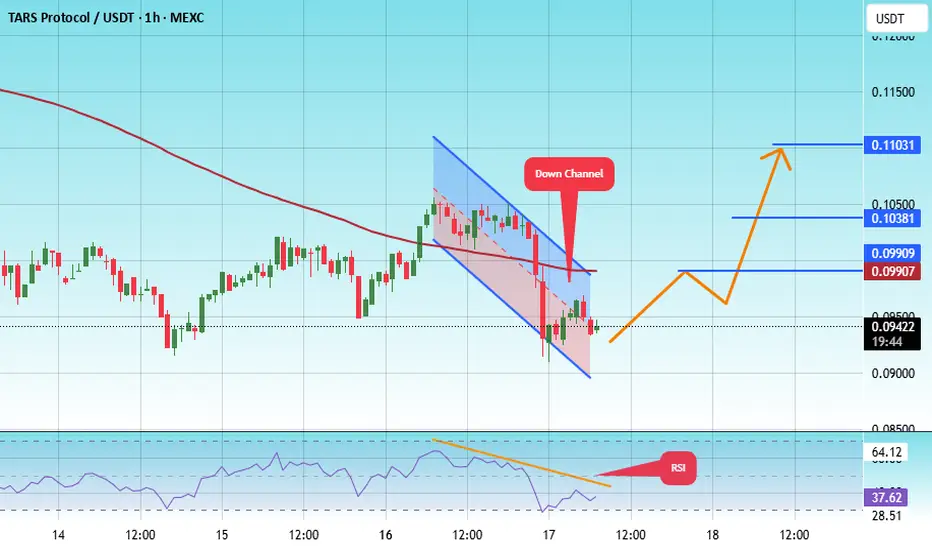
The price is moving within a descending channel on the 1-hour frame, adhering well to it, and is heading for a strong breakout and retest.
We are experiencing a rebound from the lower boundary of the descending channel. This support is at 0.090600.
We are experiencing a downtrend on the RSI i
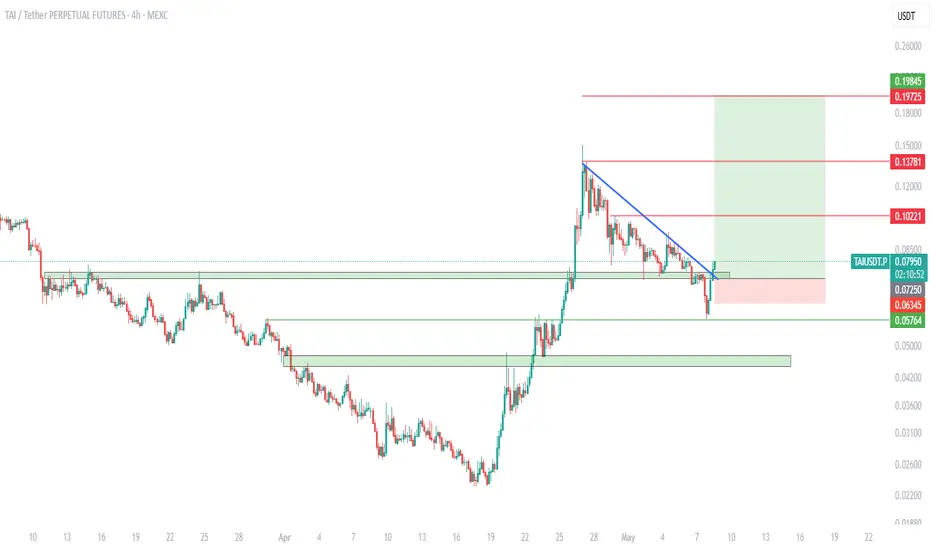
$TAIUSDT - Breakout Confirmed, Momentum Building !CSE:TAI has just broken out of a clean descending trendline after multiple rejections — a sign of renewed bullish momentum. The breakout occurred right above a key support zone (around $0.0725), which held perfectly after a brief shakeout below, triggering a bounce.
Trendline Breakout: After for
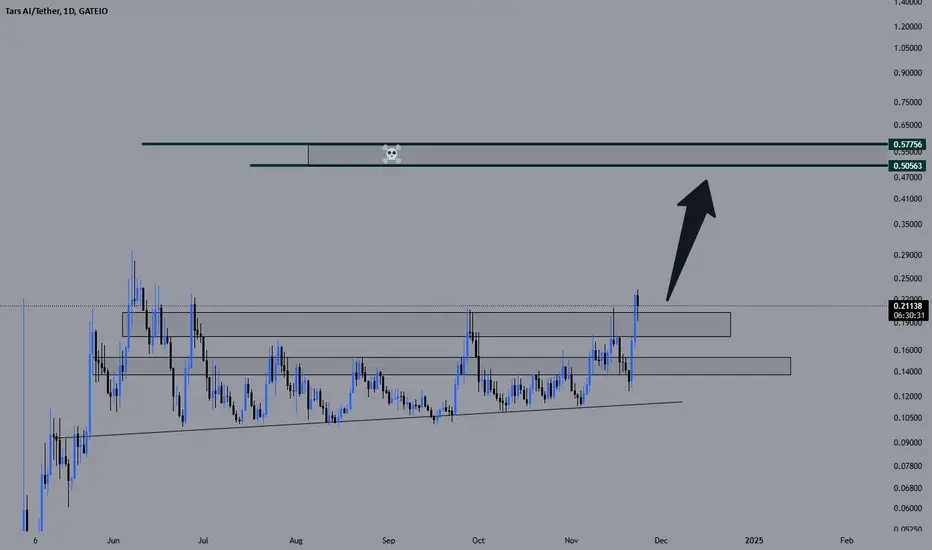
TARS AI - TAIUSDTSolana's Flagship AI Market - TAIUSDT looks like it will retest $0.02 level before going back up.
I wonder if we can get lucky enough for price to dip below $0.02?
Looking forward to capturing price this low.
Enjoy tars.pro
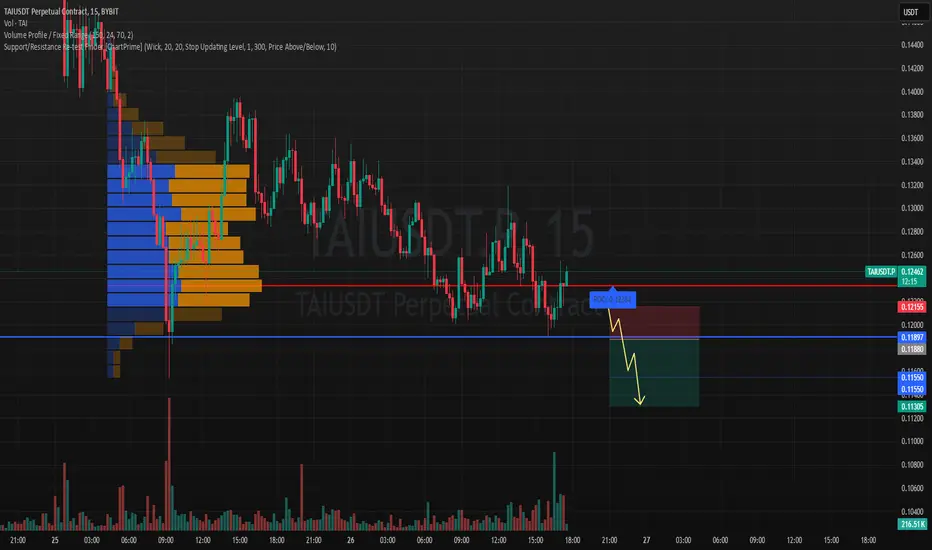
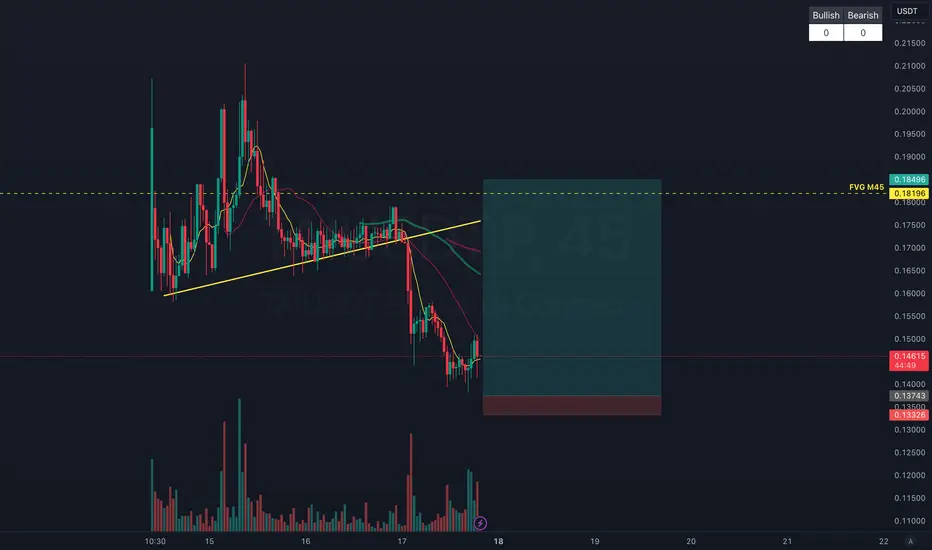
#TAIUSDT – Bearish Scenario, Expecting a Downward Breakout📉 SHORT BYBIT:TAIUSDT.P from $0.11880
🛡 Stop Loss: $0.12155
⏱ 15M Timeframe
⚡ Trade Plan:
✅ The BYBIT:TAIUSDT.P price is in a downtrend, continuing to decline after testing the POC (Point of Control) at $0.13002.
✅ The asset is currently near the $0.11887–$0.12155 support zone, and a break
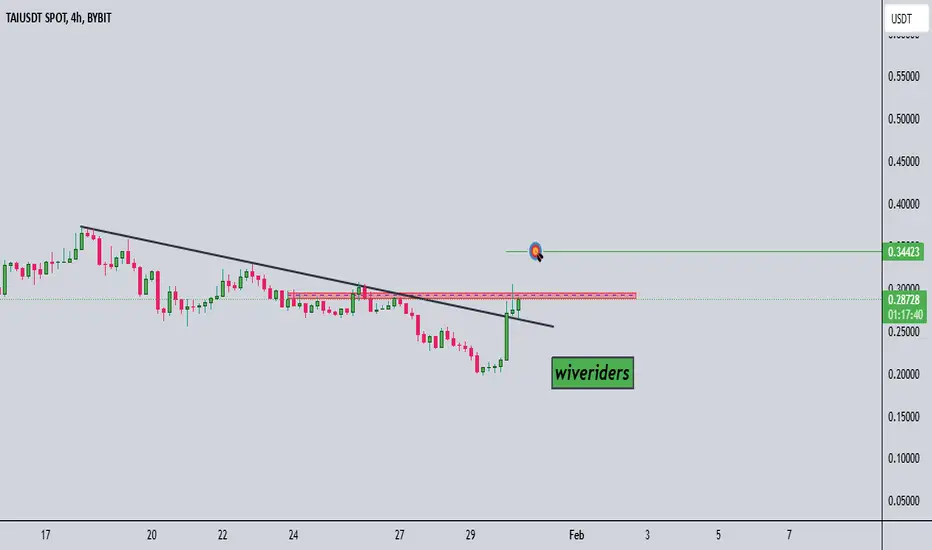
$TAI/USDT AnalysisCSE:TAI is testing the red resistance zone.
🎯 Targets if breakout occurs:
1️⃣ First Target: Green line level
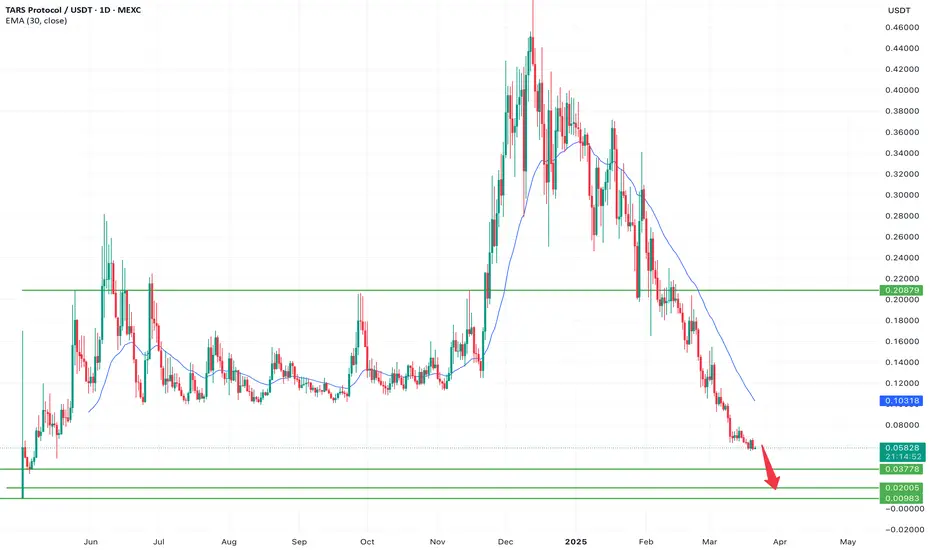
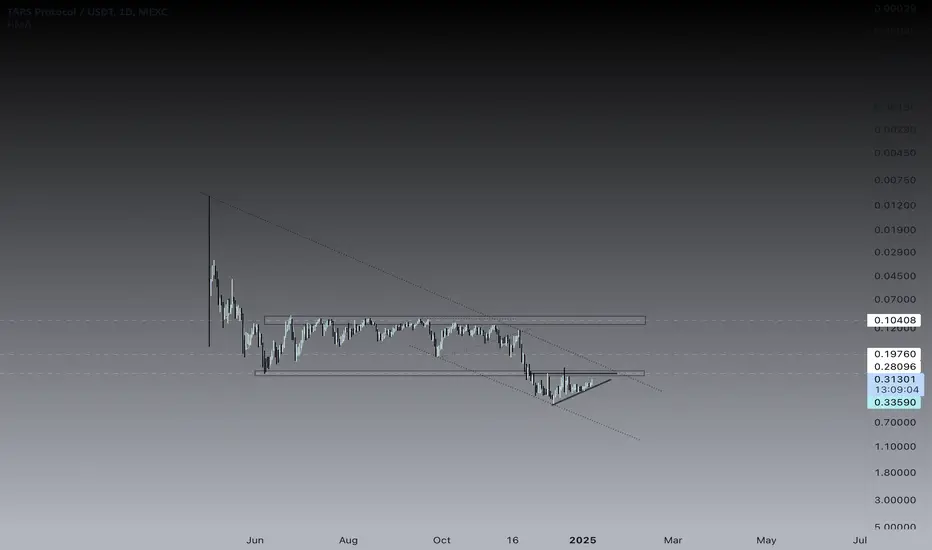
TARS AIAs you can see, this token has been in a consolidation phase for 3 months. The bears couldn't break the support, and the bulls couldn't break the resistance. 🐂⚔️🐻
While the candles can indicate it's more bullish than bearish, to me, the pattern looks like a bearish ascending triangle. If the price d
Do you like 4rr? $Tai make itHello guys,
it is great to have tai here to make for us 4rr :))
us this

TAI ON FIREI think this is a real gem .
be sure to buy this currency, in the shortest possible time, i think it will reach 0.5 $$...
be safe
TAIUSDT LONG HEREThis could be the local bottom entry for now. Let see how this chart plays out. Based on my Strat.
See all ideas
Summarizing what the indicators are suggesting.
Oscillators
Neutral
SellBuy
Strong sellStrong buy
Strong sellSellNeutralBuyStrong buy
Oscillators
Neutral
SellBuy
Strong sellStrong buy
Strong sellSellNeutralBuyStrong buy
Summary
Neutral
SellBuy
Strong sellStrong buy
Strong sellSellNeutralBuyStrong buy
Summary
Neutral
SellBuy
Strong sellStrong buy
Strong sellSellNeutralBuyStrong buy
Summary
Neutral
SellBuy
Strong sellStrong buy
Strong sellSellNeutralBuyStrong buy
Moving Averages
Neutral
SellBuy
Strong sellStrong buy
Strong sellSellNeutralBuyStrong buy
Moving Averages
Neutral
SellBuy
Strong sellStrong buy
Strong sellSellNeutralBuyStrong buy
Displays a symbol's price movements over previous years to identify recurring trends.