TAOUSDT 1DTAO ~ 1D Analysis
#TAO Forming a descending channel pattern on time frame 1D. Buy after successfully penetrating this resistant line or buy at blok support.
TAOUSDT.P trade ideas

#TAOUSDT ( black line )It is also clear from the chart that if it can cross the black resistance line,
it will have good growth.
So we are watching the strong passage of this resistance

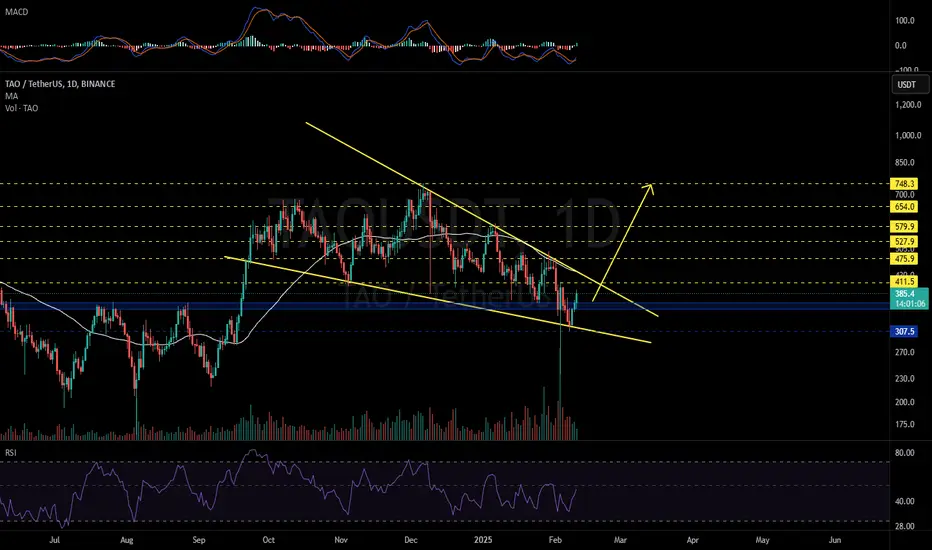
TAOUSDT 1D#TAO is moving within a falling wedge pattern on the daily chart. In case of a breakout above the daily MA50 and the pattern resistance, the targets are:
🎯 $411.5
🎯 $475.9
🎯 $527.9
🎯 $579.9
🎯 $654.0
🎯 $748.3
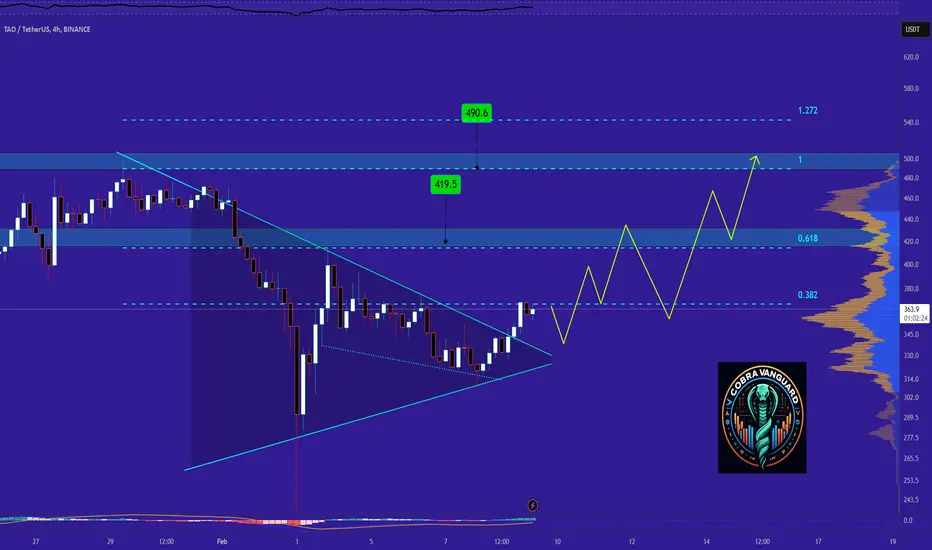
TAO - Time to buy again!The price has now reached the important Fibonacci level of 0.382, which could cause the price to decrease slightly. However, if this resistance level is broken, reaching higher targets is not out of the question.
Give me some energy !!
✨We spend hours finding potential opportunities and writing useful ideas, we would be happy if you support us.
Best regards CobraVanguard.💚
_ _ _ _ __ _ _ _ _ _ _ _ _ _ _ _ _ _ _ _ _ _ _ _ _ _ _ _ _ _ _ _
✅Thank you, and for more ideas, hit ❤️Like❤️ and 🌟Follow🌟!
⚠️Things can change...
The markets are always changing and even with all these signals, the market changes tend to be strong and fast!!
TAO HTF Risky LO play!I expect the price to reverse from here, if USDT.D and other major charts are at the key levels!
Although the SL is very tight (3. something % away) i put here a LO. If this level will be taken, then iI believe it will be taken with a wick!
If i will get stoped out, i will reenter with MO in the region of daily FVG @257ish!
I suggest everyone just ignore this idea and don\t take the trade, since im experimenting with entries :)

BITTENSORGIANT TRI ANGEL. The pattern is playing out to line up with The coming back of big money in September from their vacations as they say selling may and go away And this lines up with the return
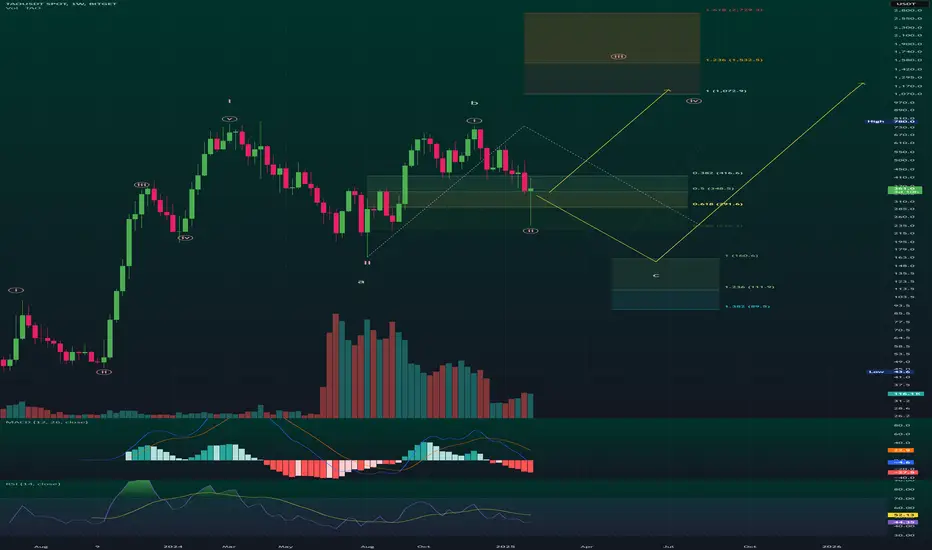
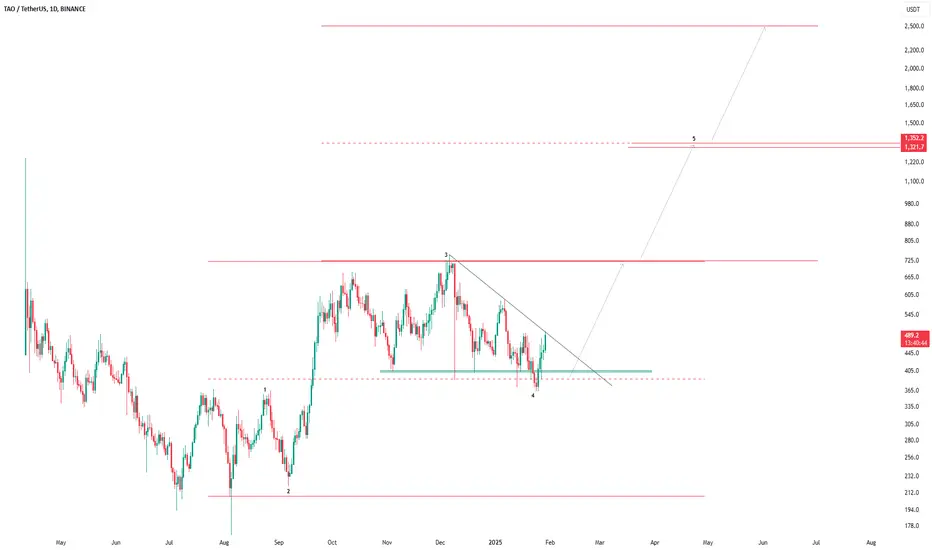
TAO/USDT Weekly Elliott Wave & Fibonacci Analysis📌 TAO/USDT Elliott Wave & Fibonacci Analysis: A Deep Dive 🚀
🔹 Market Structure Overview
The TAO/USDT chart exhibits two potential Elliott Wave scenarios:
A completed Wave 2 correction leading into an impulsive Wave 3.
An ongoing ABC corrective pattern before a bullish move.
Using Fibonacci retracements, extensions, volume trends, and momentum indicators (MACD, RSI), we can refine both scenarios.
🔹 Scenario 1: Impulsive Wave 3 Towards $1,532.5+
Wave 3 Expansion & Fibonacci Levels
The price has retested 0.786 Fib support ($226.3), a historically strong level for a wave reversal.
Wave 3's minimum projected target is $1,532.5 (1.236 Fibonacci extension).
If momentum builds, the 1.618 extension ($2,729.5) could be reached, aligning with strong historical price expansions.
Market Behavior & Momentum
MACD Analysis: A bullish crossover in the MACD histogram would confirm momentum shifting toward an impulsive move.
RSI Trends: RSI stabilizing above 50 would indicate growing buyer strength, supporting the bullish outlook.
Volume Dynamics: Increasing volume at key support levels suggests institutional accumulation.
📌 Confirmation Zone for Wave 3:
A sustained breakout above $740 (recent high) would confirm the beginning of Wave 3.
🔻 Scenario 2: ABC Correction Before Reversal
Potential for a Deeper C-Wave Drop
Instead of an immediate breakout, the market may still be completing an ABC correction.
Wave C targets:
100% Fibonacci Extension: $160.6
1.236 Fibonacci Extension: $111.9
Potential Max Extension: $89.5 (1.382 Fib)
Indicators Supporting a Further Decline
MACD remains bearish, suggesting downside continuation before a reversal.
RSI is not yet at oversold levels, meaning further weakness is possible.
Volume profile shows a lack of aggressive buying, indicating sellers still have control.
📌 Key Reversal Zone for the Next Bullish Cycle:
If the price drops to the $160.6-$111.9 range, a strong bounce could follow, leading into the next impulsive wave.
📌 Conclusion
If $226.3 holds, it strengthens the case for an impulsive Wave 3 move towards $1,532.5+.
If support fails, a final correction to $160.6 or even $111.9 is expected before a strong upside reversal.
Volume and momentum indicators will be crucial in confirming the next major move.
This analysis provides a structured view of potential Elliott Wave formations and Fibonacci-based price levels, giving clear insights into TAO/USDT’s possible market direction.
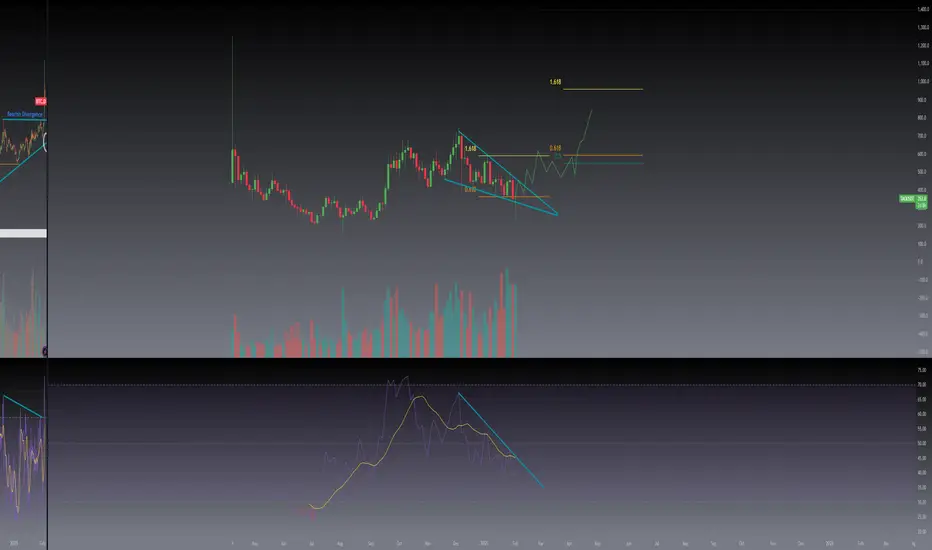
TAO must decrease In order to rise!BINANCE:TAOUSDT
is in a falling wedge pattern! which means the price will decrease for now I expect a turning point around 350!
after that we shall see what happens,my bet is that the price will increase from there and the following targets will be
453,563,609,714
last target is also a resistance!
⚠️ Disclaimer:
This is not financial advice. Always manage your risks and trade responsibly.
👉 Follow me for daily updates,
💬 Comment and like to share your thoughts,
📌 And check the link in my bio for even more resources!
Let’s navigate the markets together—join the journey today! 💹✨

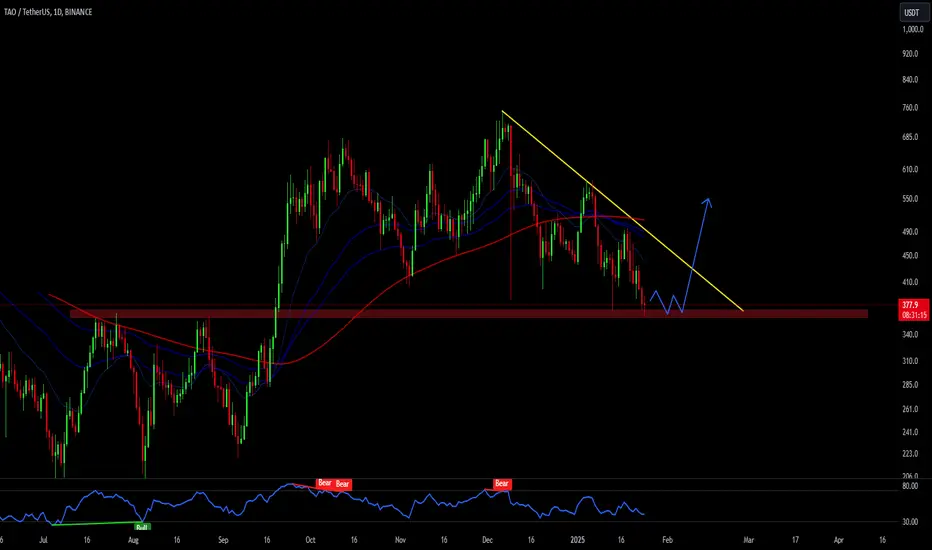
TAO/USDT Technical Analysis: Current Trends and PredictionTrading Idea: TAO/USDT – Potential Breakout and Price Movements
The TAO/USDT cryptocurrency pair shows a descending trend line, indicating a general downward trend. The current price level is 391.2. Historical data reveals key support and resistance zones, which can guide future trading decisions.
**Chart Analysis:**
1. **Current Price:** TAO/USDT is trading at 391.2.
2. **Trend Line:** A descending trend line suggests a continuation of the downward movement.
3. **Support Levels:** Identified around 219.6.
4. **Resistance Levels:** Noted at 755.8.
Projected Price Movements:
- Short-Term: The price may experience a drop towards the support level at 219.6. This level has historically shown strong buying interest.
- Mid-Term: After consolidating around the support level, the price may attempt to break above the descending trend line.
- Long-Term: If the price successfully breaks the trend line, it could rise towards the resistance level at 755.8.
Trading Strategy:
1. Entry Point: Consider entering a position around the support level at 219.6.
2. Stop-Loss: Set a stop-loss order slightly below the support level to minimize potential losses.
3. Take-Profit: Set a take-profit order near the resistance level at 755.8 to capitalize on the potential price rise.
Risk Management:
- Monitor the market closely for any significant changes in trend.
- Adjust stop-loss and take-profit levels based on real-time market conditions.
- Use proper position sizing to manage risk effectively.
Conclusion:
The TAO/USDT chart suggests a potential breakout scenario. We can take advantage of key support and resistance levels to develop a well-informed trading strategy. By carefully managing risk and monitoring market condition.
NOTE: This is not a financial advice, this idea is just for learning process and just PREDICTION.

TAO/USDTAO best and worst case but line traced to stop
Downside trend breaks up, pressure of RSI to top below 80 might push price to test ATH close (not wick)
TAO DAILY For me there are two possible entries for TAO caused by the trade war situation in the US, so this is my take on the chart:
- Wicks get filled as a rule of thumb, so this capitulation wick that has reset all the progress made in Q4 2024. My preferred entry would be a sweep and reclaim of the wick as this coincides with range low and a bullish orderblock, an area of extreme support on the high timeframe.
- Another entry would be the breakout of the diagonal downtrend resistance, if this could coincide with the reclaim of the 0.25 line in the range that would add further confluence and a better R:R IMO.
For both entries the Midpoint would be a key S/R level and would be very high resistance.

TAO What will happen in the short term ?The price might form a head and shoulders pattern, and after the breakout, it could reach 580.
Give me some energy !!
✨We spend hours finding potential opportunities and writing useful ideas, we would be happy if you support us.
Best regards CobraVanguard.💚
_ _ _ _ __ _ _ _ _ _ _ _ _ _ _ _ _ _ _ _ _ _ _ _ _ _ _ _ _ _ _ _
✅Thank you, and for more ideas, hit ❤️Like❤️ and 🌟Follow🌟!
⚠️Things can change...
The markets are always changing and even with all these signals, the market changes tend to be strong and fast!!

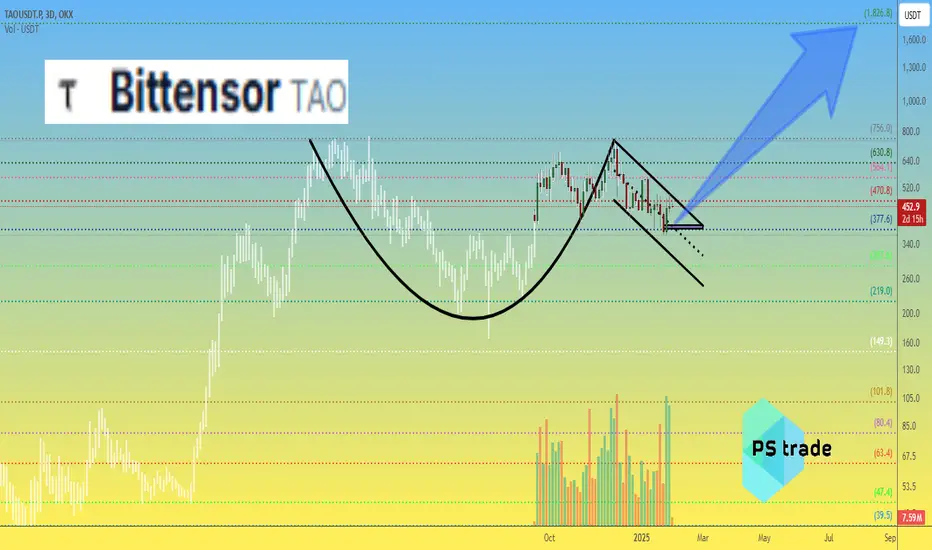
Public trade #20 - #TAO price analysis ( Bittensor )☕️ A cool trend continuation pattern - a “cup with a handle” is drawn on the #TAO chart
An interesting description of the project in the direction of AI development, cute tokenomics - only 21 million coins in circulation ( CRYPTOCAP:BTC says hello)
Let's try to buy a #Bittensor coin for our investment portfolio and copytrading.
🆗 The price of OKX:TAOUSDT.P should not fall below $380-390.
✔️ Well, the goals for long-term growth are modest for some, and grandiose for others!) - $1800
_____________________
Did you like our analysis? Leave a comment, like, and follow to get more
TAO has bottomed?TAO has hit a key support level at $365 and is now reacting, and it could very well be the bottom.
I will wait for confirmation, but it is a great level to DCA in spot if it is a project that interests you. To trade, I will wait first for the price action on smaller timeframes.
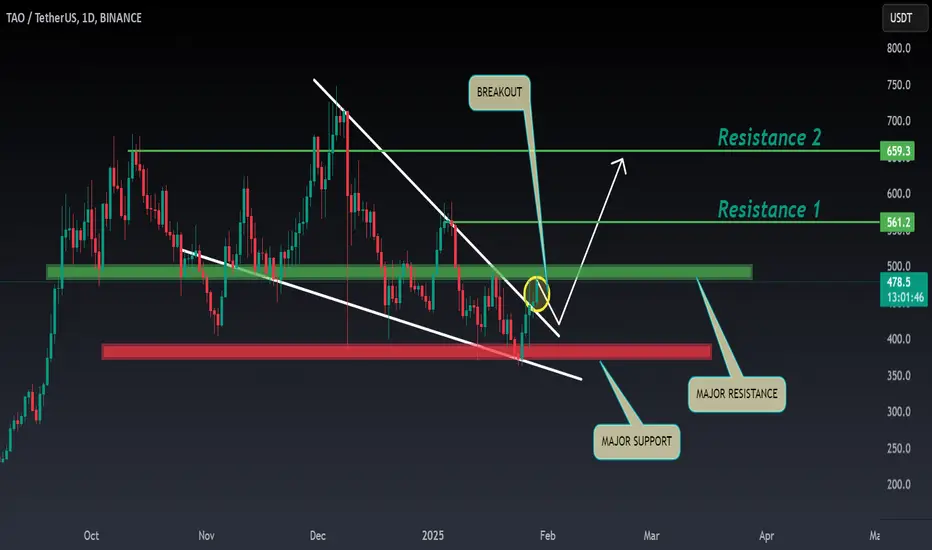
TAO ANALYSIS📊 #TAO Analysis
✅There is a formation of Falling Wedge Pattern on daily chart with a breakout and currently trading around its major resistance area🧐
Pattern signals potential bullish movement incoming after a breakout of major resistance zone
👀Current Price: $479
🚀 Target Price: $659
⚡️What to do ?
👀Keep an eye on #TAO price action and volume. We can trade according to the chart and make some profits⚡️⚡️
#TAO #Cryptocurrency #TechnicalAnalysis #DYOR
TAO Needs More 500% Growth!This cryptocurrency is in a very special position, both fundamentally and technically. Considering the current market conditions and the alt-season ahead of the market, I expect this cryptocurrency to grow at least as much as its previous step in 2025 (to around $2.50).
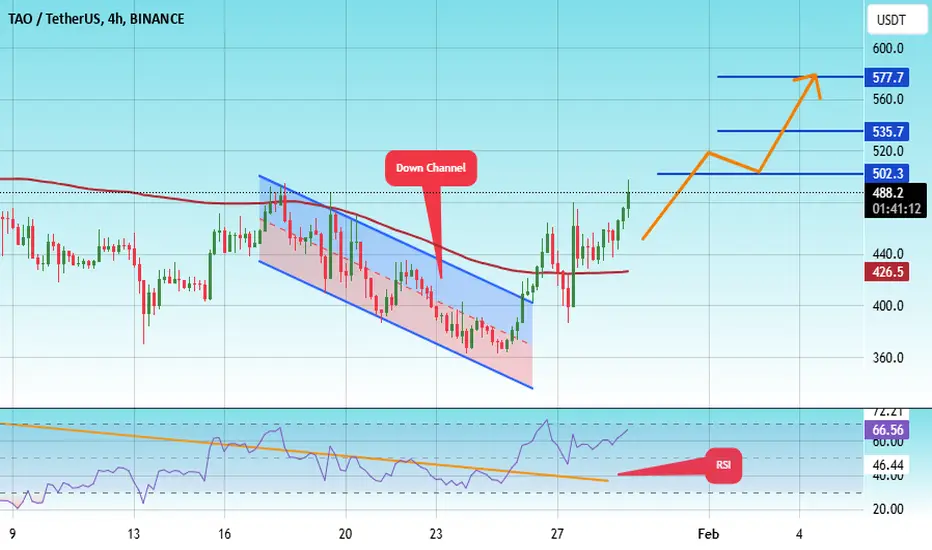
#TAO/USDT Ready to launch upwards#TAO
The price is moving in a descending channel on the 4-hour frame and is adhering to it well and is heading to break it strongly upwards
We have a bounce from the lower limit of the descending channel, this support is at a price of 362
We have a downtrend on the RSI indicator that is about to be broken, which supports the rise
We have a trend to stabilize above the moving average 100
Entry price 472
First target 502
Second target 535
Third target 577
TAO / USDT : On the verge of massive breakout TAO/USDT: On the Verge of a Massive Breakout!
TAO/USDT is setting up for an explosive move 📈 as it hovers near a crucial trendline resistance zone 📊. The price has been consolidating tightly, creating the ideal conditions for a breakout 💥. If confirmed, we could witness a powerful bullish rally unfold 🚀. Stay alert and watch for key confirmation signals before making a move!
Key Insights:
1️⃣ Trendline Resistance: TAO/USDT is approaching a major resistance level that has previously acted as a strong barrier. A breakout above this zone could trigger a significant upside rally.
2️⃣ Volume Surge: Watch for a substantial increase in trading volume during the breakout to confirm strong buyer momentum 🔥.
3️⃣ Bullish Indicators: RSI and MACD are showing increasing bullish momentum ⚡, adding confidence to the breakout scenario.
Breakout Confirmation Checklist:
✅ A solid 4H or daily candle closing above the trendline.
✅ A sharp increase in volume during the breakout to confirm buying pressure.
✅ A successful retest of the broken resistance as a new support zone for added validation.
⚠️ Be mindful of potential fake breakouts, such as sharp reversals or long wicks above resistance.
Risk Management Strategies:
🔒 Use stop-loss orders to protect against unexpected reversals.
🎯 Ensure proper position sizing to align with your overall risk management strategy.
This analysis is for educational purposes only and not financial advice. Always DYOR (Do Your Own Research) before making any investment decisions! 🔍

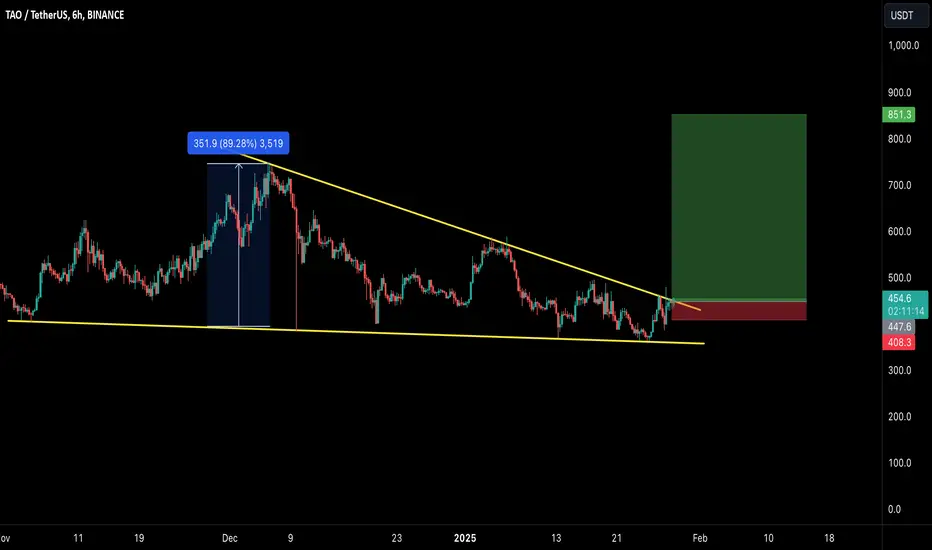
TAO/USDT: LOOKS READY TO GO ABOVE $800 MARK!!🚀 Hey Traders! Ready to Ride the TAO Wave? 👋
If this setup excites you, smash that 👍 and hit Follow for premium trade ideas that deliver real results! 💹🔥
TAO is looking primed for action! Breaking out of a falling wedge pattern on the 6-hour timeframe, it’s signaling a potential 80-90% upside move. 📈🔥
💡 Here’s the Plan:
📌 Entry Range: Current Market Price (CMP) and add more up to $430.
🎯 Targets:
Target 1: $530
Target 2: $620
Target 3: $710
Target 4: $850
🛡️ Stop Loss (SL): $400
⚙️ Leverage: Use low leverage (Max 5x) for a safer approach.
💬 What’s Your Take?
Are you bullish on TAO’s breakout potential? Drop your analysis, strategies, or predictions in the comments! Let’s crush this market and lock in those gains together! 💰🚀
Analysis of $TAO/USDTThe GETTEX:TAO coin is showing a clear wave pattern in an upward impulse, followed by a slight zigzag correction. The coin now appears ready to continue its upward wave.
📈 If the predictions hold, the first target could reach $1600 or higher.
Disclaimer: This analysis is not a recommendation or an invitation to buy, but rather a personal opinion based on the study of wave patterns.
#TAO
#USDT
#WaveAnalysis
#CryptoTrading
#Blockchain

TAOUSDTBoth side liquidity taken. TAO is gearing up for a break out and head towards 800 USDT range.
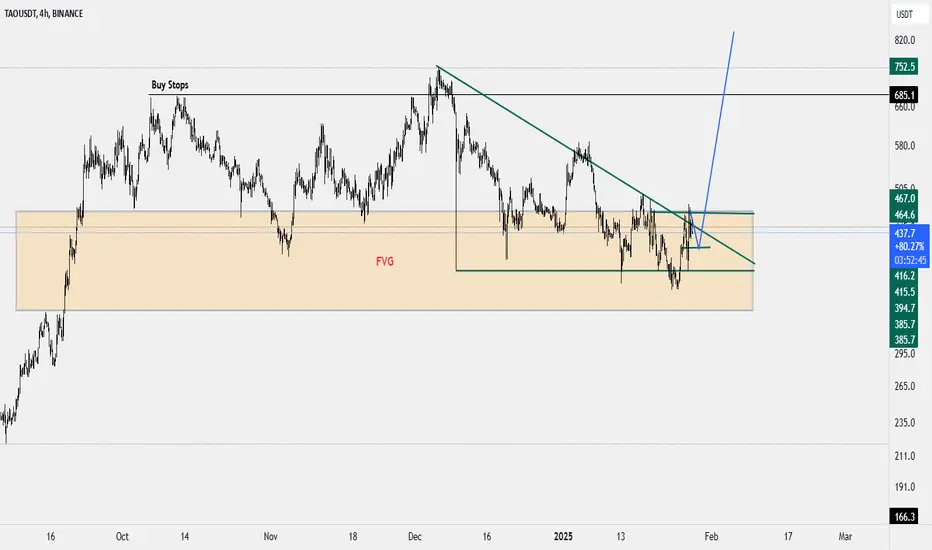
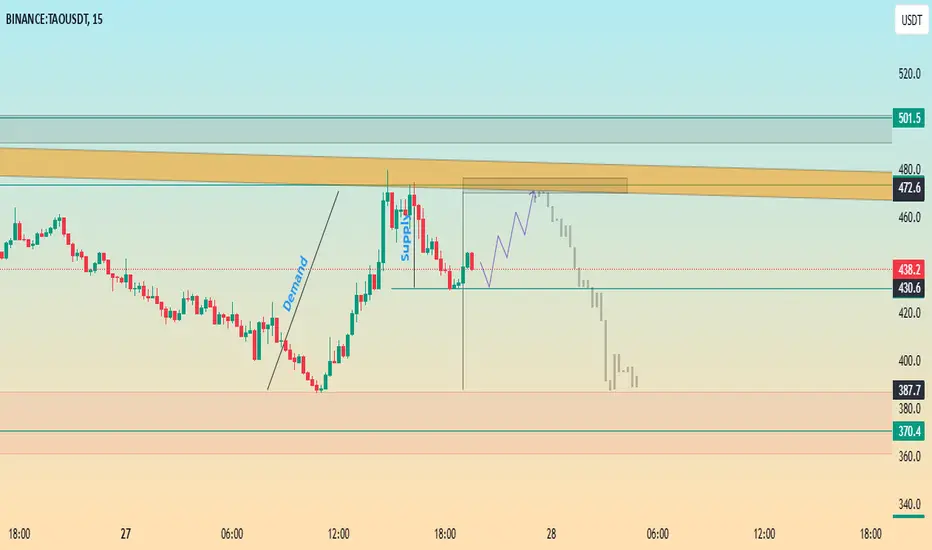
TAO Short Opportunity, after a breakWe got half the supply of the demand. The price is expected to continue moving to upside resistance and then retrace back to the lower support.
Upside resistance target: $471.2
Downside support targets: $387.7 and $370.4
Follow for more updates