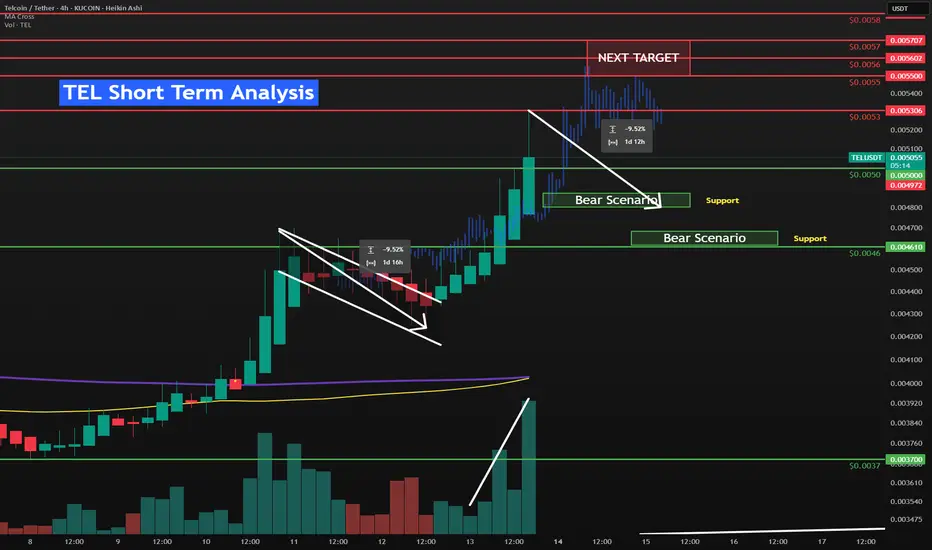
TEL short term to $0.0057 resistance⚡️ NYSE:TEL broke out of the Flag pattern, snatched up the liquidity and broke through multiple short-term resistances between $0.0044 to $0.0052. Finding resistance at $0.0053.
⚡️It is currently retracing down to the 0.382 fib level and the $0.005 psychological resistance that has now become support.
⚡️ NYSE:TEL momentum has increased/sped up as seen by it moving faster than the recent blue bars pattern. I mentioned this in a post two days ago.
TEL Short Term Bull Scenario
🟢$0.0053 is the current key short-term resistance
🟢$0.0057 represents the full repeat of the September 12th 2024 pump that this has appeared to be copying.
🟢🟢The previous rally before the flag was 26% bottom to top. We have room left to get to that before another 10% retracement. We should easily go to $0.0055-$0.0057 from here.
TEL Short Term Bear Scenario
🔴Retrace to around the $0.0048 which is the 0.5 fib retracement, a psychological level and also matches the recent flag pull-back size of 9.5%. There is a bunch of liquidity built up between $0.0047 and $0.0045 but I think that is just risk management at this point.
Liquidation Levels
NYSE:TEL Liquidation Heatmap - It will be interesting to watch the Liquidation Heatmap over the next few hours, as we should see new liquidity appear above the current price.
CRYPTOCAP:BTC has futures liquidity built up at $116k this normally suggests a downward move. I think the Macro factors are too strong for that. But we need time to see the charts print more volume above current price. CRYPTOCAP:BTC is building up liquidity at $123k too but it is less dense.
My thinking is we catch a breather and trade sideways here to solidify this level. Then break through local highs, BTC to break through the $120k psychological level and head up to $123k liquidity then retrace. Which would line up with NYSE:TEL hitting resistance at $0.0057.
TELUSDT trade ideas
The Telcoin Explosion Starts Now!Telcoin reminds me of the early days of the Bitcoin cycle. I see strong potential for a massive pump coming soon. When cycles are this undervalued—when the community is strong, the fundamentals are solid, and the chart looks amazing—almost nothing can stop a parabolic run from happening.
As always, stay profitable.
– Dalin Anderson

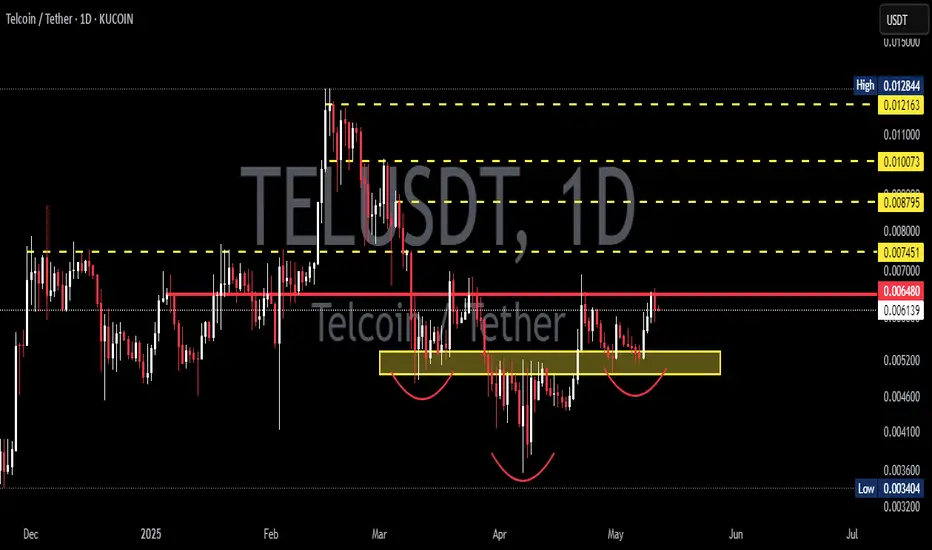
TELUSDT 1D Analysis TEL ~ 1D Analysis
#TEL Buy on retesting this support block or buy after successfully breaking the $0.00648 resistance line with a short term target of at least 10%+.
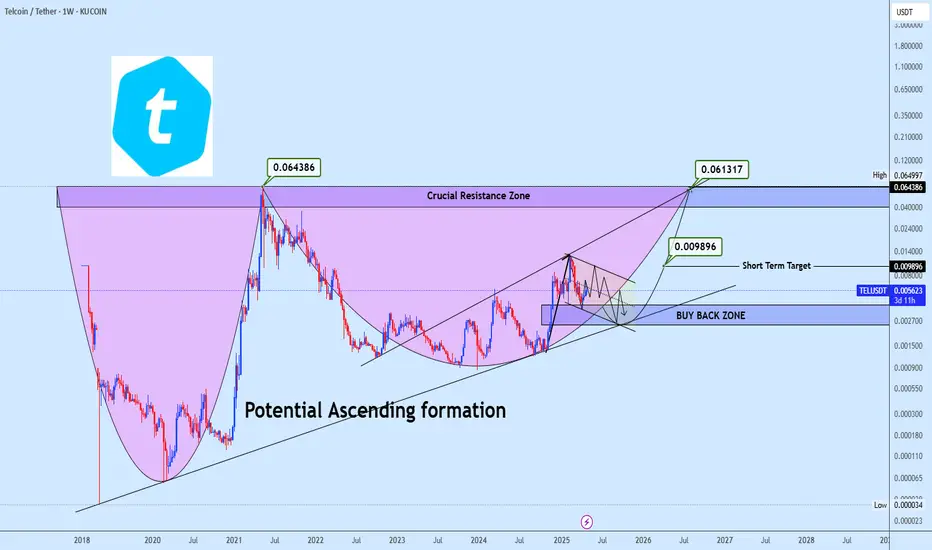
Telusdt Buy opportunitySpotted a potential ascending formation with price currently developing a mini bullish flag. This structure suggests an underlying accumulation phase ahead of a potential breakout.
The strategic focus is the Buy Back Zone, a key area for strong accumulation entries. Targets are clearly mapped on the chart, with 0.009896 as the first short-term objective, followed by 0.061317.
The final critical area to monitor is the Crucial Resistance Zone, acting as the neckline of the entire setup—its breakout will confirm a long-term structural shift. Watching closely for sustained momentum.
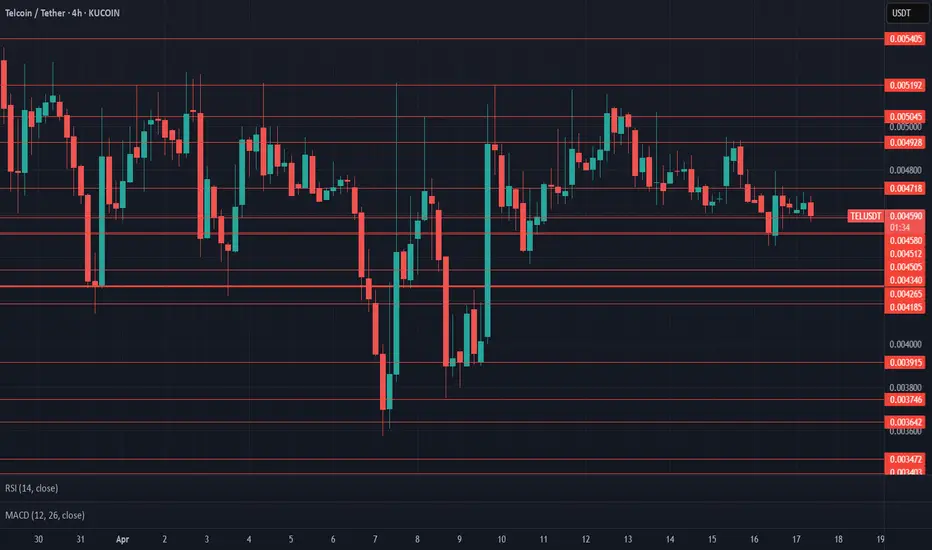
$TEL UpdateNYSE:TEL at $0.004580 support area, moving with #Bitcoin, $0.004928 current resistance, $0.005192 key resistance area to exit and get back above $0.0050, been under $0.005192 resistance since March 29. On 1D time-frame showing potential for more price decline with declining volume and slight incline on MACD. Bearish engulfing forming on current 4H, and 1D with bullish pin bar but no follow up, high influence of CRYPTOCAP:BTC 's movement here. $0.004505 next support area. $0.004265-$0.004165 support to watch for below $0.004505.
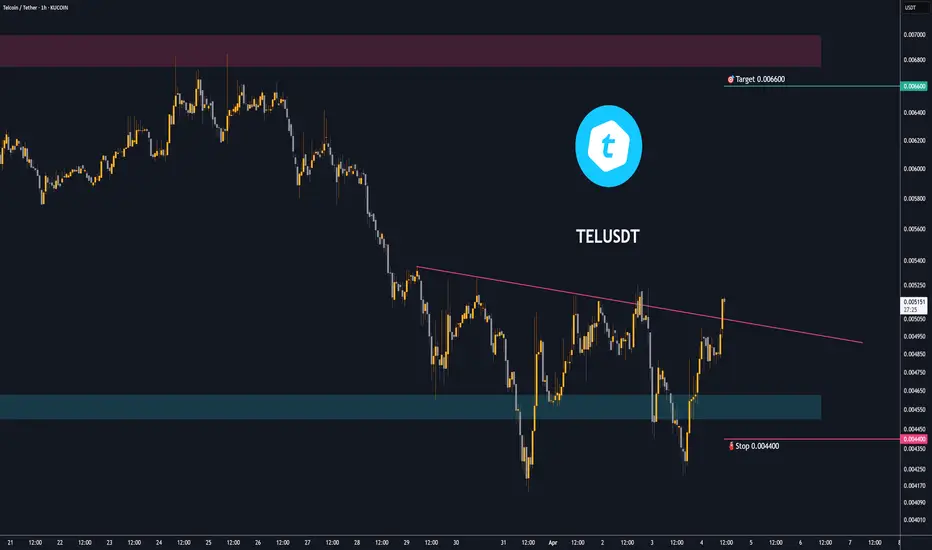
Trading opportunity for TELUSDTBased on technical factors there is a Buy position in :
📊 TELUSDT
🔵 Buy Now
🪫Stop loss 0.004400
🔋Target 0.006600
📏 R/R 2
💸RISK : 1%
We hope it is profitable for you ❤️
Please support our activity with your likes👍 and comments📝
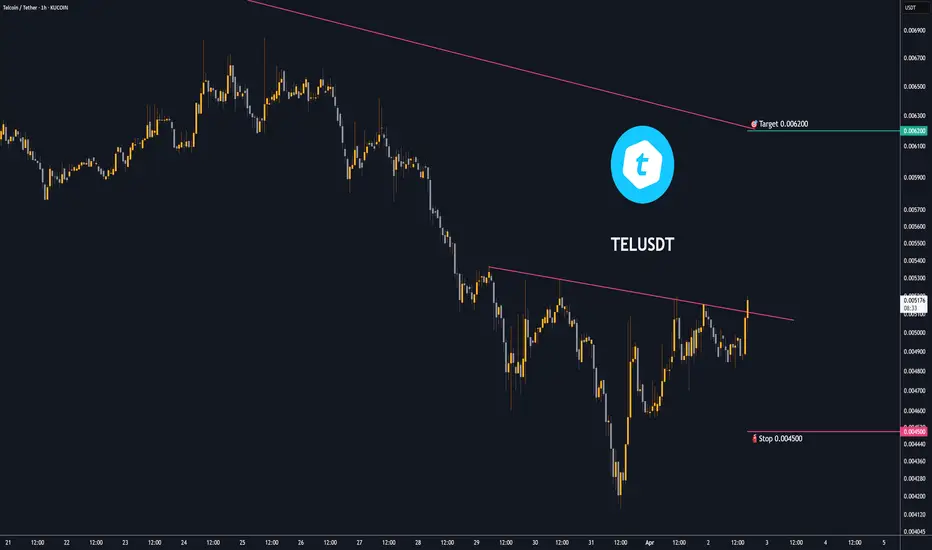
Trading opportunity for TELUSDTBased on technical factors there is a Buy position in :
📊 TELUSDT
🔵 Buy Now
🪫Stop loss 0.004500
🔋Target 0.006200
📏 R/R 1,7
💸RISK : 1%
We hope it is profitable for you ❤️
Please support our activity with your likes👍 and comments📝
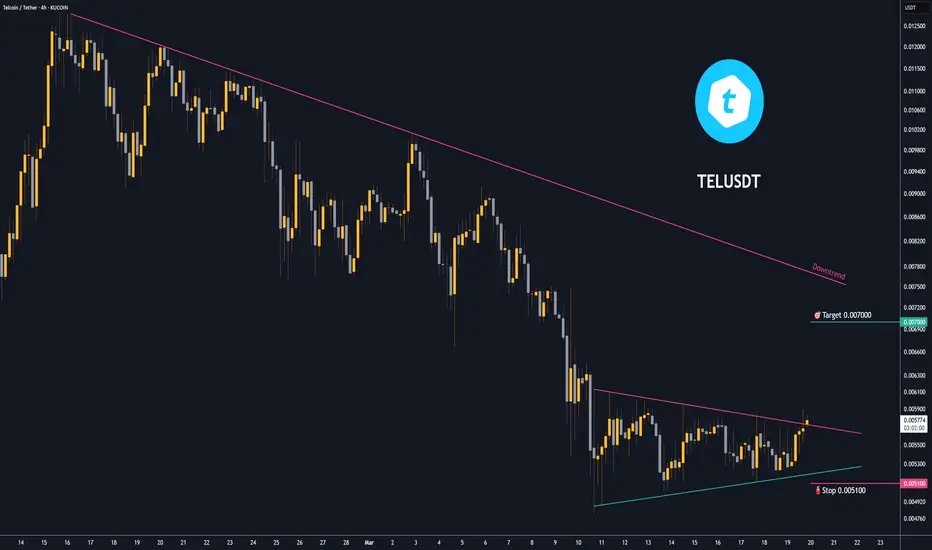
Trading opportunity for TELUSDTBased on technical factors there is a Buy position in :
📊 TELUSDT
🔵 Buy Now
🪫Stop loss 0.005100
🔋Target 0.007000
📏 R/R 2
💸RISK : 1%
We hope it is profitable for you ❤️
Please support our activity with your likes👍 and comments📝
Tel coin bullish on the hourly Things are still looking bullish for Telcoin small timeframe looks bullish if we can confirm the breakout of this head and shoulders. macro timeframe looks bullish as well.
Big inverse head and shoulder Big head and shoulders playing out since 2023. It appears we’re making another retest on the neck line. Don’t get shaken out.

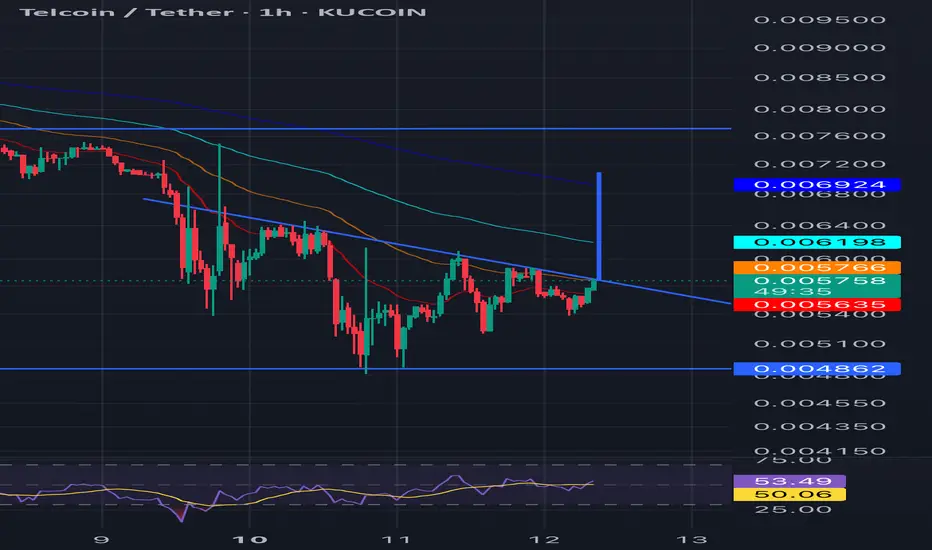
TELUSDT Trading ideaTELUSDT is exhibiting a breakout above a potential falling wedge formation, indicating a bullish reversal signal.
The price appears to be aiming to complete the final leg of its corrective wave, suggesting a pullback towards the accumulation zone as part of the broader retracement structure. The price path suggests the immediate resistance level as a critical area to monitor.
Should price face rejection at this resistance, it could trigger a downward move, potentially retesting lower levels within the wedge or accumulation zone. However, a breakout above this resistance would invalidate the downside bias, confirming a shift in market sentiment and opening the door for further bullish continuation.

TEL - Try to break it up!
Telcoin (TEL) is the native medium of exchange, reserve asset and protocol token of the Telcoin user-owned, decentralized financial platform. TEL enables end users to seamlessly access and power a global suite of user owned, decentralized financial products
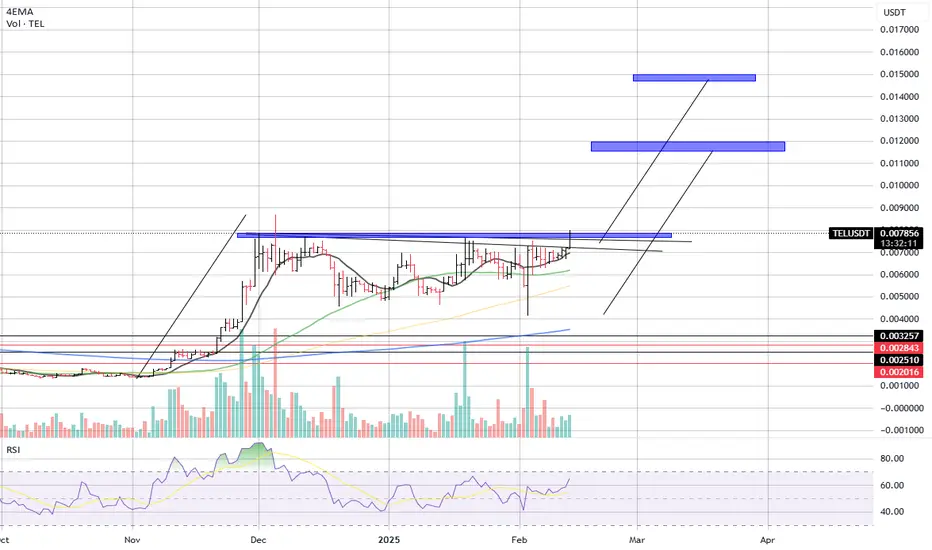
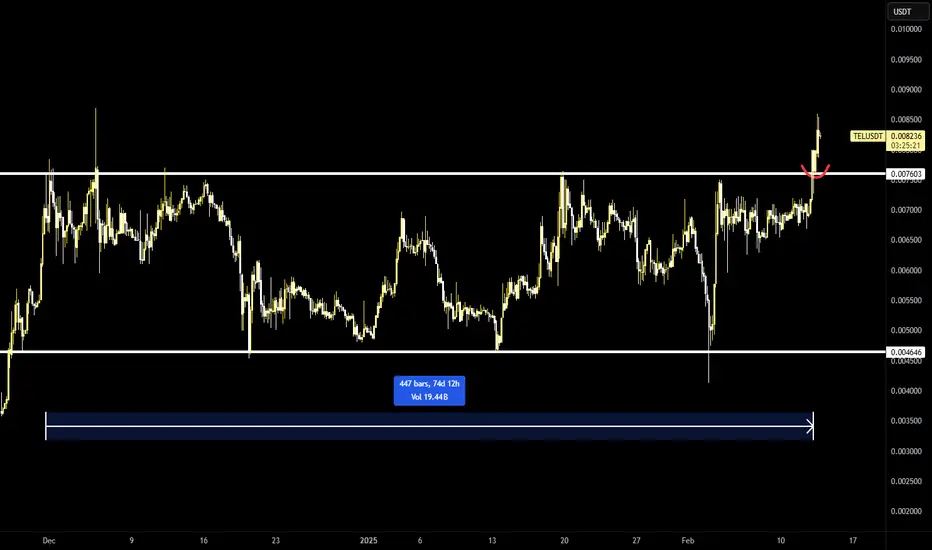
After 75 bars of quiet consolidation, Telcoin (TEL) is showing signs of life, breaking above the key $0.0078 level with rising volume and a well-positioned RSI, signaling a surge in bullish momentum. If this breakout holds, TEL could be setting its sights on the $0.01 - $0.02 range, unlocking a new wave of price discovery.
"The pressure has been building, and now the breakout is in motion. Volume is rising, momentum is shifting, and TEL is eyeing the next leg up. The question is—how high can it go?" 🚀
For us, it can go way up then expected, if volumes and btc momentum will continue to sustain the markets.
Good trading!!
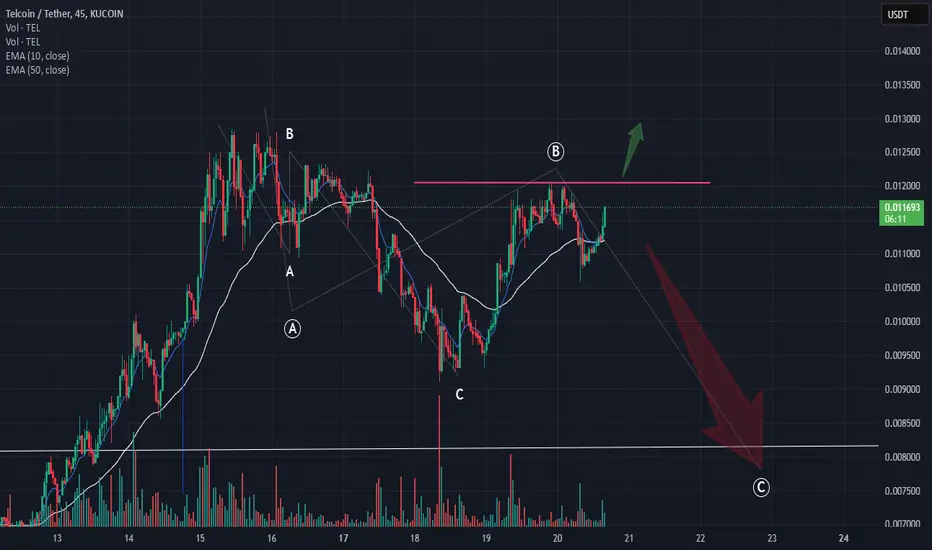
update on tel we will see if tel is going to brake down or will we rally i can see a potential for a sub- wave abc correction.
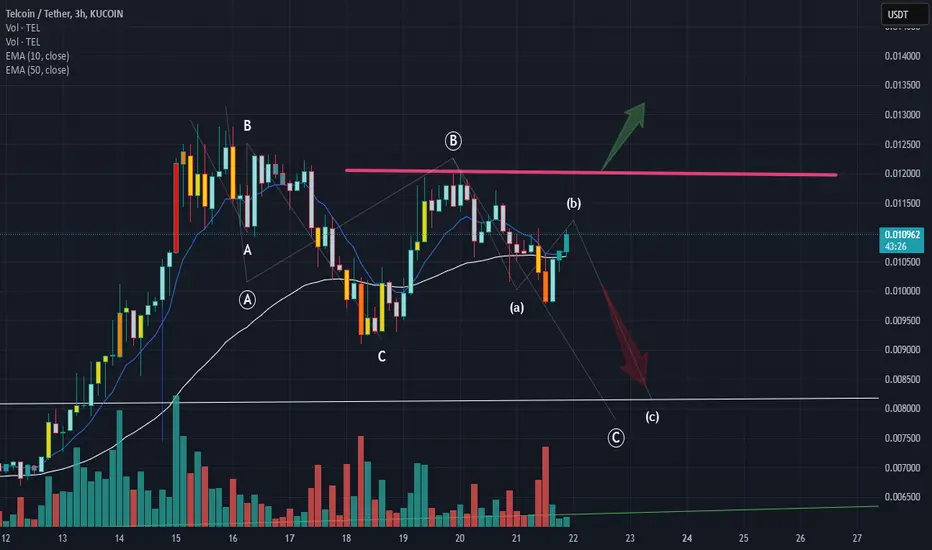
tel coin leading the bull run?if i see a clear break thru the support line of primary C-Wave this will be invalidated and would be long,however if we fail to break thru support i can see a lower low to the bottom of the primary C-Wave.
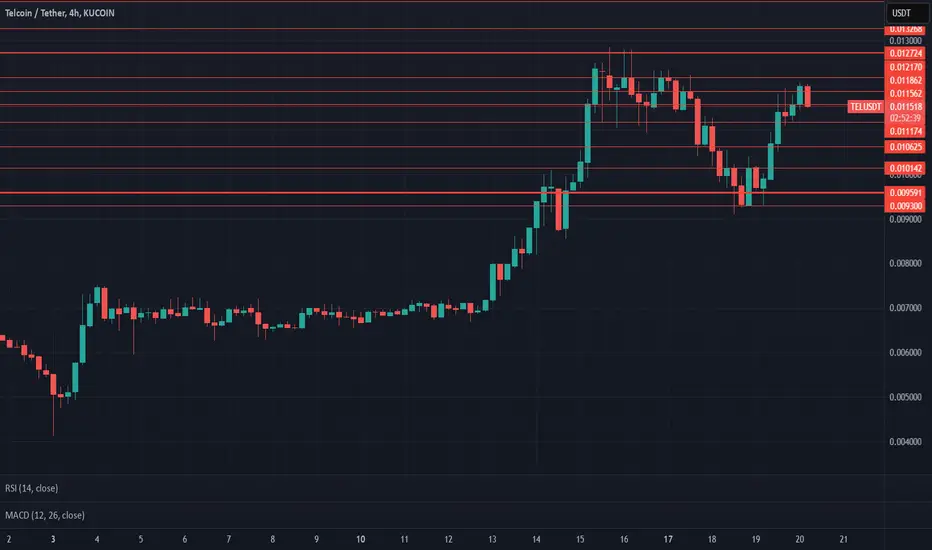
$TEL updateNYSE:TEL $0.012170-$0.012724 resistance range holding strong, Bullish engulfing on previous daily close, but current daily lacking volume, Currently heading towards $0.011174 support test, must avoid bearish engulfing on current 4h close, $0.010625 key support area, next key resistance at $0.014472, taking $0.012724 support will help test $0.013874. Watch given S/R
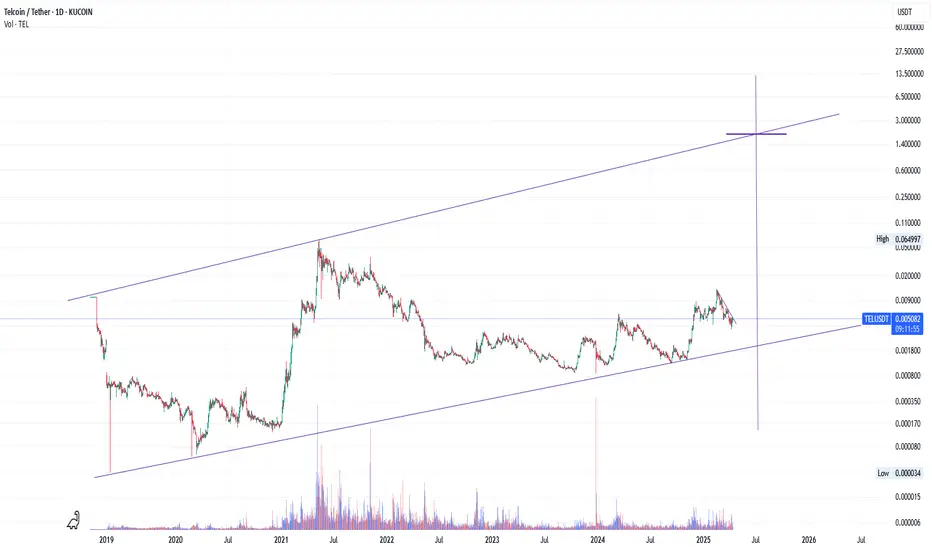
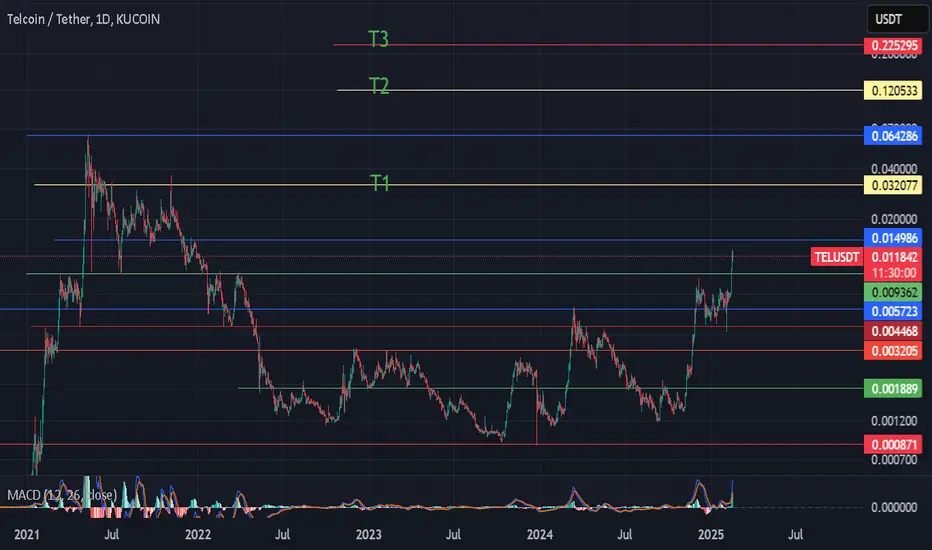
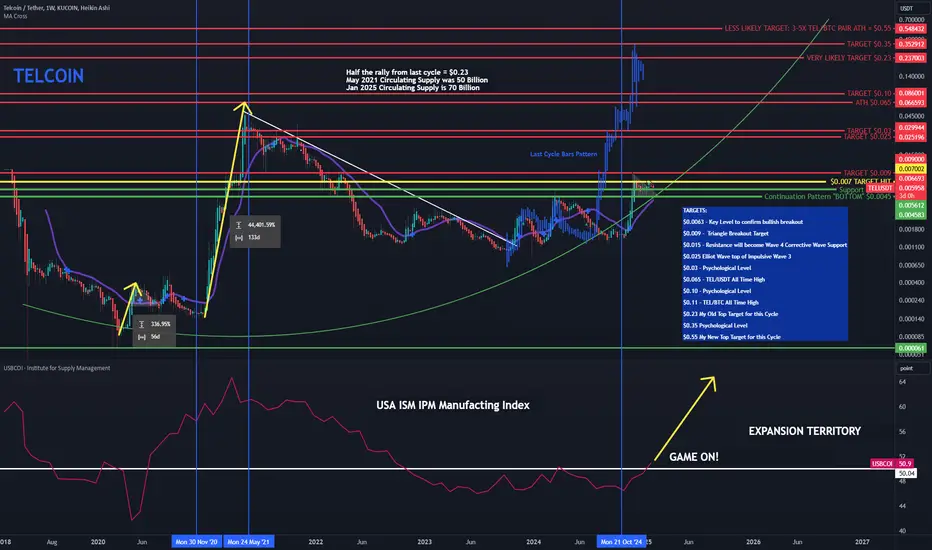
TEL targets for 2025this how i see it
if we pass T1 with strong volum we will smash T2&T3 very fast,
if not T1 will be the high for this year.
last cycle major number of crypto didnt ssurpass thier ATH, we will see what happen this cycle.
NFA.
Telcoin broke out of a two-month long range - very bullish- one of the extremely, extremely few altcoins that actually trades constructively
- perfect retest of range high
Trading opportunity for TELUSDTBased on technical factors there is a Buy position in :
📊 TELUSDT
🔵 Buy Now
🪫Stop loss 0.006500
🔋Target 0.008580
📏 R/R 2
💸RISK : 1%
We hope it is profitable for you ❤️
Please support our activity with your likes👍 and comments📝

breaking the key resistance at $0.007761 suggest,bullish trend Telcoin is currently ranked #209, with a market cap of approximately $658.96 million.
Price today is gaining steam, breaking the key resistance at $0.007761 suggest a bullish trend, with the 50-day moving average rising and positioned below the current price, indicating potential support for future price movements.
Analysts have identified key resistance levels at $0.007761 and $0.013669. If TEL surpasses these levels, it could signal further upward momentum.
Conversely, support levels are noted at $0.00610 and $0.00472. A decline below these points may indicate potential downward movement.
Overall, Telcoin's recent performance indicates a optimistic outlook, don’t sleep on $telcoin
Let’s see how it holds 🍀✨
Telcoin has very bright future - see targetsTelcoin just released V4 of their mobile app. Launched a new partnership with Dubai gaming company. Got historic approval to become the first digital asset bank in the USA.
Telcoin is going to $0.23, $0.35 and likely $0.55
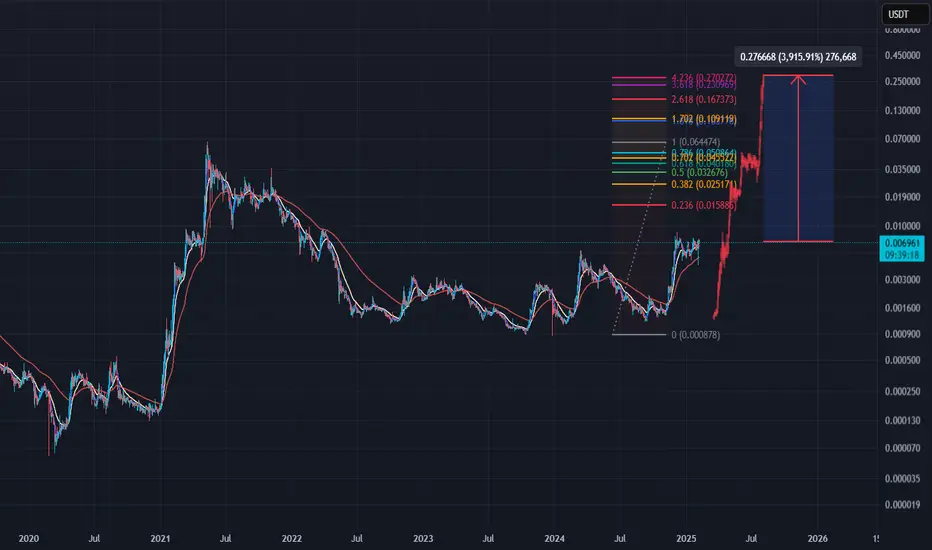
Telcoin explosive fractal I've always had Tel on the back burner but with regulation, bank approval and reviewing this fractal and fib levels, Tel has just jumped to the top of the list along with XRP. #LFG
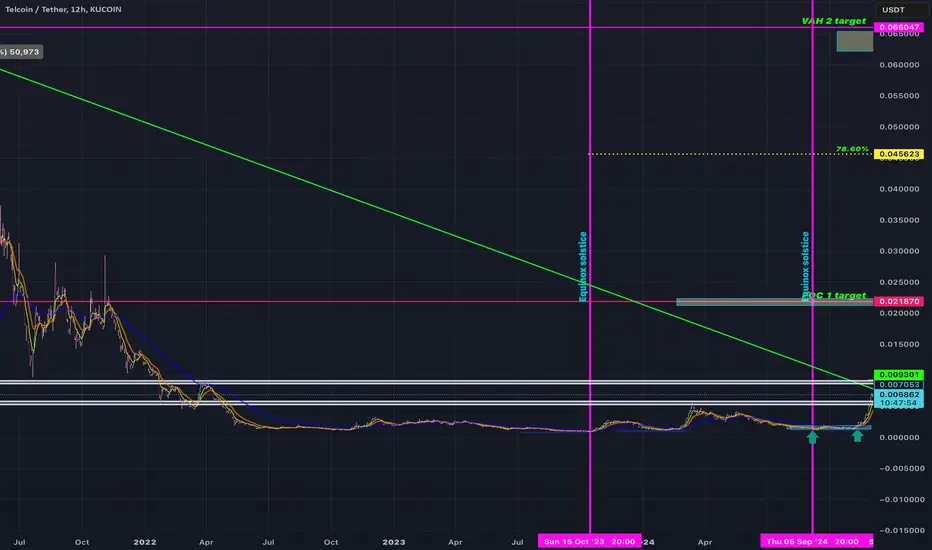
price points, patterns, and trends for Telcoin (TEL/USDT).The key price points, patterns, and trends for Telcoin (TEL/USDT).
Based on the image, here’s an overview of what stands out:
Key Observations:
1. Major Resistance Zone:
The chart shows a significant resistance area around . $0.0093.
2. Historical Price Peak:
Telcoin previously experienced a peak near $0.05, which is a major retracement level to watch for a long-term target.
3. Fibonacci Retracement Levels:
- The 78.6% retracement level appears to be near $0.0456, indicating a likely profit-taking or resistance zone for a bull run.
- Mid-level targets seem to align with prior consolidation zones.
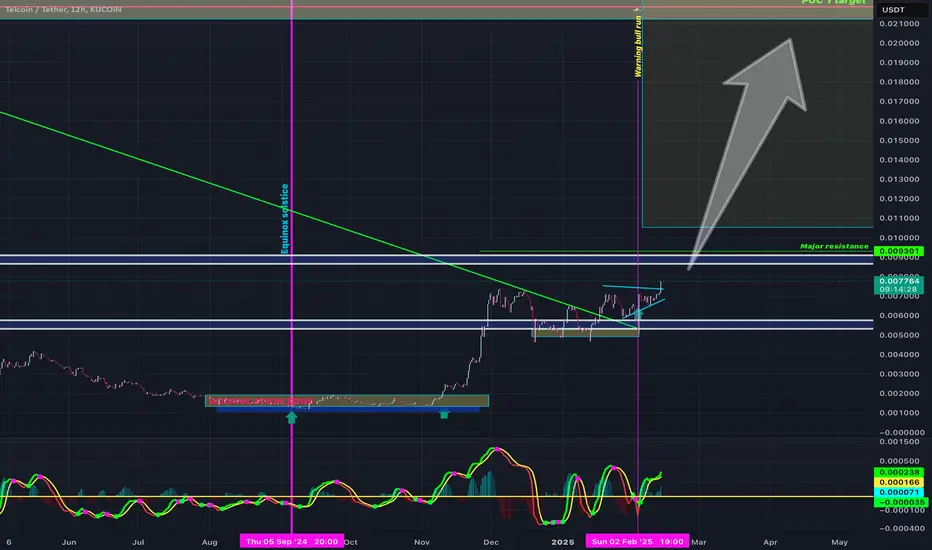
4. Market Cycles (Equinox/Time Points):
I’ve marked key dates on the chart, such as the spring equinox and potential mid-year bullish rally. These align with seasonal shifts in trading patterns.
---
Prediction for Telcoin Price Targets for the 2025 Bull Market:
1. Short-Term Target:
- $0.0210 to $0.022
- This level aligns with mid-range resistance and appears achievable early in a market rally.
2. Mid-Term Target:
- $0.0456 (Fibonacci 78.6%)
- Historically, altcoins like Telcoin often aim for this retracement level in strong bull markets.
3. Long-Term Target:
- $0.066 to $0.070 (VAH 2 target from chart)
- If the bull run gains significant traction, Telcoin could approach this upper resistance area.
I
---
Trading Strategy:
1. Accumulation Zone:
- Current prices around $0.0068 offer a strong entry opportunity before major resistance levels are retested.
2. Watch for Volume:
- Look for a spike in volume and price action breaking past **$0.0093** as confirmation of the next leg up.
3. Take Profits in Stages:
- Partial take-profits around the short- and mid-term targets can secure gains without missing further upside.
Keep going #TELFAM Xxx