How to Trade Double Tops & Bottoms in TradingViewLearn how to identify, validate, and trade double top and double bottom reversal patterns using TradingView's charting tools in this comprehensive tutorial from Optimus Futures. Understanding these classic chart formations can help you spot potential trend reversals and capitalize on contrarian trading opportunities in the futures markets.
What You'll Learn:
• Understanding contrarian vs. continuation trading strategies and when to use each approach
• The psychology behind buying low and selling high through reversal pattern trading
• How to identify double top and double bottom formations on any timeframe
• Key characteristics of valid double tops and bottoms, including volume confirmation
• Using TradingView's XABCD pattern tool to validate potential double top/bottom setups
• Real-world example analysis using crude oil futures charts
• Risk management techniques for trading reversal patterns
• How to calculate appropriate entry points, stop losses, and profit targets
• Setting up 1:1 risk-reward ratios for mathematical trading edge
• Understanding win rate requirements for profitable pattern trading
• How double bottom patterns work as the inverse of double top formations
This tutorial may benefit futures traders, swing traders, and technical analysts interested in contrarian trading strategies and reversal pattern recognition. The concepts covered could help you identify potential turning points in market trends and develop systematic approaches to trading these classic chart formations.
Visit Optimus Futures to learn more about trading futures with TradingView: optimusfutures.com/Platforms/TradingView.php
Disclaimer:
There is a substantial risk of loss in futures trading. Past performance is not indicative of future results. Please trade only with risk capital. We are not responsible for any third-party links, comments, or content shared on TradingView. Any opinions, links, or messages posted by users on TradingView do not represent our views or recommendations. Please exercise your own judgment and due diligence when engaging with any external content or user commentary.
This video represents the opinion of Optimus Futures and is intended for educational purposes only. Chart interpretations are presented solely to illustrate objective technical concepts and should not be viewed as predictive of future market behavior. In our opinion, charts are analytical tools—not forecasting instruments. Market conditions are constantly evolving, and all trading decisions should be made independently, with careful consideration of individual risk tolerance and financial objectives.
GOU2025 trade ideas

July 4 GOLD FIREWORKS!!!Gold bout to POP!!!! and it could be seriously huge! Im just patiently waiting for a area of entry. I have never traded a July 4th Holiday with this much clarity on what I see so this could get interesting.

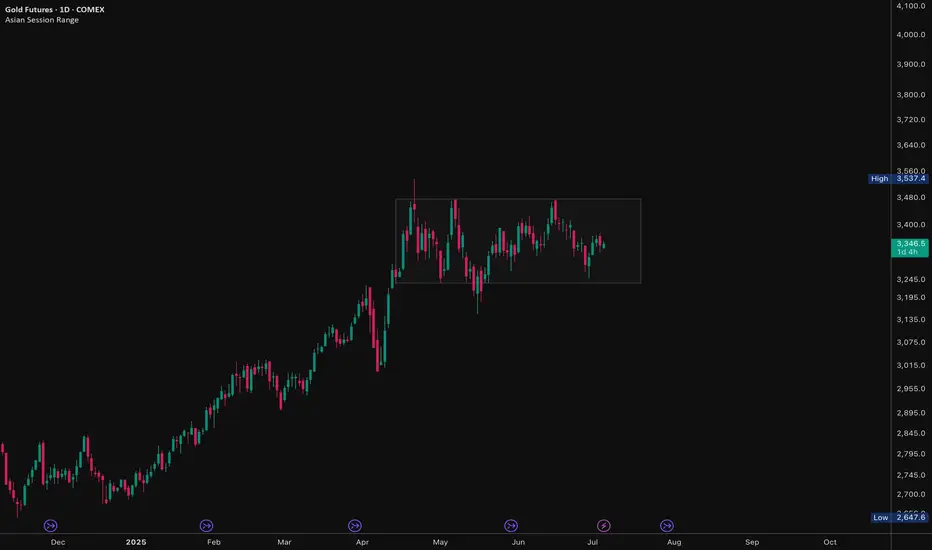
Gold Futures (GC1!) – Accumulation Brewing? Major Move IncomingGold has been stuck in a tight range since April, and to me, this looks like a textbook accumulation zone forming on the daily chart.
Price is coiling within a defined box, showing signs of both strength and weakness — classic behavior before a manipulative move (fake breakout) followed by distribution (true direction). This is where many traders get trapped, chasing the first breakout — only to get caught before the actual move begins.
I’m not committed to a direction yet, but here’s my roadmap:
🧠 First breakout = likely trap (manipulation)
🧭 Wait for confirmation of rejection/failure, then prepare for the real move out of the range
This kind of price behavior often precedes explosive volatility, so I’m watching closely for:
False breakouts above or below the box
Volume spikes or traps
Shift in market structure on lower timeframes
📍 No trade for now, but I’ll be reacting — not predicting.
What’s your bias? Do you think the breakout will hold or fake out?
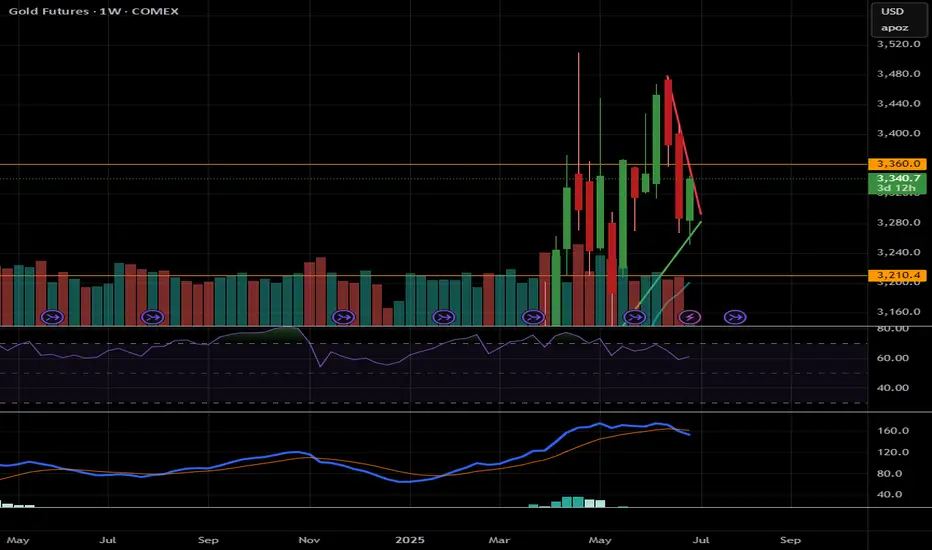
Gold, GC!, Sideway to the Downside (Long Term)06/30/2025, 10:30 PM PT
GC! is currently at its max around 3,500.
On the Weekly MACD, the crossover between MACD lind signal line already happened. There is also a bearish divergence on weekly chart.
On the Daily chart, RSI just crosses below 50 on RSI, and MACD shows weakness on the bull (it still not in the bear's territory just yet).
Reversasl to bear side may happen if price stays below 3,200
Bullish will continues if price break out of all time high
Current range for big timeframe from 3,200 - 3,500
Plan for swing trade:
Bullish Case (short term): break trendline. If hold above 3,360, price could go up to 3,400 -> 3,450
Bearish Case (short term): If price rejects and stays below 3,360, price could go down 3,310 -> 3,280
***Disclaimer: This analysis and trade plan are for educational and informational purposes only and should not be considered as financial or investment advice.
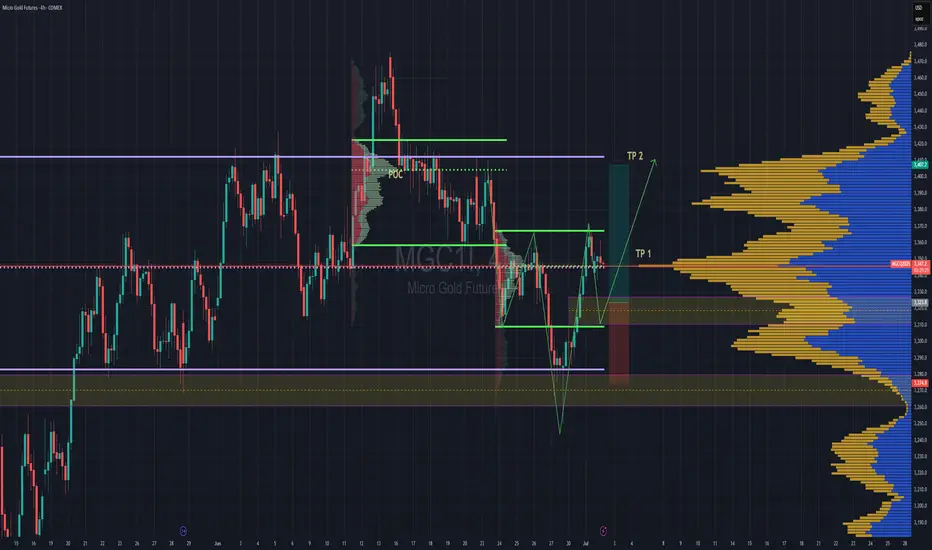
Possible Heads & Shoulders FormingWhen you see the inverse Heads n Shoulders forming, its hard to unsee it. I love this because it's lining up perfectly with the VAL of the intra day range and LVN ..This long trade is in line with my last week and current week forecast. We already hit TP1, TP2 is looking very likely after the pullback is done.
We are currently sitting at the POC, so expect some condolidation. Especially since we have ADP Non-Farm 2morow & Thurs. The news is the only thing that can throw a wrench into this setup.
Be sure to check out my last tradingview post and also checkout the weekly recap and weekly forecast videos i just posted on our youtube channel breaking down the in-depth analysis of this trade so you can understand my thought process on how it use Trend & Volume to execute this trade. Link is in my bio.
DEFINITIIONS
POC - Point of Control
VAL - Value Area Low
LVN - Low Volume Node
Study up on those.
CHEERS
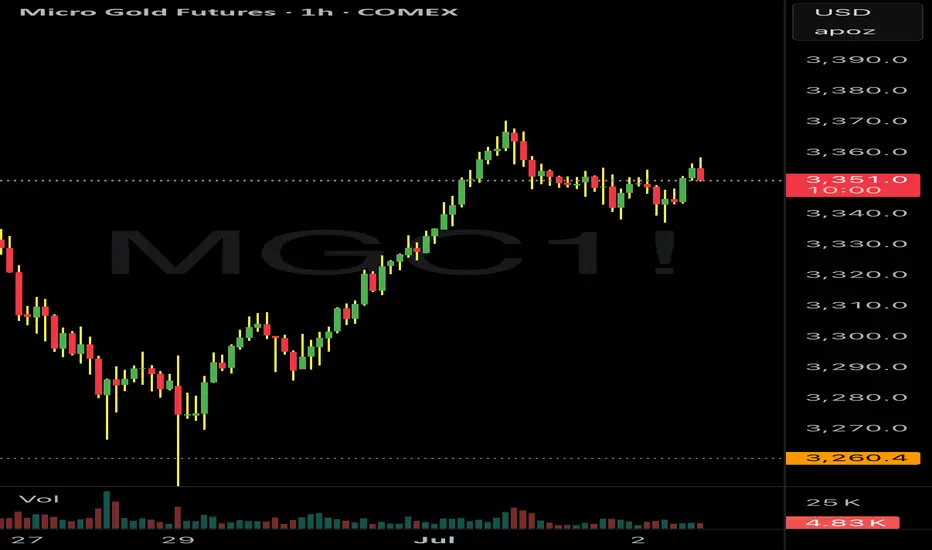
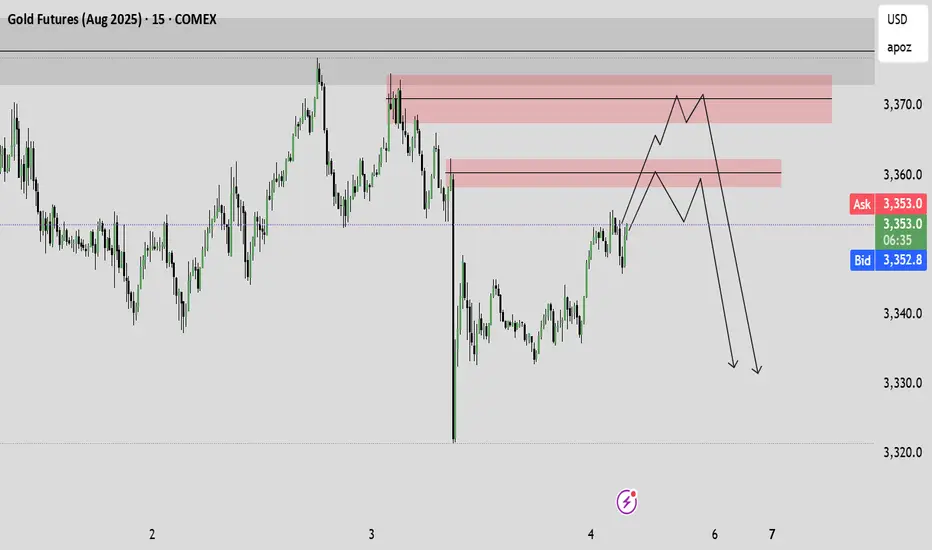
Gold back to $3300 - Week of July 4thPretty clear cut and dry, we have a significant mark down followed by a pump overnight.
Today and into tomorrow I’m looking for a drop back to the $3300 levels.
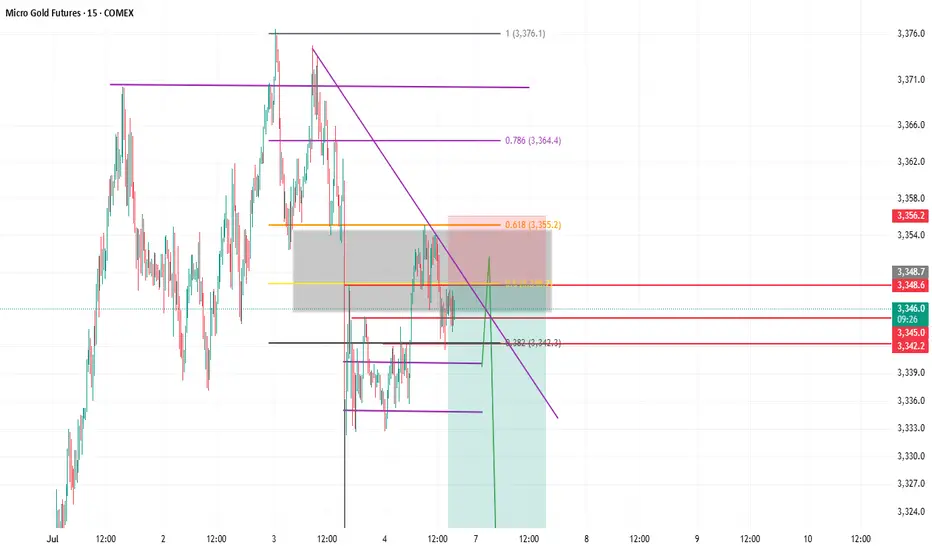
$GC / $MGC /Gold - Elliot Wave Analysis - Weekend Update - 7/6Hello fellow gamblers,
As we prepare for a new trading week, I revisited my EW count and was able to come up with 2 scenarios to present to you today.
- For our bullish scenario, I am looking for a break above 3418 and my next target will be at the 3574 - 3525 range.
- For our bearish scenario, I am looking for a break below 3283 and my next target will be at the 3086 - 2846 range.
- Price went through a consolidation as we closed last week's candle, and we are now at POC.
- Levels to Watch: 3418, 3363, 3283

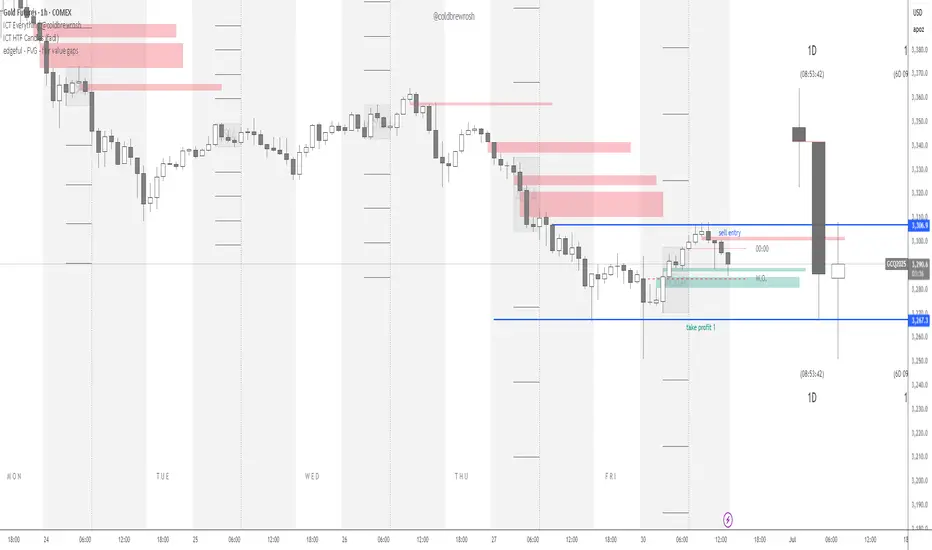
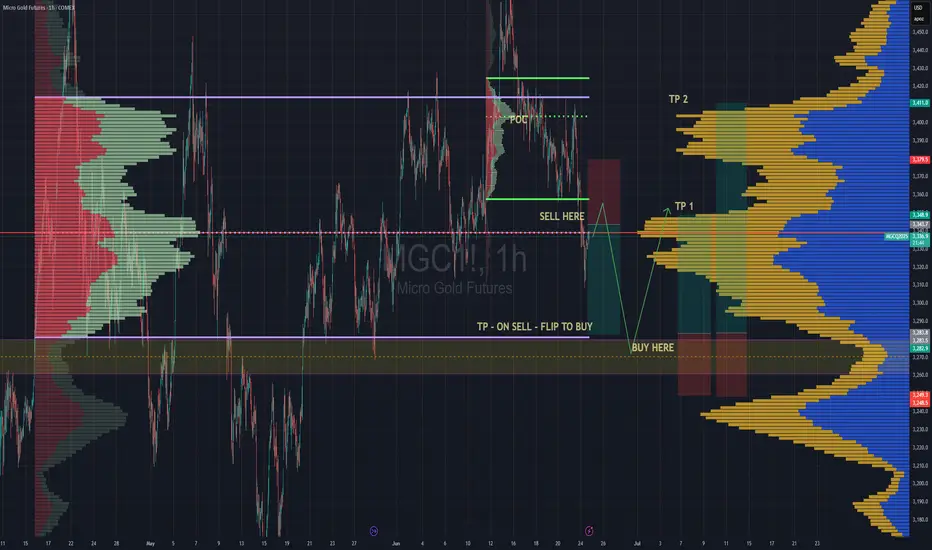
Long & Short Entry Forecast For GoldCooling war tensions seem to be cooling the Gold bullish rally as well.
But we're still in the same range since April 15th and will likely stay in the range until further notice *or the next tweet*
The Sell entry is great now cos we're near the top of the high volume node, so even if we consolidate around that POC this sell entry will still be putting us closest to the top of the node.
Hold your sell and TP at the VAL . We have a very deep low volume area there and its being a point of support since April. So we can place bets with small risk on hoping it holds cos if it doesn't, it wont be pretty. That is still the best place to buy regardless. So manage your risk accordingly
TP 1 for the Buy trade is at the POC , which also happens to be the top of the huge volume node. Totally make sense to take a decent chunk of profit of your position there, then move you stop loss into profit and grab some pop corn. Depending on the news , the best case scenario of for the uptrend is to continue all the way up to TP2 which is at the VAH
Secure the bag :)
Enjoy
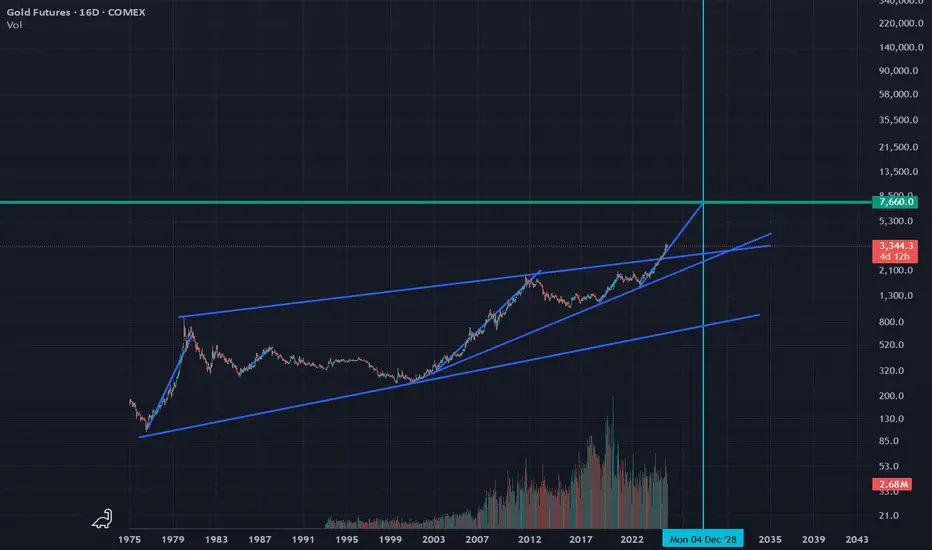
Gold to double in value over the next 3 years!Keeping in line with the massive dollar dump that is about to occur, it is gold that will be the biggest beneficiary.
If it keeps its current rate of advance, it will double in value before the end of '28!
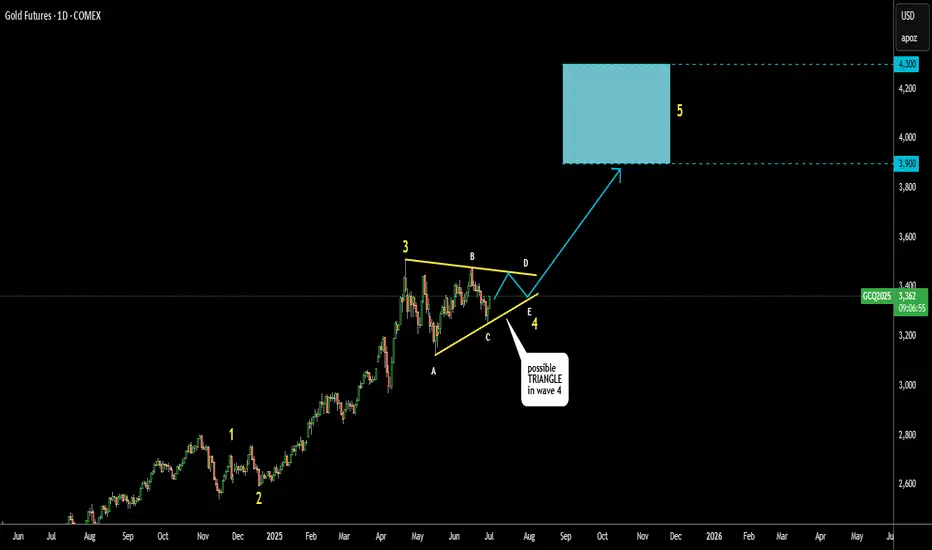
Gold Update: Possible Triangular Consolidation Before New RallyIt looks like corrective wave 4 is in the making within a large Triangle
3 waves A, B and C already emerged in 3-waves structure
which confirms triangle
Wave D should stay under the top of wave B
Wave E could either touch or break down the support line
It should keep above the valley of wave C
Target area changed higher as this consolidation tends to narrowing within a
contracting triangle.
Lowest target now $3,900
Optimistic target is at $4,300
Breakdown below $3,123 would invalidate the pattern
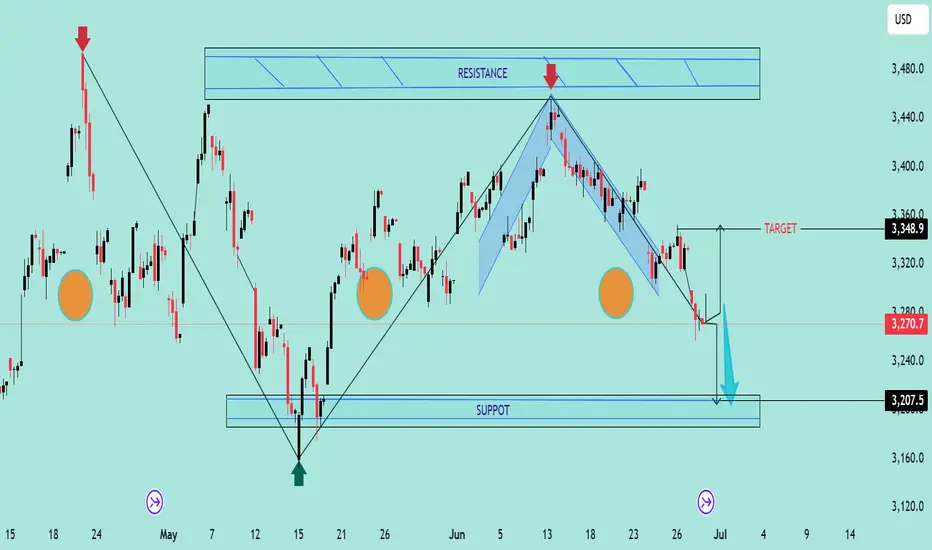
Double Top Breakdown at Resistance ZoneThe chart reveals a classic Double Top pattern formation near the 3,360–3,480 resistance zone, followed by a clear bearish rejection (highlighted with red arrows). This confirms the presence of strong supply pressure in that region.
🔍 Key Technical Highlights:
🔺 Double Top Pattern
The price formed two swing highs near the resistance zone, failing to break above.
After the second peak, the price started declining, confirming the reversal pattern.
📉 Bearish Channel
The recent downtrend is contained within a descending channel, with consistent lower highs and lower lows.
Price broke below the neckline of the double top pattern around 3,270.
🎯 Target Projection
Based on the height of the double top pattern, the projected downside target is near 3,207.5, aligning perfectly with the support zone marked below.
🟠 Historical Support Areas
The large orange circles indicate key reaction points, confirming that the 3,207–3,220 area has acted as support in the past.
📊 Outlook:
If the current bearish momentum continues, price is likely to head towards the support target zone at 3,207.5. Any pullback toward 3,320–3,350 could provide a shorting opportunity with stops above the recent highs.
🔧 Bias: Bearish
📍 Resistance: 3,360–3,480
📍 Support: 3,207–3,220
📍 Target: 3,207.5
Will The new Week kick off more bullish Pressure for GOLD?looking for more bullish activity this week but need to sit on my hands for now to see if they establish a Low for the week first. Once we see that and start to see HH's made then we can consider a entry to get in on the move. I cant rush it though. Have to be patient.

Gold Short Source, Trust me bro.
I mean well its in a downtrend and the price just keeps hitting lower, the 4h reacting very bearishly and the 1 day also didnt say much more than daily downtrend (recently).
So i think i have good confidence in this trade as i took the long pullback trade yesterday and the price showed that its respecting my analysis, so i would assume this will work out.
#XAUUSD Bearish on GOLDLooking for shorts from these zone on XAUUSD, Will be looking for confirmation before entering.
Gold is Pushing Bullish but is it really ready???This looks like a early move to move full on bullish. I feel like it might need to sweep the low from mid week before they really ready to go bullish. waiting for things to show a bit more clear during the Kill Zone.

Whats the Play for the week? Are we bullish?Looking for more bullish activity to continue. Just need to see price confirm if it is indeed ready to proceed. if we can find a solid entry we will rock with it. but not trying to force anything.

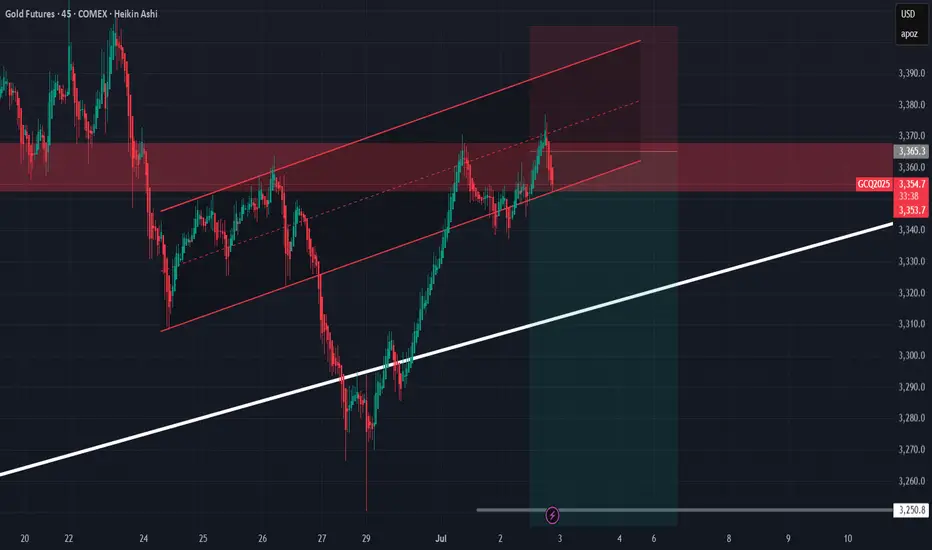
GOLD WATAFALL INCOMINGOkay so this is called a channle and golds not holding it to well so down we go also with war pressues relaxing its a real GOLDKiller anyws use SL be safe and
have fun! XD
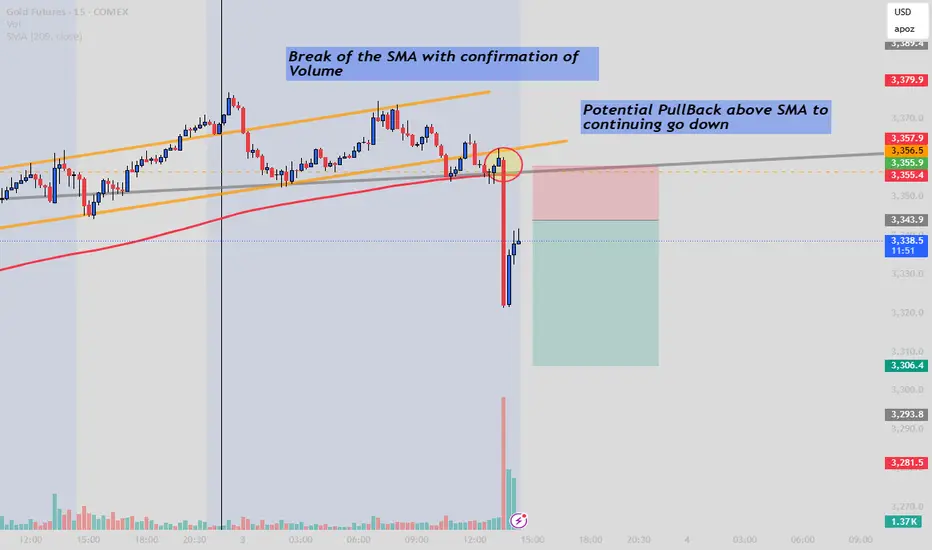
Gold Futures BOS does Bearish move might steps in?There is a breakout of the EMA with confirmation of rising Volume, which indicate a strong short position also with NFP shows strong job claims that's why we anticipated a fall in gold, especially for those who want to enter lastly you should consider waiting for a pullback to catch the second move. Follow GoldenZoneFX For more content and valuable insights.
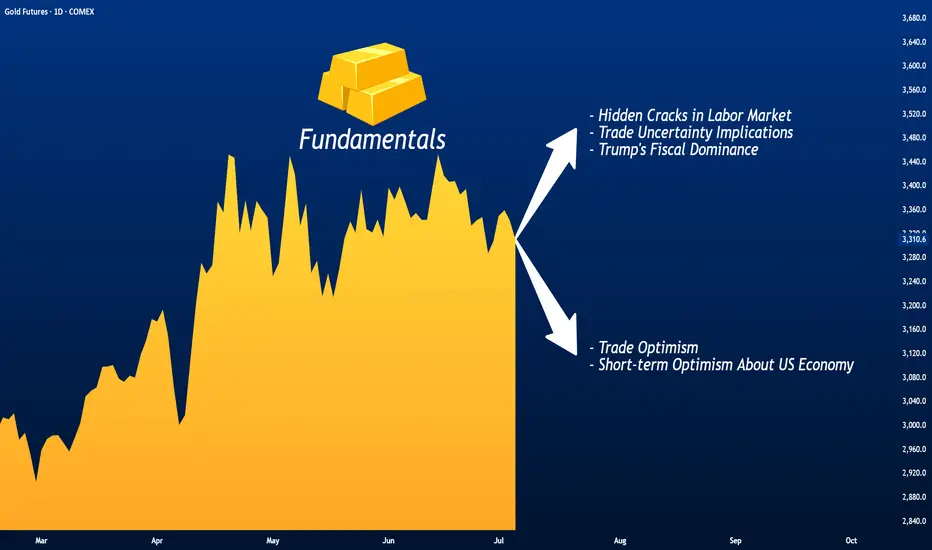
Gold Between Trade Optimism and Economic Concerns
Gold is declining for the second consecutive session, although it remains above the critical psychological level of $3,300 per ounce in early spot trading this morning.
Losses in the precious metal come amid renewed optimism over potential trade agreements that could de-escalate the global trade war, alongside upbeat sentiment regarding the strength of the U.S. economy following last Friday’s labor market data.
The 90-day suspension of tariffs imposed by the administration of President Donald Trump is set to expire on Wednesday, but it could be extended at least until August 1, according to statements from both the president and Treasury Secretary Scott Besant.
Both the United States and its allies and trade rivals appear eager to reach an agreement. China and the U.S. are moving to implement the framework of a previously reached trade deal by reviewing the export restrictions imposed on one another. Meanwhile, European officials stated last week that a draft agreement with the U.S. may be near, aiming to maintain base tariff rates at just 10%, according to The Wall Street Journal .
Markets appear largely unbothered by trade developments, given the flexible and seemingly open-ended deadlines and the lack of major surprises, according to analysts cited by Reuters . This easing of concern may lead gold to gradually lose the risk premium it had gained from fears of a global trade war.
Still, those concerns could return swiftly if negotiations fail and heavy tariffs are reinstated. The Washington Post reported that a potential U.S.-Vietnam trade deal may anger China and, in turn, reduce the likelihood of a broader deal between Beijing and Washington.
Additionally, the prolonged uncertainty itself may start to weigh on the U.S. economy, which could, over time, rekindle demand for gold as a safe-haven asset. The Editorial Board of The Journal noted cracks in the U.S. labor market that lie beneath the better-than-expected headline figures released Friday. The report revealed weak hiring in key private sectors, a decline in manufacturing employment, and a drop in labor force participation to its lowest level since 2022.
The Editorial Board called for dissipation of uncertainty around trade policy to encourage private sector hiring, as companies remain hesitant amid the current indecision in the White House. Another report from The Journal also warned that prolonged uncertainty could weaken the U.S. dollar, delay corporate investment and spending, and dampen business confidence.
On a related front, The Journal’s chief economics commentator Greg Ip criticized what he called “fiscal dominance” under Trump, where the Federal Reserve may be pressured to lower interest rates to ease the burden of the rising deficit caused by tax cuts. He warned this could undermine economic strength and increase inflation in the long run.
In my view, the early signs of a deteriorating U.S. fiscal position could become one of the key long-term drivers of sustained gold gains—even if markets remain complacent for now and equities continue climbing to record highs. This would not reflect an economic cycle, but rather a deeper shift in market fundamentals characterized by eroding confidence in the U.S. economy and its currency.
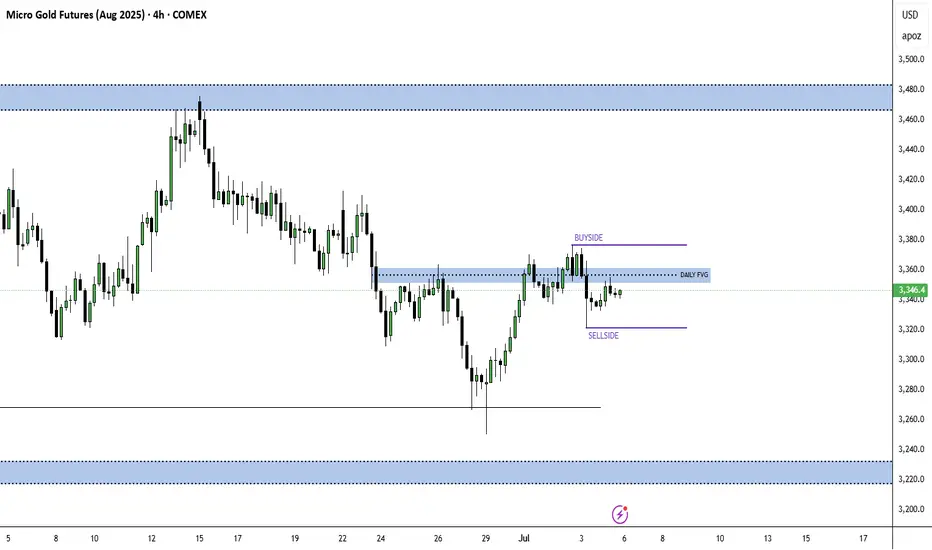
NEUTRAL ON Gold FOR NOWI dont see a clear direction for Gold just yet, I am on the sidelines, waiting for buy side or sell side to get ran first,
I am more bearish than bullish because Dxy seems to be cooling off from its down trend.
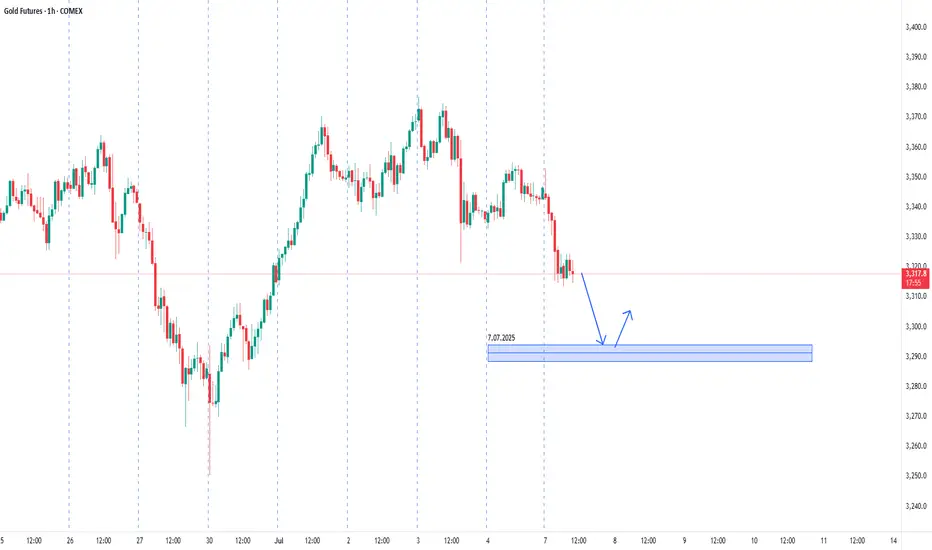
Gold. The plan for the next few days.The nearest resistance zones are where it's interesting to look for purchases. We are waiting for a reaction and looking for an entry point.
The post will be adjusted if there are any changes.
Don't forget to click on the Rocket! =)
Gold May Find Support From These Various FactorsGold May Find Support Amid Concerns Over U.S. Debt Sustainability, Economic Weakness, and Renewed Geopolitical Tensions
Gold prices are holding steady today, near $1,353 per ounce in spot trading, in what is expected to be a low-liquidity session due to the early closure of U.S. markets. This follows three consecutive days of gains.
The yellow metal’s subdued movement comes as markets await key labor market data that may offer further insight into the health of the U.S. economy, especially after the recent shock from ADP figures.
Gold continues to find support from several underlying factors that could sustain its upward trend this week. These include rising uncertainty around the long-term sustainability of U.S. public finances and the risk of renewed conflict in the Middle East.
Concerns over U.S. fiscal stability have intensified following the introduction of the “One Big Beautiful Bill Act,” which combines tax cuts with spending reductions. In an opinion article for The New York Times , former Treasury Secretaries Robert Rubin and Lawrence Summers warn of the bill’s potentially severe consequences, including persistently high interest rates, reduced business confidence, falling investment, and the risk of a financial shock that markets may struggle to absorb. This could also leave the economy more vulnerable to economic and geopolitical threats.
Such risks may erode investor confidence in U.S. government debt, potentially boosting gold’s appeal as a safe-haven asset even in an environment of elevated bond yields and prolonged high interest rates.
On the geopolitical front, the specter of renewed escalation in the Middle East looms, and this time, the consequences could be more severe. Amid conflicting reports and statements regarding the extent of the damage to Iran’s nuclear facilities, both sides appear to be preparing for the possibility of renewed hostilities.
Diplomatic efforts remain stalled, and hardline voices continue to call for a return to conflict. In an opinion piece for The New York Times, former National Security Advisor John Bolton described negotiations with Iran as ineffective and dangerous, calling instead for regime change and the use of force.
While previous rounds of conflict have not caused lasting damage to the global economy or energy supply chains, a new round may prove more disruptive. According to Reuters , Iran has reportedly loaded naval mines onto vessels, raising fears that it may attempt to close the Strait of Hormuz.
Such a move would cross a critical threshold and turning a contained conflict into one with global economic implications. The Strait of Hormuz handles over one-fifth of the world’s crude oil and liquefied natural gas exports.
However, Iran may avoid this step as long as its own oil exports continue flowing through the strait, as was the case during the last conflict in June.
On the trade front, there is growing optimism about the potential for new agreements that could ease tensions that have disrupted global supply chains and threatened U.S. and global economic growth. This optimism follows President Trump’s announcement of a trade deal with Vietnam.
There is also hope that progress can be made with China. Recent reciprocal steps, that involve the easing of restrictions on rare earth exports by China and some relaxation of U.S. technology export controls, suggest that the de-escalation agreed upon earlier in Switzerland could hold, potentially laying the groundwork for a broader trade agreement.
Samer Hasn
Short GC futures at 3,290.Strategy: Short GC futures at 3,290.
Entry: 3,290 (near current price, aligning with resistance).
Target: 3,250 (support level, 1.2% downside).
Stop: 3,310 (above resistance to limit risk).
Rationale: Bearish technicals (RSI divergence, declining open interest) and USD strength support a short-term pullback, with US Retail Sales as a potential catalyst.