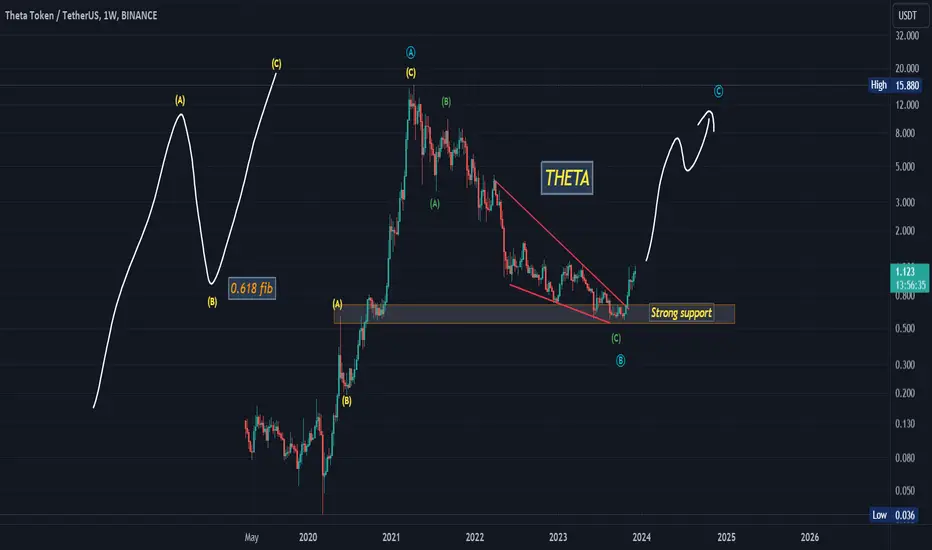
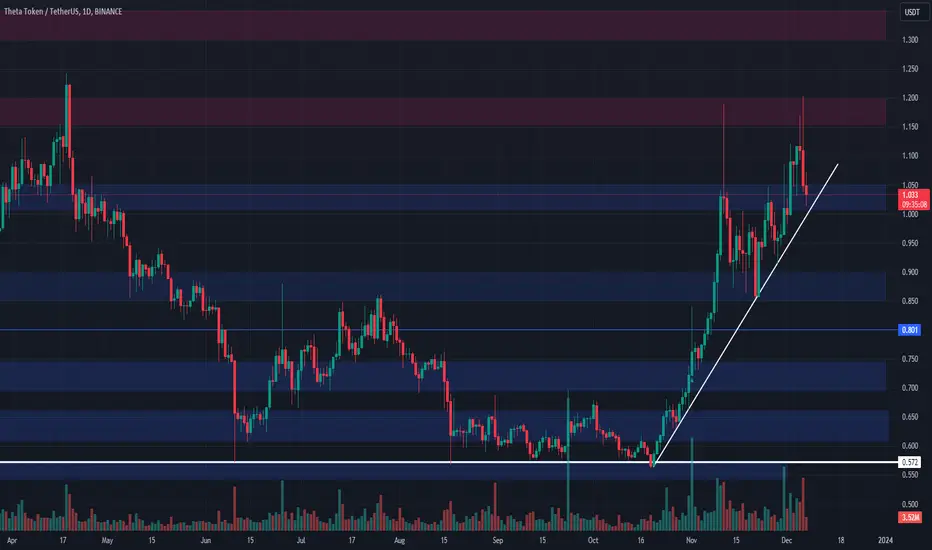
THETAUSDTFrom the clear data on the chart, we find that the price fell historically to the strongest support area and fell in three corrective bearish waves. We are supposed to see a strong rising wave coming, so we follow what will happen.
All data is shown on the chart
THETAUSDT.P trade ideas
🔄 Theta (THETA) Analysis: Oversold Conditions, Potential UpsideAn analysis of Theta (THETA) indicates oversold conditions, potential upside, and highlights key levels, providing insights for market participants.
Key Insights:
Current Price: Theta is observed to be trading at $1.1 and is considered oversold.
Potential Upside: The analysis suggests that the price could be on its way to test $1.15 - $1.20.
Key Resistance Levels: The $1.15 - $1.20 area is identified as a key resistance zone where the price faced rejection last week.
Further Upside Target: If the resistance is breached, THETA could aim for $1.35.
#Theta #CryptoAnalysis #OversoldConditions
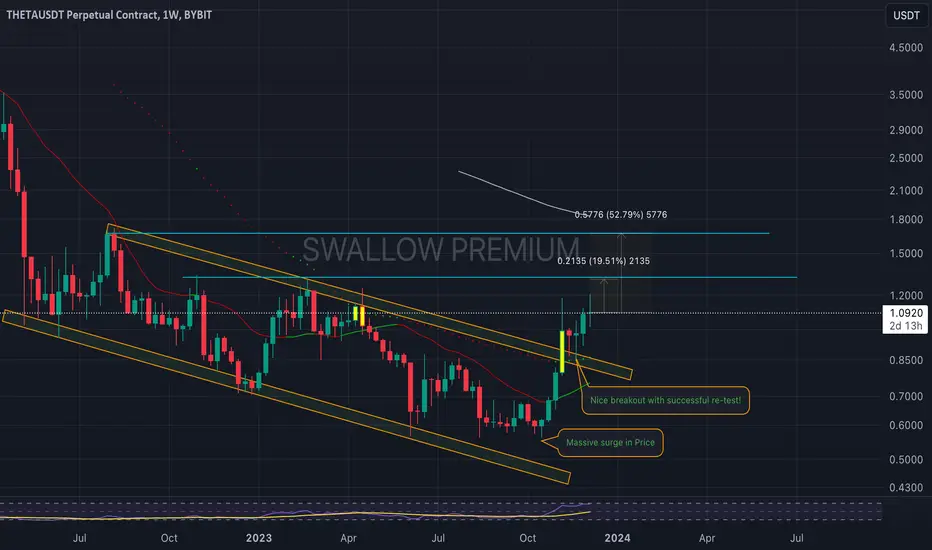
THETA/USDT: Breakout + Re-Test = Bullish Movement? With a confirmed breakout above the descending channel and a subsequent re-test of the breakout point, THETA's weekly chart is indicating a bullish shift. The price surge has established new support, laying the groundwork for an upward continuation. Looking ahead, we're targeting incremental resistance levels, the nearest being a 19.51% climb from our current position. The momentum is strong, and if buyers maintain control, we could challenge the next key resistance level at a 52.79% rise.
THETA Price Action Analysis: Key Levels and Potential Rally! 🚀#THETA:
After rejection at $1.20, retraced to $1.015 support. Critical support at $1.00 - $1.05. Potential rally to test $1.20 or $1.30 - $1.35 resistance if support holds.
#CryptoNews #THETAToken 🌐🚀
THETAUSDT - BULLISHTHETAUSDT.P is in bullish trend, also forming bullish divergence. after break the trend line, it must be hit the TP.
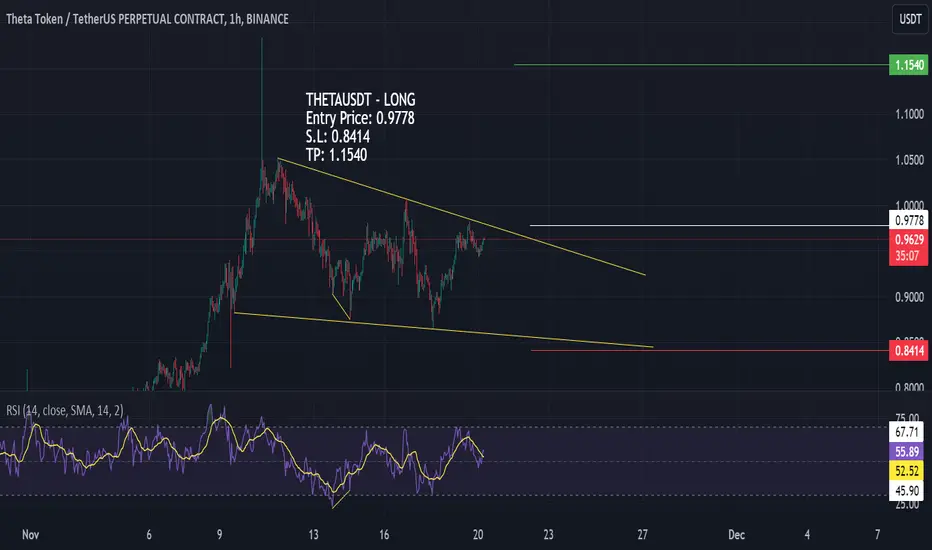
theta target 1.55$ Not a clean cup and handle but who cares at bull right? Riding it with 4x lev. maks 5x is recomended.
nfa
dyor

THETA/USDTMYX:THETA nice trade here you have two ways to long, you can wait for it to come down a bit and enter on the dip, or you can wait for the blue resistance line to breakout!
GL


BULLISHDO NOT FORGET USING A STOP LOSS
Warning:
This is just a suggestion and we do not guarantee profits. We advise you analyze the chart before opening any position.
I hope you are always profitable
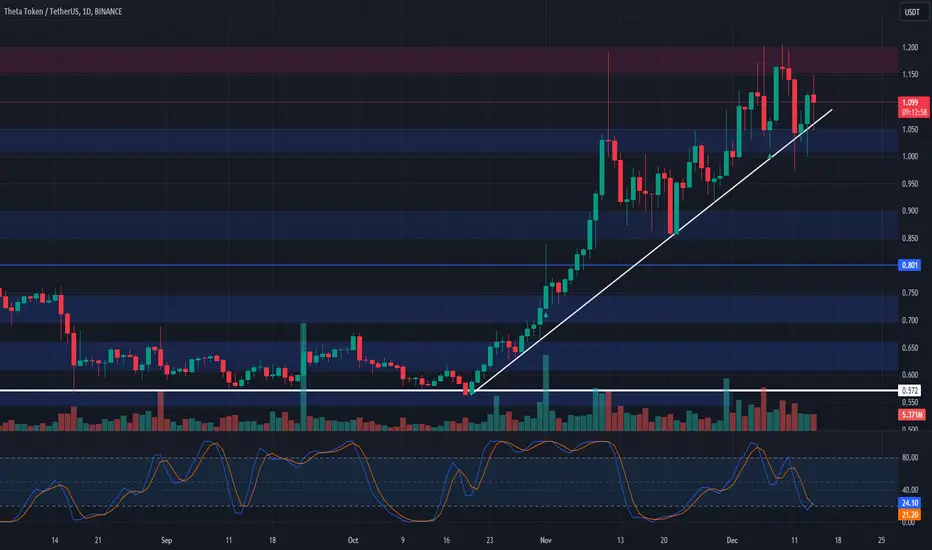
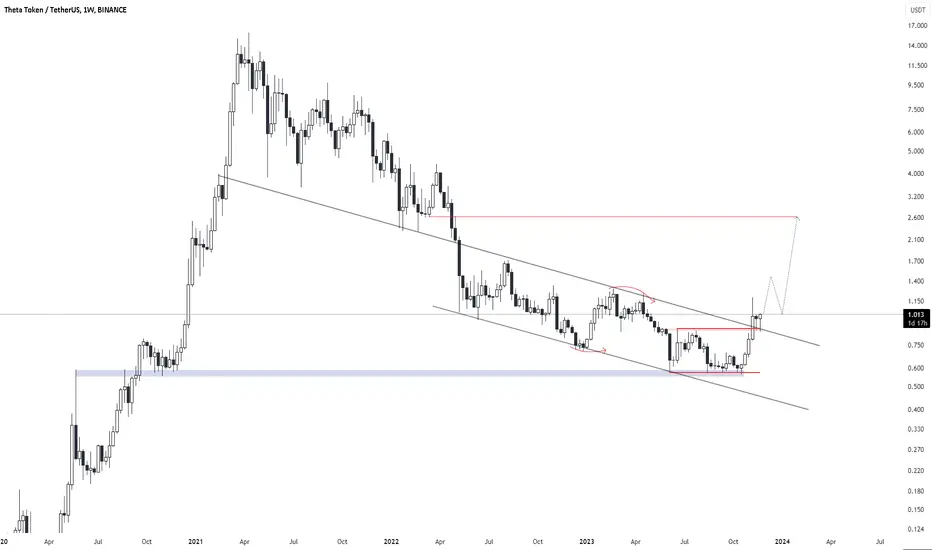
SasanSeifi 💁♂ theta / Price Consolidation in Weekly Time FrameHi everyone!
As you can see in the weekly time frame, after a downtrend, the price has been accompanied by positive fluctuations after ranging from the 0.56 price range. With the break of the downtrend line, it was able to grow to the 1.17 price range. Currently, it is trading in a range at the 1.023 price range.
We can consider a scenario in which the price continues to range and accumulate volume and then resumes positive fluctuations. If it consolidates above the 1.30 resistance range, we can see growth to the 1.70 liquidity range. In the case of growth, to better understand the continuation of the movement, we need to see how the price reacts to the target range.
The important support level in the weekly time frame is 0.56. Otherwise, if the price penetrates below the 0.56 LOW range and consolidates, the possibility of further correction can be considered.
🟢 Keep in mind, it's essential to perform your own analysis and take into account additional factors before making any trading choices. Best of luck! ✌️
❌ (DYOR)
Sure, if you have any more questions or need further clarification, feel free to ask. I'm here to help!
if you found my analysis helpful, I would appreciate it if you could show your support by liking and commenting. Thank you!🙌✌

$Theta - love this coin but looks like a goos point to shortStrong resistance ahead , plus whales shorting in big numbers

THETA/USDTThis currency has broken important areas and has risen in the weekly time.
I expect more growth for now

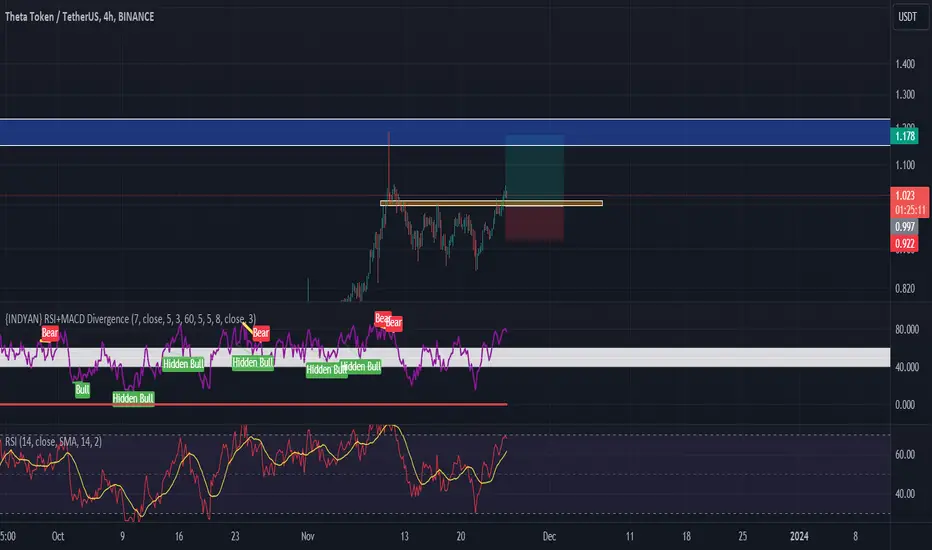
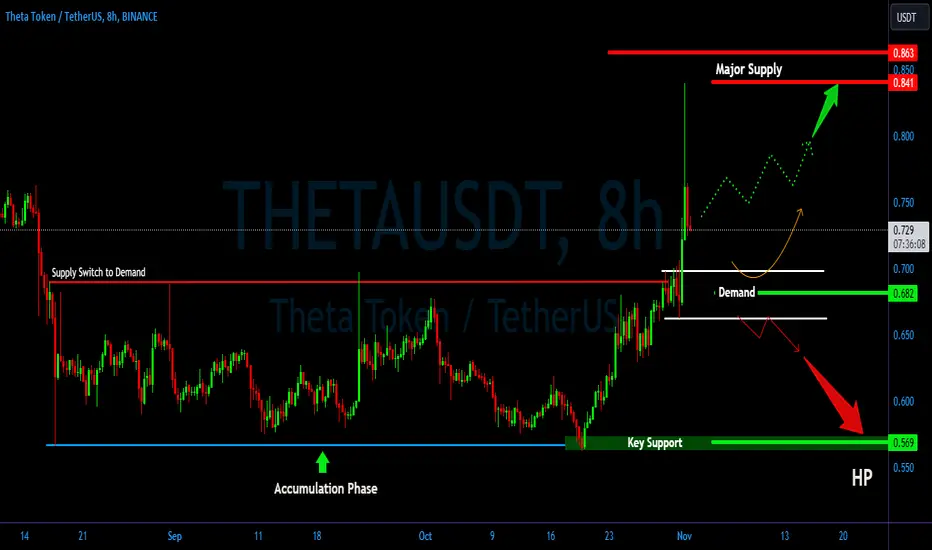
THETA/USDT Break Alert! it required bounce to continue movement💎 THETA has certainly captured the market's attention. At present, THETA has impressively surged past the supply zone, marked by a robust green candle accompanied by significant volume. However, upon encountering the major supply area, THETA faced a notable rejection.
💎 This suggests that THETA might be gearing up for a retest at the demand zone, which previously served as a supply area. There's a likelihood that THETA could either bounce from this point or swiftly resume its upward trajectory, Probability aiming for our designated major supply target.
💎 On the downside, if THETA struggles to uphold the demand zone and dips below, it could indicate a false breakout, pushing THETA back into its previous accumulation or consolidation phase. This would spell a bearish trend for THETA, with potential moves towards its primary support levels.
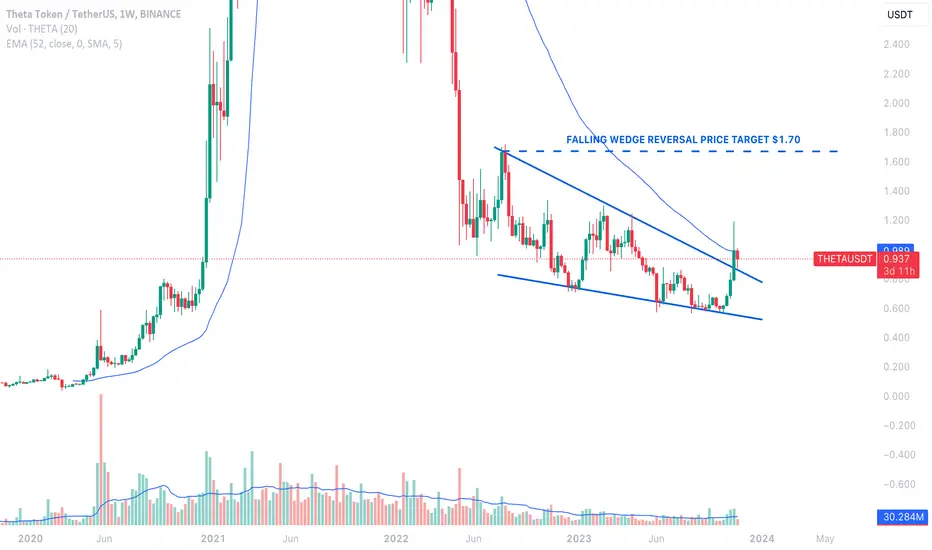
THETA broke Falling Wedge reversal patternBINANCE:THETAUSDT on Weekly chart has completed a Falling Wedge pattern that began forming up in August 2022. This pattern is usually viewed as a bullish signal, it suggests an upward trajectory with a potential price target of $1.70. The price has found resistance at the year-long EMA It's important to recognize, however, that while this pattern is a strong indicator of market sentiment and potential movement, reaching the price target is not guaranteed
Theta - Another ShortBearish Divergence on the 1Hr frame and lower timeframes too. Stochastic is also too high.

Theta ShortRejected from weekly resistance twice.
looking for a short on smaller timeframes.
on daily TF also the swing short can be taken. till 0.55$

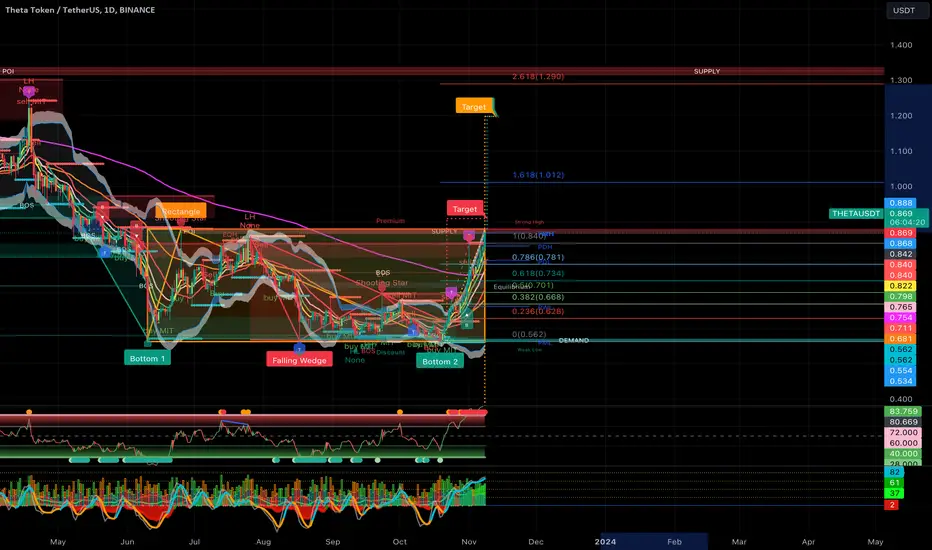
THETA - 1D - Heading towards $1,29THETA is showing some strength. If the price breaks through the red resistance area, the price can increase with 48% from current price. This could be in the coming days or weeks. Depending on how fast people are noticing this opportunity.
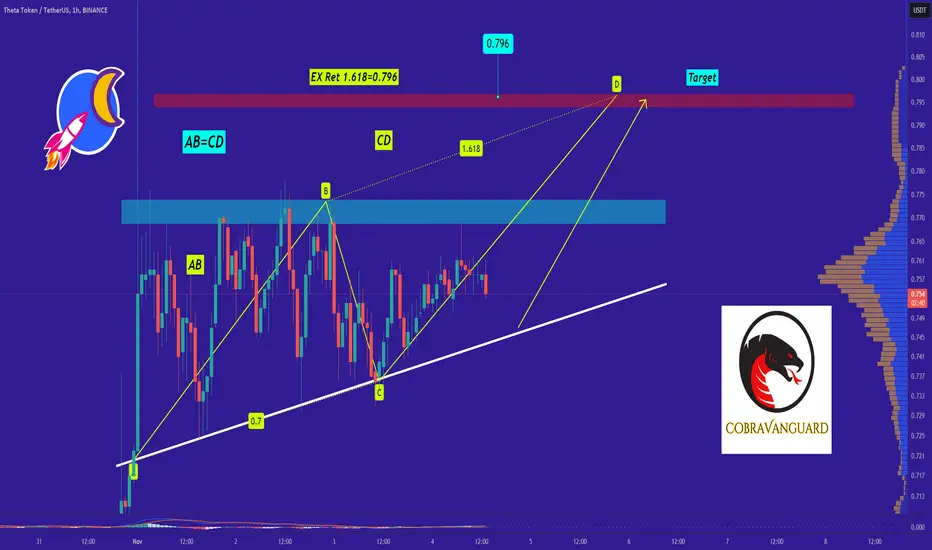
🚧THETA is Bullish now🚧 & many Traders don't see it 👀!!!THETAUSDT is in an ascending triangle which means the price is about to do a good bullish movement. The price can increase as much as the measured price movement ( AB=CD ) .The break out needed for increasing further has not happened but it should happen pretty soon.
I hope you make good money in these exceptionally good days🤌
_ _ _ _ _ _ _ _ _ _ _ _ _ _ _ _ _ _ _ _ _ _ _ _ _ _ _ _ _ _ _ _ _
✅Thank you, and for more ideas, hit ❤️Like❤️ and 🌟Follow🌟!
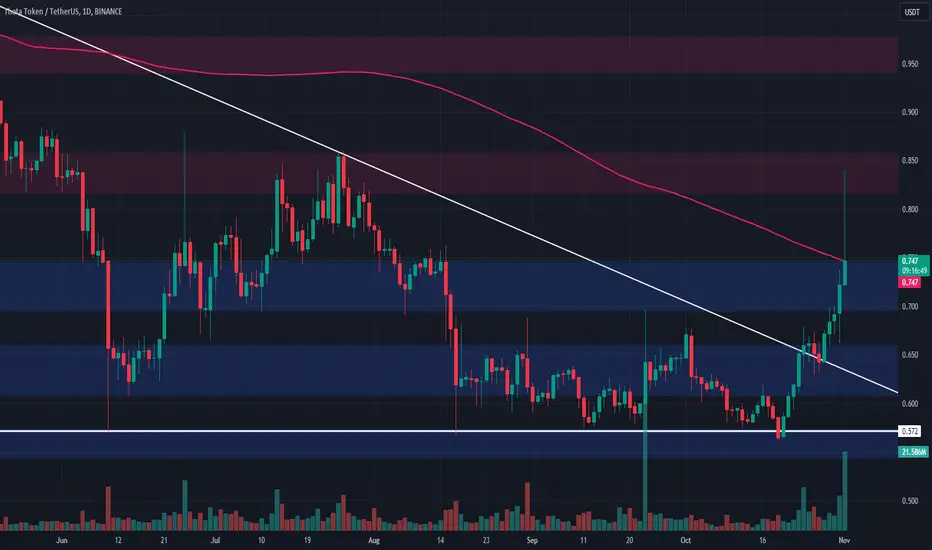
THETAUSDTExciting morning as #THETA breaks $0.75 resistance, surging 16% to $0.84 before encountering resistance at $0.825 - $0.86. Currently retraced to $0.74 at daily 200 MA. Potential for another upward move if support holds, aiming for $0.825 - $0.86 retest! 📈💫
#CryptoNews #Trading #BTC
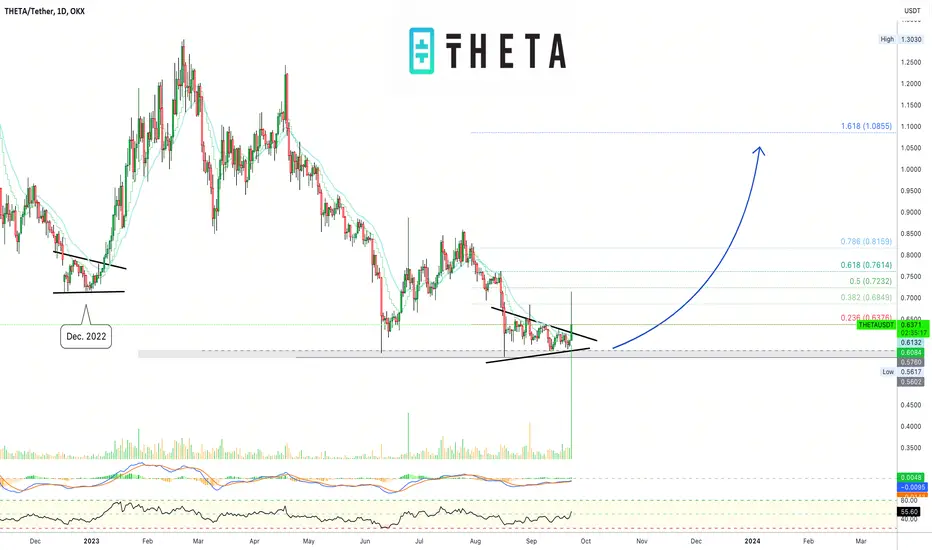
✴️ Theta Network Highest Volume Since May 2022Here we are looking at a different exchange.
We looked at Theta Fuel on GateIO and we witnessed the highest volume in more than a year.
Now we have Theta Network on OKX and we have the highest daily volume since May 2022.
To me this means that the bottom is in and a new and very, very strong bullish phase is about to develop.
In fact, we might be looking at a long-term bottom low, like the lowest level forever, like what happened back in March 2020 for example...
Regardless, this signal coupled with a strong RSI, strong daily candle, break above resistance in the form of moving averages, etc., indicates that the bulls are entering the game with force.
This is not surprising because while the sentiment has been low, other Altcoins have been growing strong.
Notice the same consolidation pattern in December 2022 after a major low... What follows is up!
Make sure to maximize profits.
Use this information in the best possible way you can.
You can do this!
Keep trying!
There is always a new and even better opportunity on the way!
The market is here to stay!
As long as we persist, we win in the end.
Thank you for reading.
Namaste.
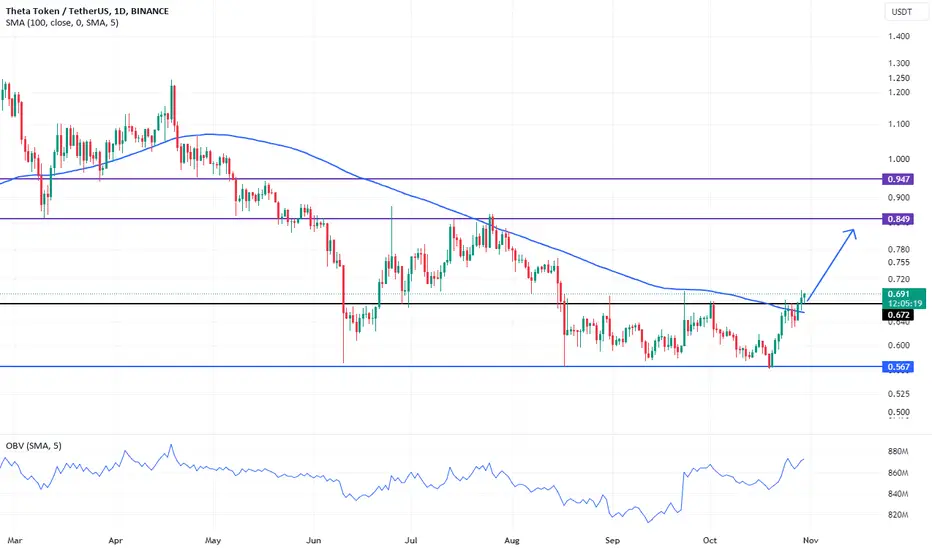
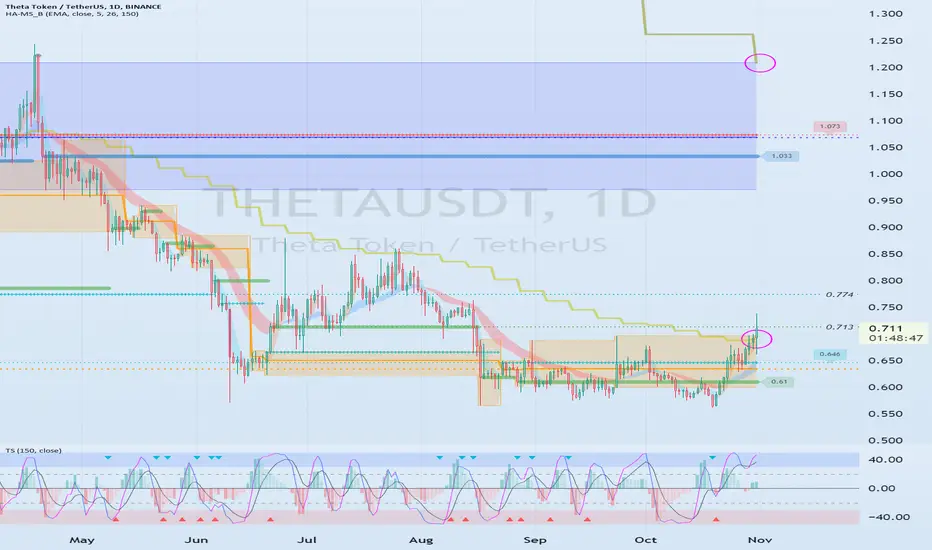
Important support and resistance areas : 0.713-0.774Hello?
Hello traders!
If you "Follow" us, you can always get new information quickly.
Please also click “Boost”.
Have a good day.
-------------------------------------
(THETAUSDT chart)
The key is whether the price can be maintained by rising above 0.929-1.341.
(1D chart)
To do so, it is important to be able to receive support and rise in the 0.713-0.774 range.
Since the M-Signal indicator on the 1W chart is passing around 0.697, it is necessary to check whether it can receive support around 0.697 and rise above 0.713.
If it falls below 0.635, there is a possibility of a new low, so caution is required.
--------------------------------------------------
- The big picture
The full-fledged upward trend is expected to begin when the price rises above 29K.
This is the section expected to be touched in the next bull market, 81K-95K.
-------------------------------------------------- -------------------------------------------
** All explanations are for reference only and do not guarantee profit or loss in investment.
** Trading volume is displayed as a candle body based on 10EMA.
How to display (in order from darkest to darkest)
More than 3 times the trading volume of 10EMA > 2.5 times > 2.0 times > 1.25 times > Trading volume below 10EMA
** Even if you know other people’s know-how, it takes a considerable amount of time to make it your own.
** This chart was created using my know-how.
---------------------------------
Theet Token is preparing to go up to new areasAfter the long assembly and the penetration of the resistance, Theet Taken is preparing to ascend