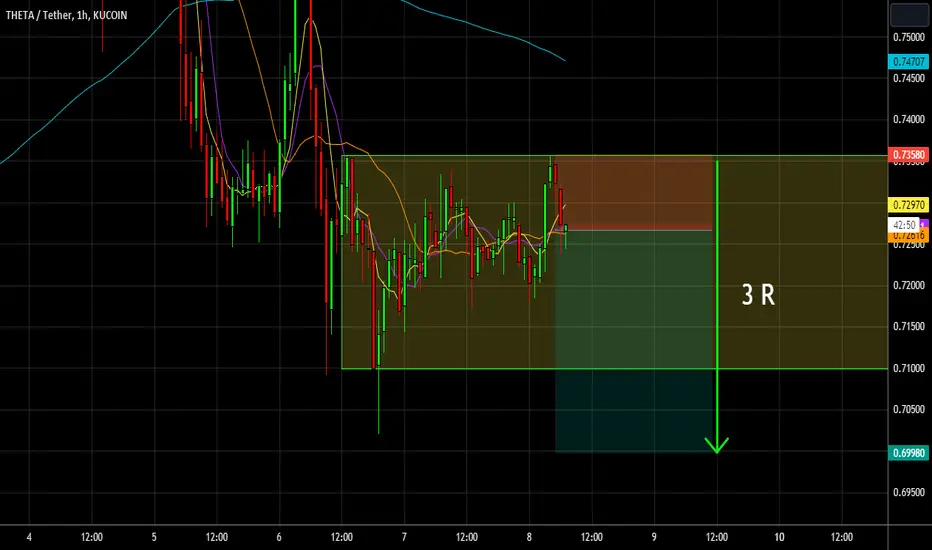
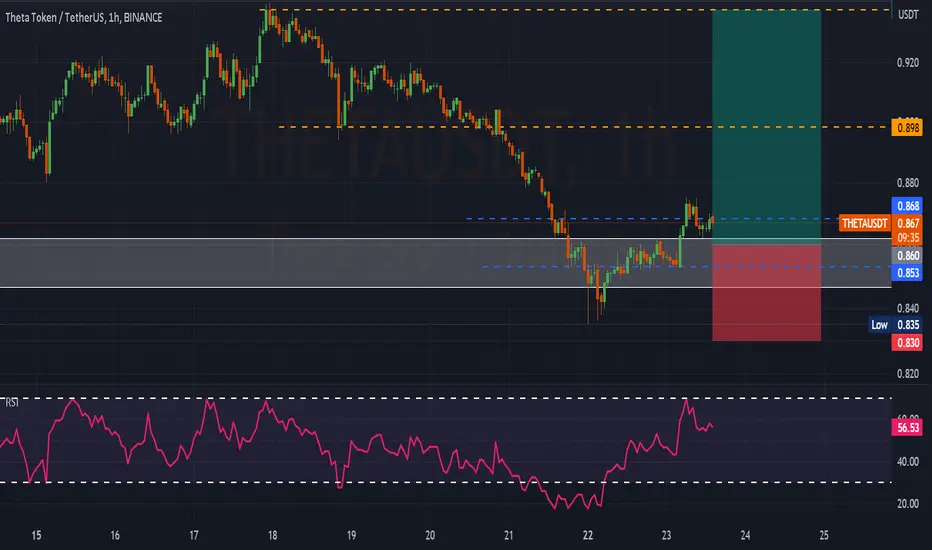
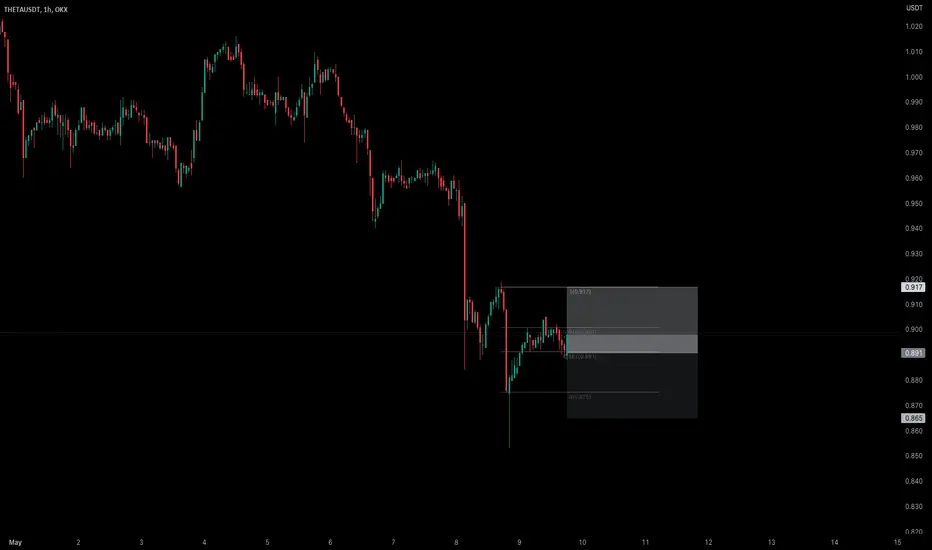
THETAUSDT triggers shortTHETA triggers short for a nice 3R setup and a breakdown out of the 1H consolidation.
THETAUSDT.P trade ideas
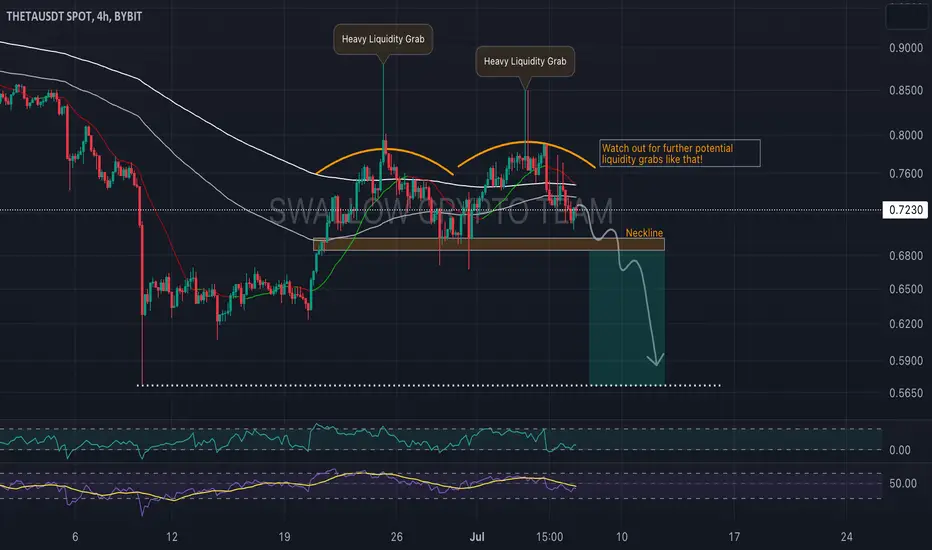
THETA/USDT "Double Top" Hey traders 👋
THETA coin is first one today that caught our attentions here with a good potential for a drop to happen. We are going to keep an eye on that neckline zone but also remember that previously we have had some nasty liquidity grabs. What do you think guys?
If we see this kind of struggle more then there is a good chance for a drop to happen!
If you like ideas provided by our team you can show us your support by liking and commenting.
Yours Sincerely,
Swallow Team
Disclamer:
We are not financial advisors. The content that we share on this website are for educational purposes and are our own personal opinions.
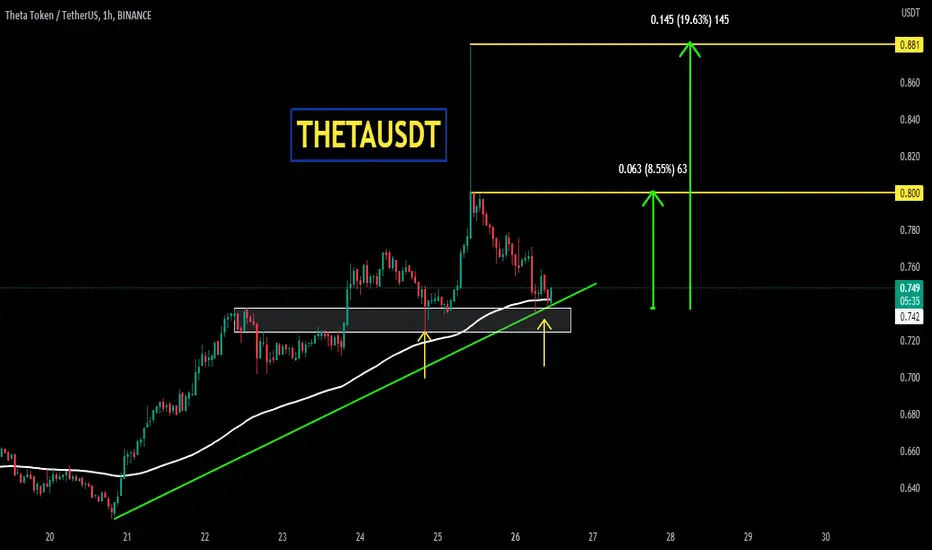
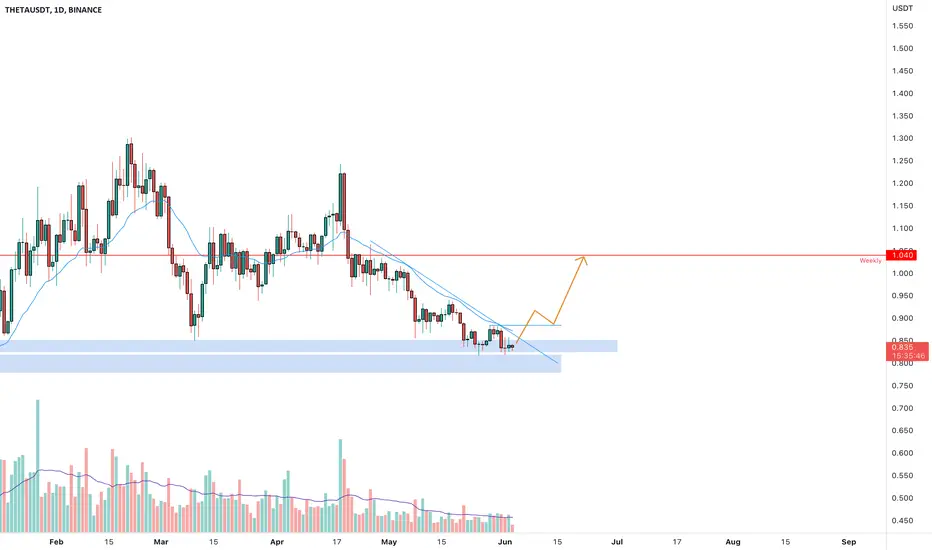
The key is whether you can rise with support in the 0.799-0.871 hello?
Traders, welcome.
If you "Follow", you can always get new information quickly.
Please also click "Boost".
Have a good day.
-------------------------------------
(THETAUSDT chart)
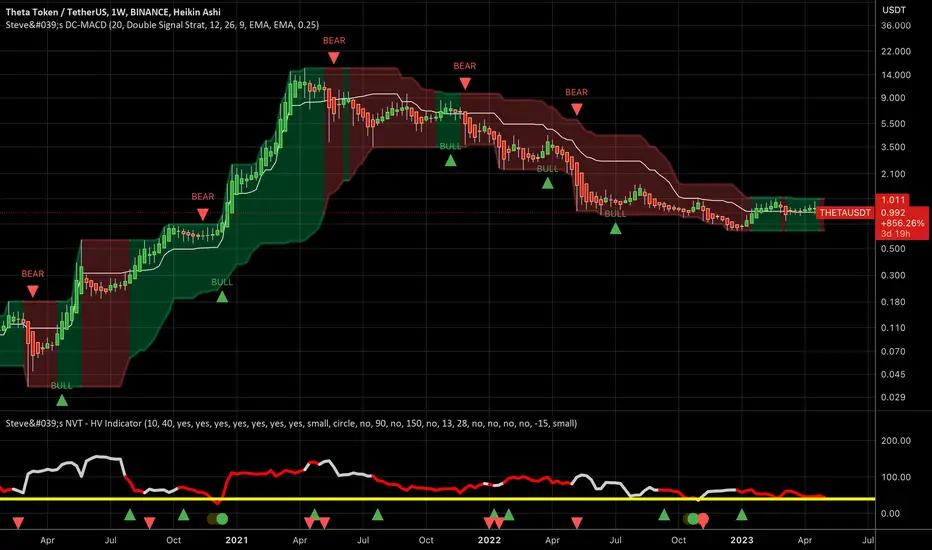
Looking at the 1M chart,
There is a possibility that a full-fledged uptrend will begin only when it rises above 1.127.
Looking at the 1W chart,
A rise above 1.336 is expected to initiate an uptrend.
In order to do so, it is important to be able to sustain the price by rising above 0.764.
The Bollinger Bands are contracting, but they are near the bottom, so trading with caution is advised.
(1D chart)
We need to see if we can keep the price above 0.660-0.714.
However, when it is supported and rises in the 0.799-0.871 section, it is a buying season.
1st: 1.127
2nd: 1.336-1.401
Split selling is possible when resistance is received in the first and second sections above.
If it falls below 0.660 and is resisted, it may fall to around 0.316, so countermeasures are needed.
If you buy because the price is cheap, you may need to wait for a considerable period because you never know when the trend will turn upside down.
Therefore, it is best to get a good idea of when prices are starting to rise and start buying near them.
To do so, you can look at the 1M, 1W, and 1D charts, identify the corresponding important sections, that is, support and resistance points or sections, and create a trading strategy tailored to your investment period.
The 0.799-0.871 section, which is the buying period mentioned above, corresponds to the section where buying is likely to start in that sense.
However, in the mid- to long-term, it is when the price rises above 1.336, and in the long-term, when it rises above 1.127, it is the time to buy.
-------------------------------------------------- -------------------------------------------
** All descriptions are for reference only and do not guarantee profit or loss in investment.
** Even if you know other people's know-how, it takes a considerable period of time to make it your own.
** This is a chart created with my know-how.
---------------------------------


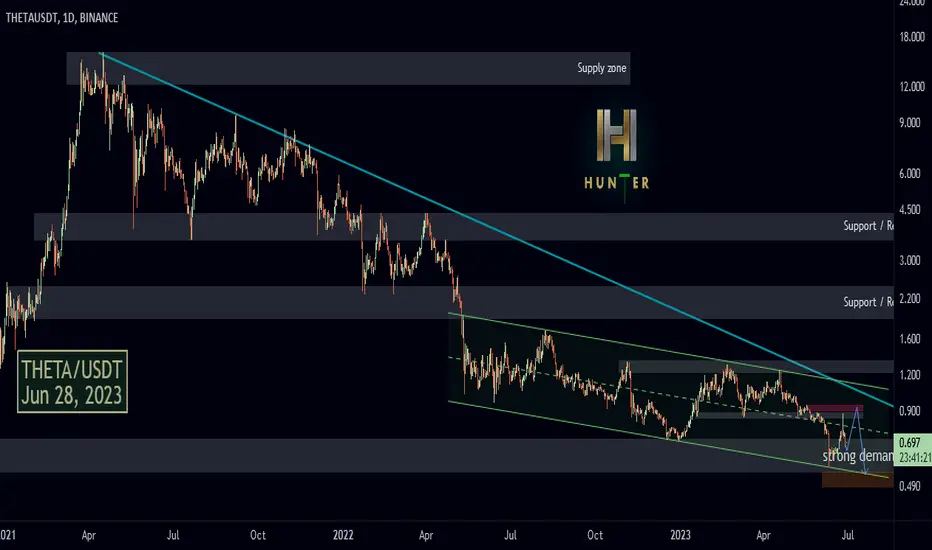
THETA/USDT daily: Refueling for flight!THETA is moving in a descending channel after a heavy drop and has reached an important support area with a lot of liquidity behind it.
Expected to start an upward wave to the $2 range after collecting existing liquidity and completing institutional orders.
Please zoom out on the chart to see the details
Thank you for your support 🙏
Theta Network bullish move incoming? 👀 🚀Theta Today Analysis💎 THETA is primed for a bullish surge, as it's currently situated in a high-demand zone and is anticipated to break above the channel.
💎An intriguing observation is that it is maintaining a strong position above the EMA 50. If it manages to close another candle above , it would signal an opportune moment for trading.
💎The Box could see a price bounce-back. If the price breaks below this box, we could anticipate a downward move, with Support -1 and Support -2 serving as potential areas for this downward shift
💎In the dynamic world of crypto, staying informed and adaptable is key. Stay tuned for more updates and enjoy your trading journey

THETAUSDT THETAUSDT is seems to be in good bullish buildup. Currently the instrument is testing the support area and it seems like the price is going to bounce from this level.
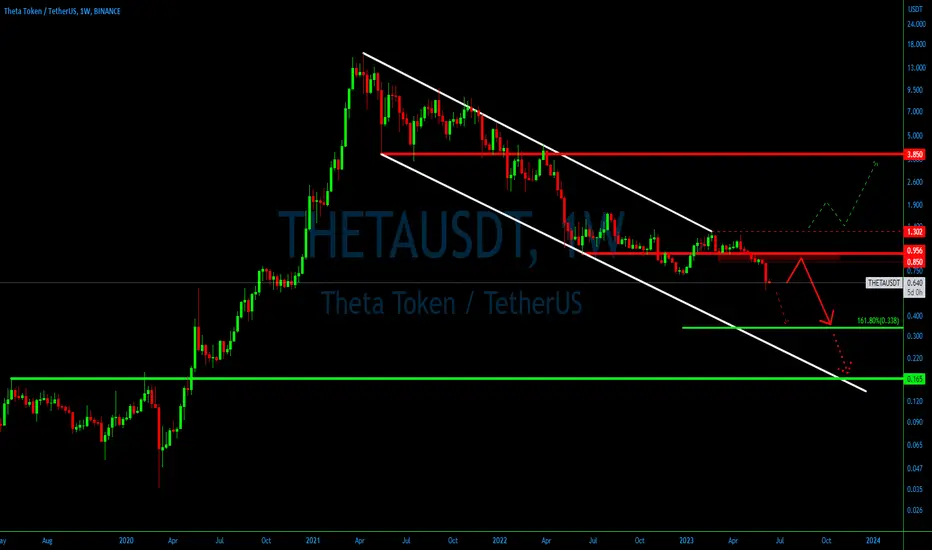
#THETAUSDT Pullback: A Prelude to a Steep Price Decline💎 Paradisers, let's dive into the weekly chart of #THETAUSDT. Within the descending channel, it continues to validate the long-term downtrend. Last week witnessed #THETA reaching its lowest price since November 2020, marking a new lower low.
💎 Examining the current price action, we see that the weekly closing price has stopped out most buyers while triggering new sell orders. Although the probability of the downtrend persisting remains high, this may not be the optimal selling point. Typically, prices experience a pullback towards strong resistance levels, and in our case, that would be the $0.85 - $0.95 supply zone. As a result, smart bears are likely to await a correction before taking any action. However, we must also remain prepared for a swift drop.
💎 Overall, the downtrend could find support at two key zones: the 161.8% Fibonacci level at $0.33 and the previous supply area at $0.16. Looking at our downside targets, we anticipate a significant decline, possibly ranging from 60% to 80% from the resistance area. While this scenario holds a higher probability, we must not ignore the less likely outcome—a trend reversal to the upside. To initiate an upward movement, #THETA must confidently break above the $1.3 resistance level, supported by substantial volume and a weekly close above this threshold. However, for now, the trend remains heavily bearish.
💎 Stay alert and trade wisely, Paradisers! Your ParadiseTeam 🌴
THETA ANALYSIS 4H Hi, dear traders. how are you ? Today we have a viewpoint to SELL/SHORT the THETA symbol.
For risk management, please don't forget stop loss and capital management
When we reach the first target, save some profit and then change the stop to entry
Comment if you have any questions
Thank You
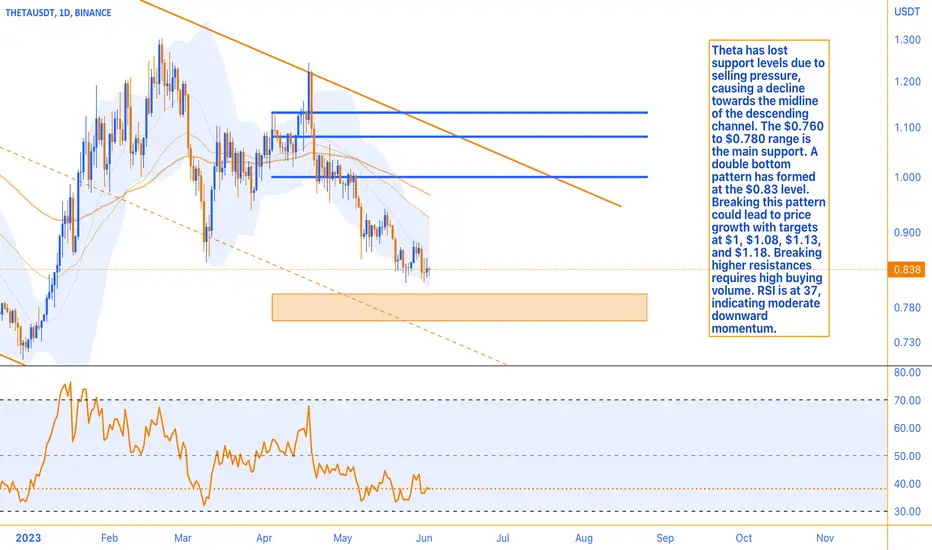
Selling Pressure and Seeks Support Amidst DowntrendTheta has faced significant selling pressure, resulting in the loss of support at various levels. These levels have now turned into resistance, causing the price to decline towards the midline of the descending channel. The main support range for Theta is currently considered to be between $0.760 and $0.780. However, the $0.83 support level has held strong, forming a double bottom pattern at this level and the midline of the channel. If this pattern is confirmed and the upper boundary is broken, we can expect price growth and the end of the correction wave in the weekly timeframe. Price targets are projected at $1, $1.08, $1.13, and $1.18. Breaking the third and fourth resistances, which align with the channel's ceiling, would require significant buying volume. The Relative Strength Index (RSI) is currently at 37, indicating moderate downward momentum for Theta.
THETAUSDT is in demand zoneTHETAUSDT ,Currently, it is observed that THETAUSDT is inside a big demand zone. According to Plancton's Rules, if the price manages to have a breakout from this zone, it could present a potential opportunity for a new long position.
Being inside a big demand zone suggests that there is a significant level of buying interest and support for THETAUSDT at the current price levels. This zone represents an area where buyers are expected to step in and create demand, potentially leading to an upward price movement.
Traders following Plancton's Rules would closely monitor the price action within this demand zone, looking for signs of a breakout. A breakout occurs when the price convincingly moves above a key resistance level, indicating a shift in market sentiment and the potential for a sustained upward move.
If the price of THETAUSDT successfully breaks out from the big demand zone, traders adhering to Plancton's Rules may consider initiating a new long position.
–––––
Follow the Shrimp 🦐
Keep in mind.
🟣 Purple structure -> Monthly structure.
🔴 Red structure -> Weekly structure.
🔵 Blue structure -> Daily structure.
🟡 Yellow structure -> 4h structure.
⚫️ Black structure -> <= 1h structure.
Follow the Shrimp 🦐
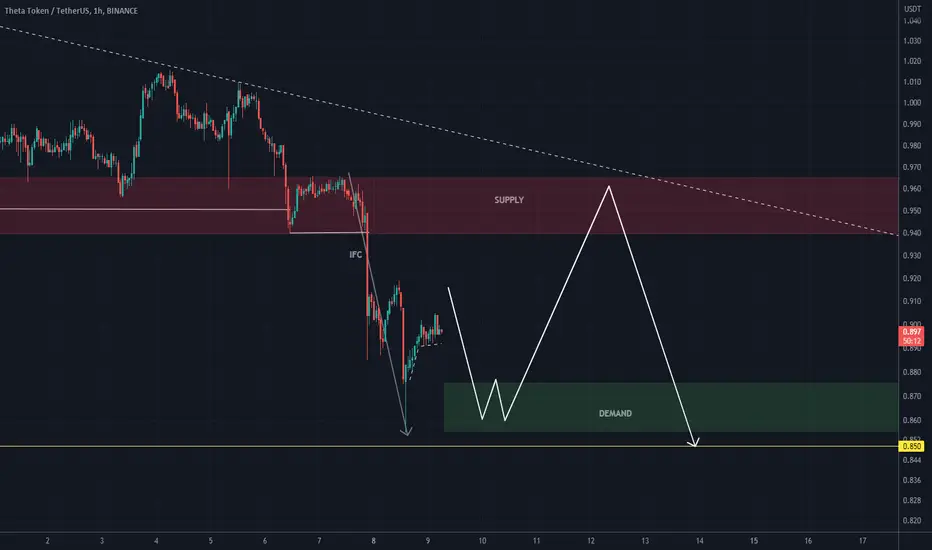
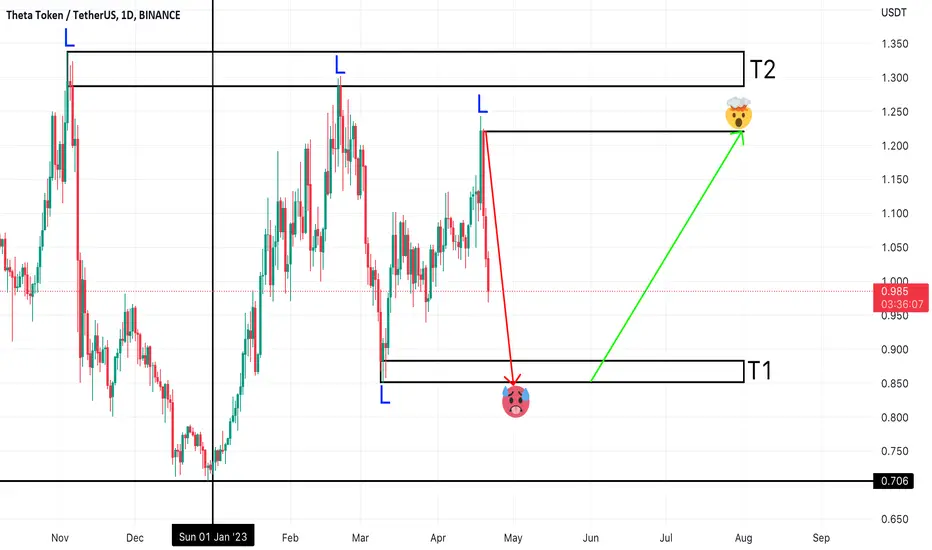
THETA - Wheres The Liquidity?Analysis:
Support & Resistance
Supply & Demand
Liquidity Points
Trend Line
T1: Target 1 (Bears)
T2: Target 2 (Bulls)
L: Liquidity Points
Opinion:
First Theta will grab the money beneath $0.86
Then Theta will grab the money above $1.33
Bears focus on shorts and take profit beneath T1
Bulls have cash ready to buy the dip and take profit above T2
Will update as price moves along
Thetausdt,1h long positionTheta has reached structural base and we can expect growth from the zone.
It has 2 entry prise and with high risk.
Max leverage:5X
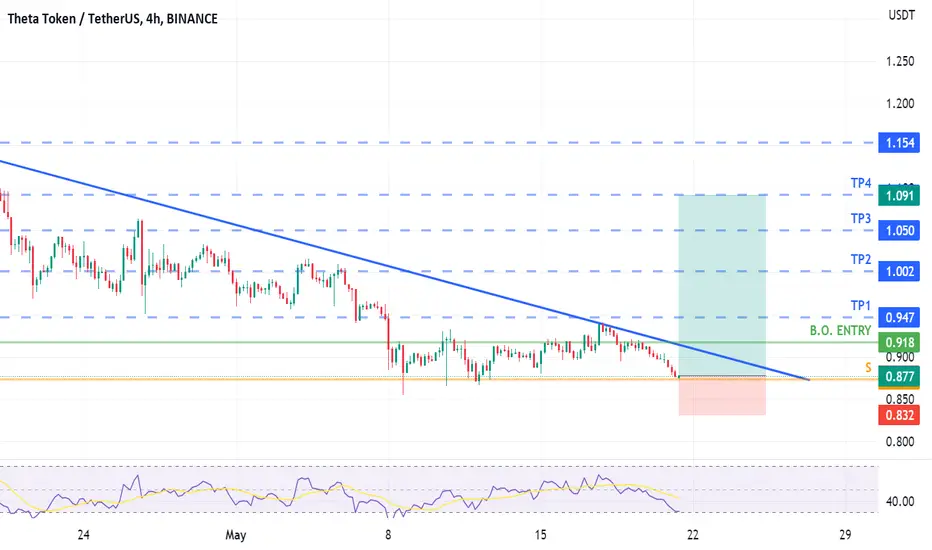
THETA LONG IDEATHETA is sitting at support level, I'm making an aggressive entry at 0.878, Stop lost -5% (Spot) or -10% (2xLev), possible profits 24-48%. For better results you can wait for the break and retest of the falling wedge the Breakout entry would be around 0.918.
This trade was made for testing my strategy. Fell free to share your thoughts.
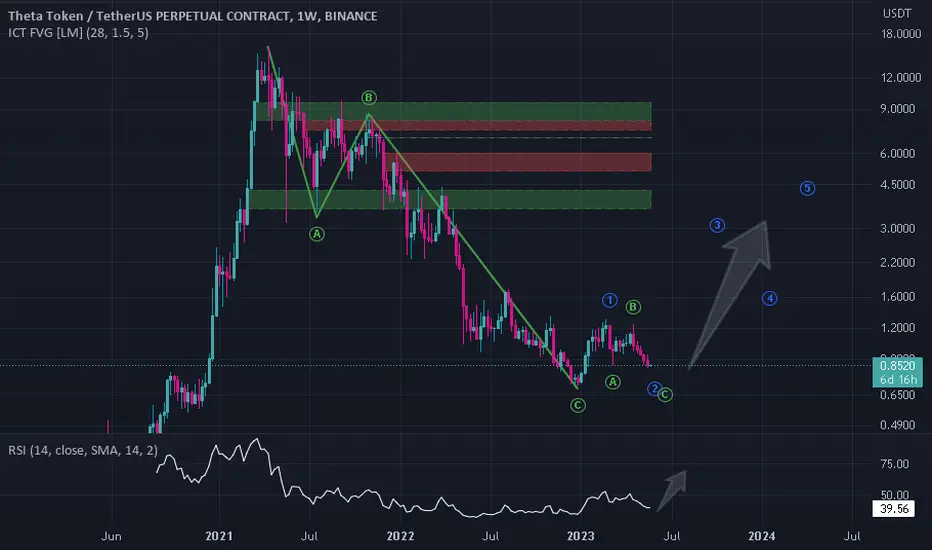
Theta ready to pumpA clear end to the correction at 0,83c for Theta has begun according to my analysis.
I am expecting an uptrend to form for the next few months ahead.
An invalidation would be the break of the previous low of 0,7c
Not financial advice
Happy Trading
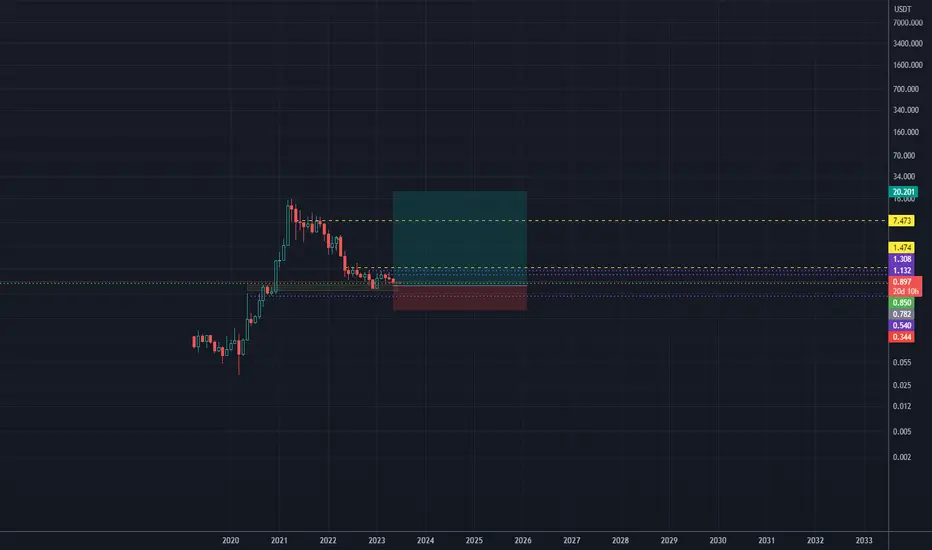
Theta monthly chart Price nw at 0.90 cts. Here are the opportunities looking 2025 + . Buy and forget about it is the idea. What can go wrong??
THETAUSDT Long Idea, Double BottomI would go for a long... what Strategie we use on this example ? :))))
This could be a nice example: OKX:THETAUSDT
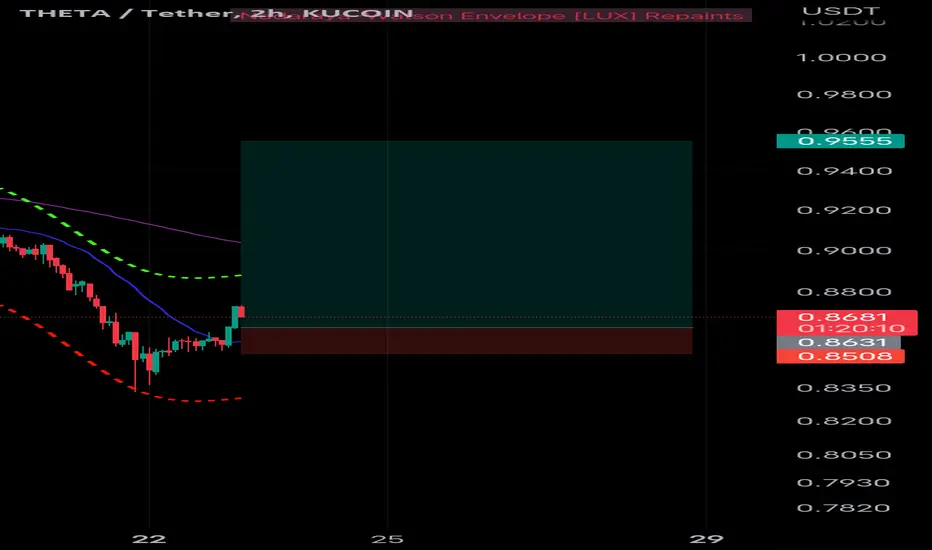
THETA Long Scalp
EP : Market Order - 0.895
TP: 0.903
TP: 0.910
TP: 0.920
SL : 27850
If you are interested to start leveraged trading, why not practise your trading strategies on TradingView. So what are you waiting for Trade like a pro on OKI and connect with TradingView. ;)
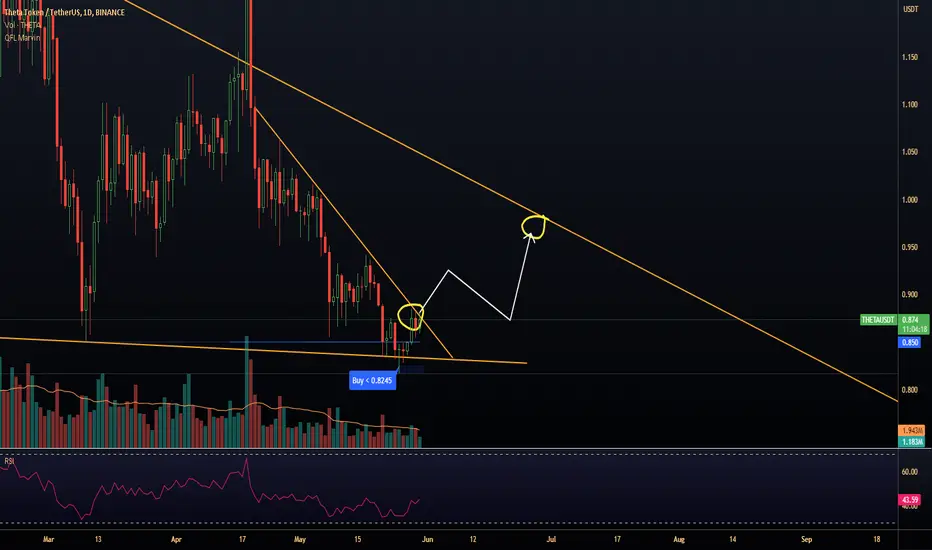
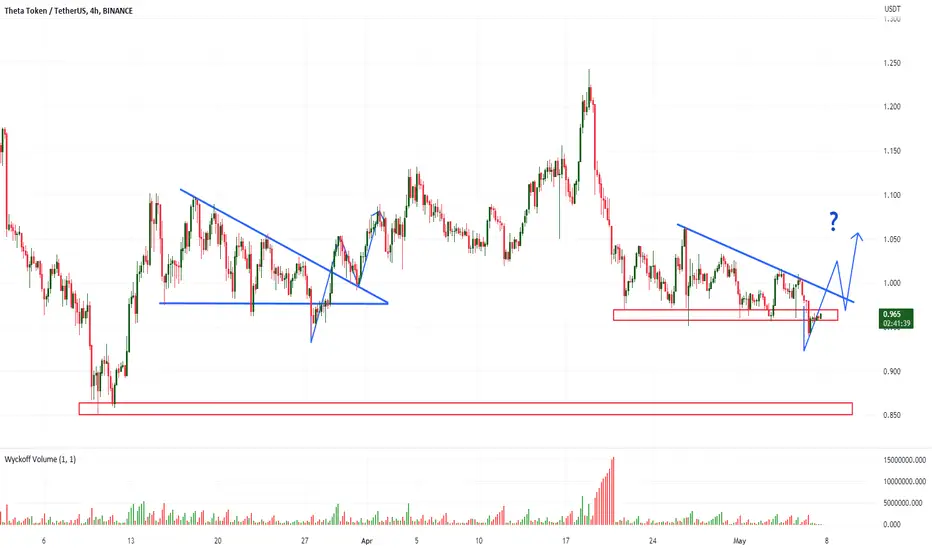
Falling Wedge Pattern What do you think about this setup?
A very similar setup appeared on the same support a few days earlier. Prices are near an important support area. I will take Long only if:
1.Prices will breakup triangle - 1h/4h
2. We will have pull back to breakup level as test of breakout
3. Volume confirmation on smaller time frame after pull back - 15-60min
Follow for updates!
VolumeDayTrader
THETHA/USDT on the edge to breakdown! Hey guys 👋
THETA coin seems good for breakdown as well - waiting for a confirmation where price should secure the zone below that formation and we good to go!!
If you like ideas provided by our team you can show us your support by liking and commenting.
Yours Sincerely,
Swallow Team
Disclamer:
We are not financial advisors. The content that we share on this website are for educational purposes and are our own personal opinions.

THETA/USD looks to turning around to the upside!Based on the weekly candles and moving average, combined with the THETA Network's development and partnership news, including Cannes 2023, the price action looks to be moving to the upside.